

Associative responses to visual shape stimuli in the mouse auditory cortex
- PMID: 31581242
- PMCID: PMC6776301
- DOI: 10.1371/journal.pone.0223242
Associative responses to visual shape stimuli in the mouse auditory cortex
Abstract
Humans can recall various aspects of a characteristic sound as a whole when they see a visual shape stimulus that has been intimately associated with the sound. In subjects with audio-visual associative memory, auditory responses that code the associated sound may be induced in the auditory cortex in response to presentation of the associated visual shape stimulus. To test this possibility, mice were pre-exposed to a combination of an artificial sound mimicking a cat's "meow" and a visual shape stimulus of concentric circles or stars for more than two weeks, since such passive exposure is known to be sufficient for inducing audio-visual associative memory in mice. After the exposure, we anesthetized the mice, and presented them with the associated visual shape stimulus. We found that associative responses in the auditory cortex were induced in response to the visual stimulus. The associative auditory responses were observed when complex sounds such as "meow" were used for formation of audio-visual associative memory, but not when a pure tone was used. These results suggest that associative auditory responses in the auditory cortex represent the characteristics of the complex sound stimulus as a whole.
Conflict of interest statement
The authors have declared that no competing interests exist.
Figures
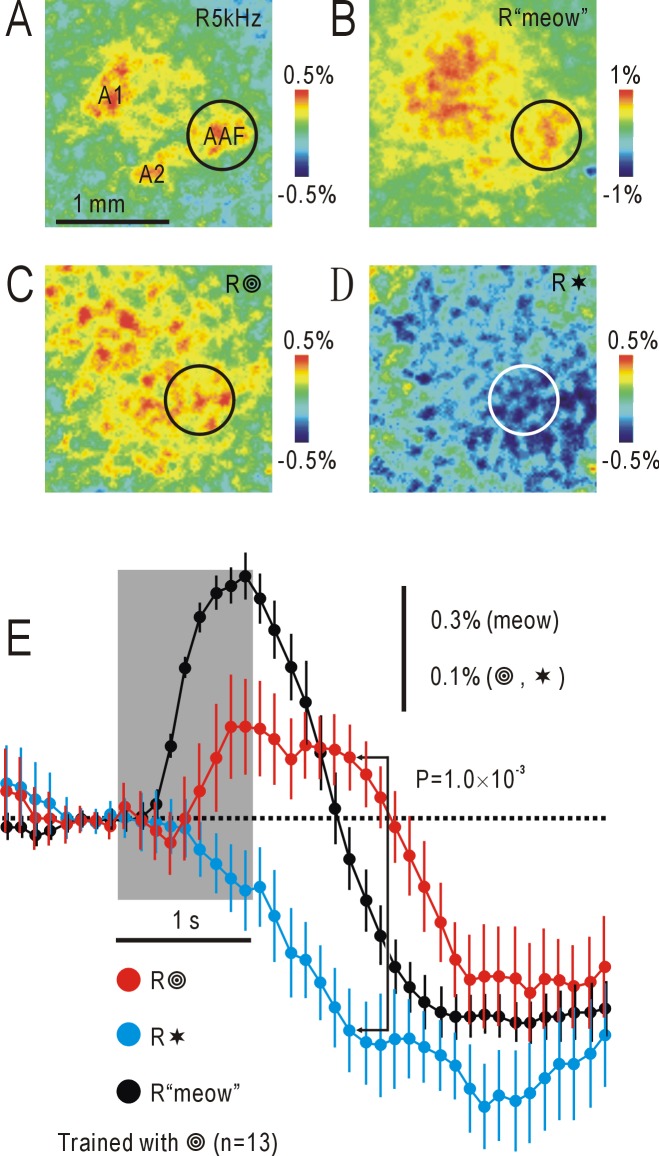
 ). Diffuse increases in ΔF/F0 were observed in the AC. (D) Responses to stars (control shape stimulus) (R✶). Diffuse decreases in ΔF/F0 were observed in the AC. Data shown in (C) and (D) were obtained from the same mouse, and recorded 1.8 s after stimulus onset. (E) Time courses of ΔF/F0 within the circular ROI centered on AAF in 13 mice. Dots with lines show means and SEMs. Vertical scale bar: 0.3% for ΔF/F0 in response to the “meow” sound, 0.1% in response to visual shape stimuli. Shaded square shows the timing of stimulus presentation.
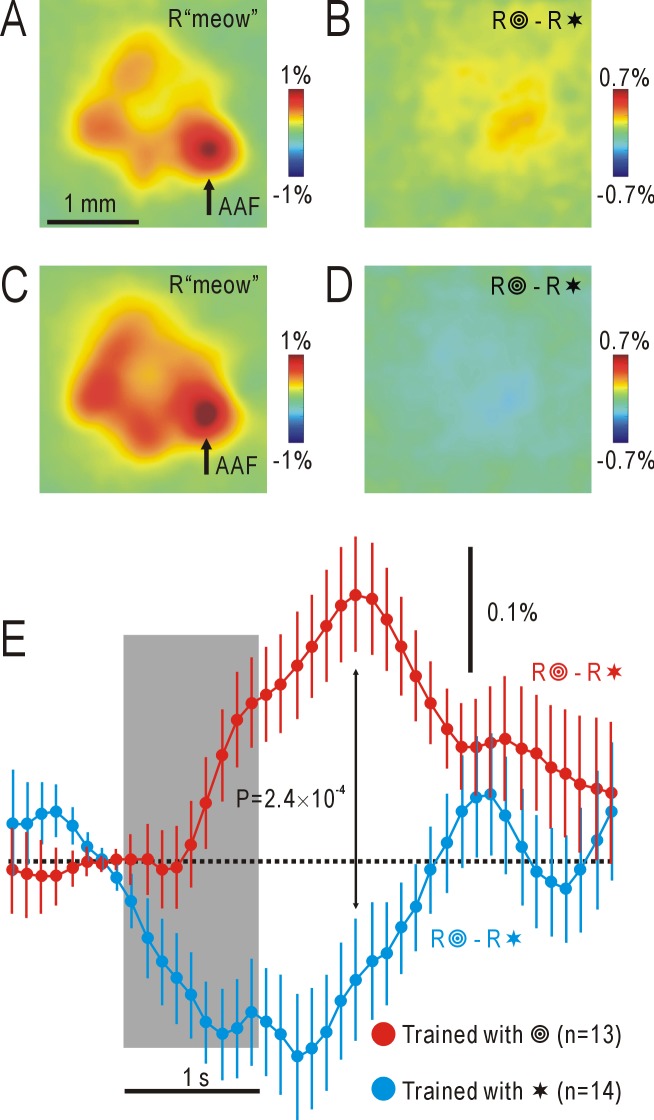
 —R✶). Note the responses with positive amplitudes. (C) Averaged responses in the AC to the “meow” stimulus in 14 mice pre-exposed to a combination of the “meow” sound and stars (R“meow”). (D) Associative auditory responses calculated as the differential responses to concentric circles (control) and stars (test) in the same 14 mice shown in (C) (R
 —R✶). Note the responses with negative amplitudes. Data shown in (A) and (C) were recorded 1 s after stimulus onset, and those in (B) and (D) were recorded 1.8 s after stimulus onset. (E) Time courses of ΔF/F0 within the circular ROI centered on AAF in (B) and (D). Dots with lines show means and SEMs.
References
-
- Kaas JH, Hackett TA. 'What' and 'where' processing in auditory cortex. Nat Neurosci. 1999; 2: 1045–1047. - PubMed
Publication types
MeSH terms
LinkOut - more resources
Full Text Sources
Miscellaneous
