

Metabolite Profiles of Incident Diabetes and Heterogeneity of Treatment Effect in the Diabetes Prevention Program
- PMID: 31582408
- PMCID: PMC6868469
- DOI: 10.2337/db19-0236
Metabolite Profiles of Incident Diabetes and Heterogeneity of Treatment Effect in the Diabetes Prevention Program
Abstract
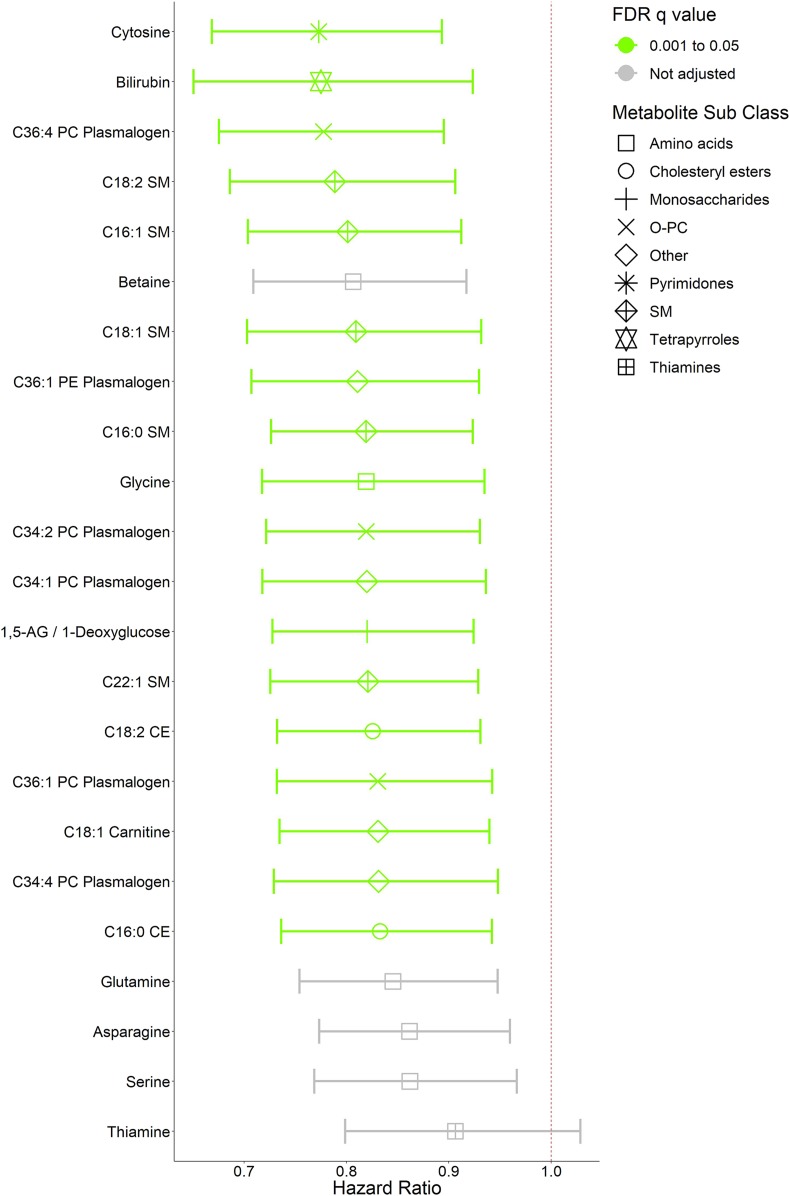
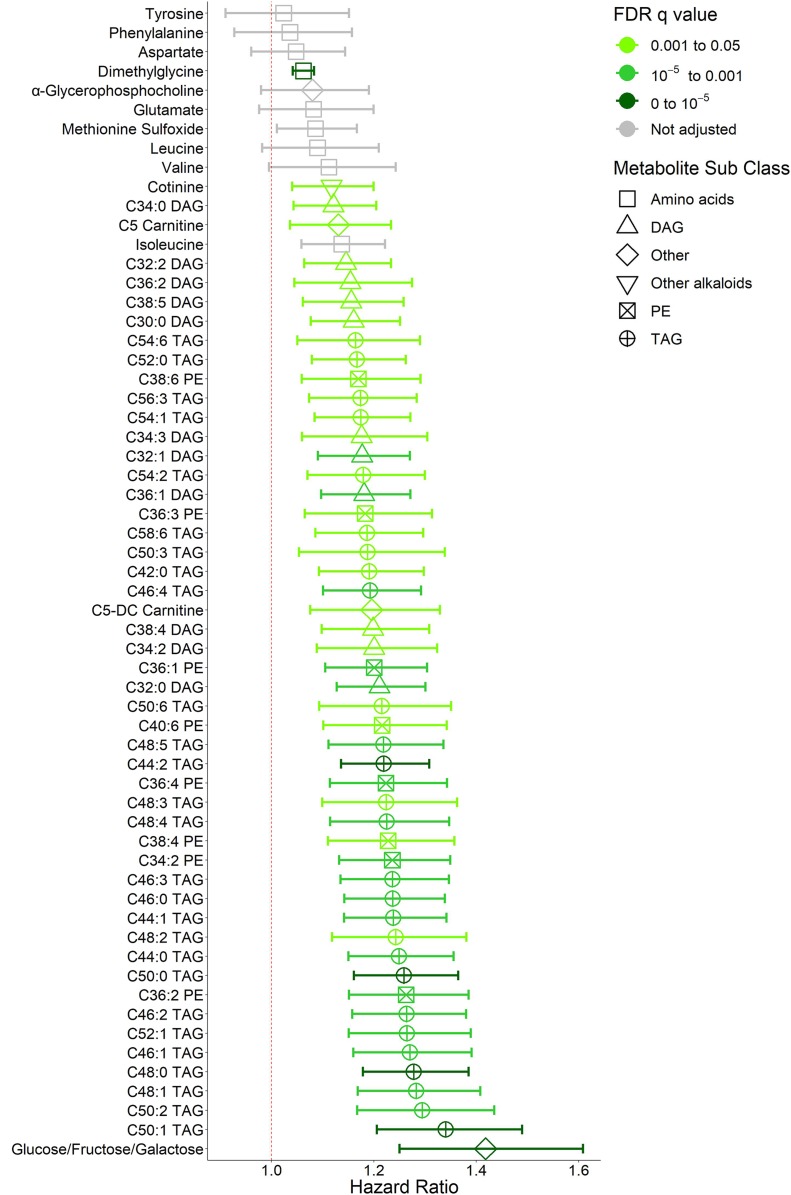
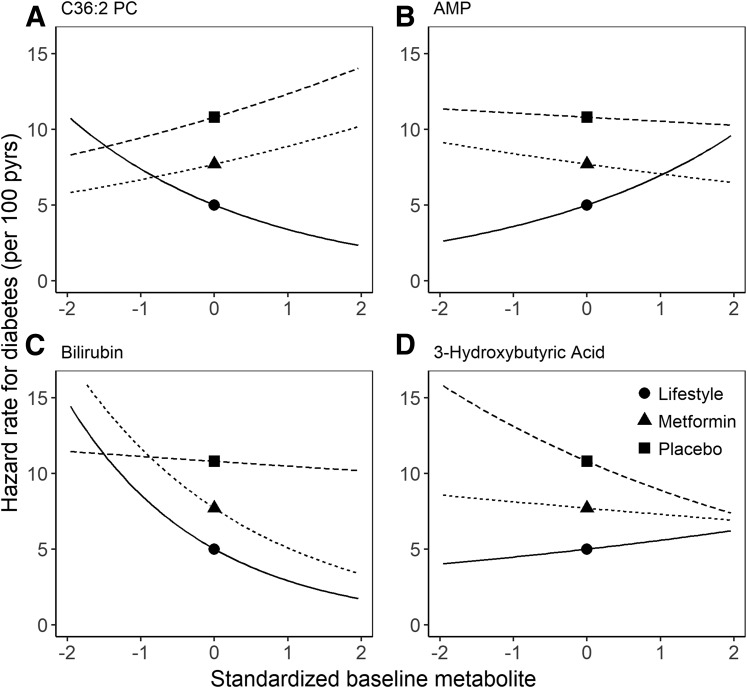
Novel biomarkers of type 2 diabetes (T2D) and response to preventative treatment in individuals with similar clinical risk may highlight metabolic pathways that are important in disease development. We profiled 331 metabolites in 2,015 baseline plasma samples from the Diabetes Prevention Program (DPP). Cox models were used to determine associations between metabolites and incident T2D, as well as whether associations differed by treatment group (i.e., lifestyle [ILS], metformin [MET], or placebo [PLA]), over an average of 3.2 years of follow-up. We found 69 metabolites associated with incident T2D regardless of treatment randomization. In particular, cytosine was novel and associated with the lowest risk. In an exploratory analysis, 35 baseline metabolite associations with incident T2D differed across the treatment groups. Stratification by baseline levels of several of these metabolites, including specific phospholipids and AMP, modified the effect that ILS or MET had on diabetes development. Our findings highlight novel markers of diabetes risk and preventative treatment effect in individuals who are clinically at high risk and motivate further studies to validate these interactions.
© 2019 by the American Diabetes Association.
Figures
References
-
- Lu Y, Wang Y, Ong C-N, et al. Metabolic signatures and risk of type 2 diabetes in a Chinese population: an untargeted metabolomics study using both LC-MS and GC-MS. Diabetologia 2016;59:2349–2359 - PubMed
Publication types
MeSH terms
Substances
Grants and funding
- U01 DK048434/DK/NIDDK NIH HHS/United States
- U01 DK048413/DK/NIDDK NIH HHS/United States
- R01 DK081572/DK/NIDDK NIH HHS/United States
- R01 DK078907/DK/NIDDK NIH HHS/United States
- R01 HL142856/HL/NHLBI NIH HHS/United States
- M01 RR016587/RR/NCRR NIH HHS/United States
- U01 DK048339/DK/NIDDK NIH HHS/United States
- U01 DK048443/DK/NIDDK NIH HHS/United States
- U01 DK048400/DK/NIDDK NIH HHS/United States
- T32 HL007374/HL/NHLBI NIH HHS/United States
- U01 DK048468/DK/NIDDK NIH HHS/United States
- U01 DK048407/DK/NIDDK NIH HHS/United States
- U01 DK048437/DK/NIDDK NIH HHS/United States
- U01 DK048406/DK/NIDDK NIH HHS/United States
- K24 DK110550/DK/NIDDK NIH HHS/United States
- U01 DK048412/DK/NIDDK NIH HHS/United States
- P30 DK040561/DK/NIDDK NIH HHS/United States
- U01 DK048375/DK/NIDDK NIH HHS/United States
- R01 DK117144/DK/NIDDK NIH HHS/United States
- P30 DK097512/DK/NIDDK NIH HHS/United States
- U01 DK048397/DK/NIDDK NIH HHS/United States
- U01 DK048381/DK/NIDDK NIH HHS/United States
- U01 DK048514/DK/NIDDK NIH HHS/United States
- U01 DK048485/DK/NIDDK NIH HHS/United States
- T32 DK007516/DK/NIDDK NIH HHS/United States
- U01 DK048404/DK/NIDDK NIH HHS/United States
- U01 DK048489/DK/NIDDK NIH HHS/United States
- U01 DK048349/DK/NIDDK NIH HHS/United States
- U01 DK048377/DK/NIDDK NIH HHS/United States
- P30 DK017047/DK/NIDDK NIH HHS/United States
LinkOut - more resources
Full Text Sources
Medical
Miscellaneous
