. 2019 Nov 1;33(21-22):1506-1524.
doi: 10.1101/gad.330837.119. Epub 2019 Oct 3.

Structural basis for distinct roles of SMAD2 and SMAD3 in FOXH1 pioneer-directed TGF-β signaling

Affiliations

Structural basis for distinct roles of SMAD2 and SMAD3 in FOXH1 pioneer-directed TGF-β signaling

Eric Aragón et al. Genes Dev. .

Abstract

TGF-β receptors phosphorylate SMAD2 and SMAD3 transcription factors, which then form heterotrimeric complexes with SMAD4 and cooperate with context-specific transcription factors to activate target genes. Here we provide biochemical and structural evidence showing that binding of SMAD2 to DNA depends on the conformation of the E3 insert, a structural element unique to SMAD2 and previously thought to render SMAD2 unable to bind DNA. Based on this finding, we further delineate TGF-β signal transduction by defining distinct roles for SMAD2 and SMAD3 with the forkhead pioneer factor FOXH1 as a partner in the regulation of differentiation genes in mouse mesendoderm precursors. FOXH1 is prebound to target sites in these loci and recruits SMAD3 independently of TGF-β signals, whereas SMAD2 remains predominantly cytoplasmic in the basal state and set to bind SMAD4 and join SMAD3:FOXH1 at target promoters in response to Nodal TGF-β signals. The results support a model in which signal-independent binding of SMAD3 and FOXH1 prime mesendoderm differentiation gene promoters for activation, and signal-driven SMAD2:SMAD4 binds to promoters that are preloaded with SMAD3:FOXH1 to activate transcription.

Keywords: FOXH1; SMAD2; SMAD2 structure; SMAD3; TGF-β signaling; embryonic stem cell; mesendoderm differentiation; pioneer transcription factor.


Figures

Figure 1.
Figure 1.
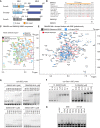
SMAD2 binding to DNA. (A) Schematic representation of SMAD2, 2β, and SMAD3 proteins. (B) Sequence conservation of the SMAD2 E3 insert. Aromatic and hydrophobic residues are bolded in the human sequence. Nonidentical residues are highlighted in red. Human SMAD2β and SMAD3 are included for comparison. (C) Overlay of 1H,15N-HSQC region (full experiment shown as SF1D) recorded at 600 MHz, SMAD2 in blue, SMAD2β in beige. Some residues are labeled and color-coded by region. (D) Native polyacrylamide gel electrophoresis mobility shift assays (EMSA) with the indicated concentrations of human SMAD MH1 domains and cy5-labeled SBE probe. (E) MH1 domain binding to DNA using nuclear magnetic resonance (NMR). Residues affected upon addition of the DNA are labeled in red. Unaffected residues are labeled in black. (F) EMSA with the indicated concentrations of full-length SMAD2 and SMAD4 proteins and cy5-labeled Gsc1 5GC probe. (G) EMSA with SMAD2 MH1 protein, cy5-SBE probe, and the indicated molar excess of unlabeled SBE probe or a nonbinding AT-rich probe.
Figure 2.
Figure 2.
X-ray crystal structure of the SMAD2β MH1 domain bound to DNA. (A) Model structure of SMAD2β MH1 domain (beige) bound to the SBE motif (gray), refined at 2.7 Å resolution. Elements of secondary structure, residues that interact with DNA or that coordinate a Zn atom are indicated. The entire ASU is shown as Supplemental Figure S1A. (B) Close view of the binding site, with residues and bases involved in hydrogen bonds labeled. The stereo view representation of the electron density contoured at 1σ level (2Fo-Fc) is shown as Supplemental Figure S2B. The DNA-binding hairpin sequence and the residue numbering based on the SMAD2 sequence are indicated. (C) Schematic representation of the intermolecular protein–DNA contacts. Dashed lines indicate hydrogen bonds (HB) color-coded by interaction type. Solid lines indicate residues involved in van der Waals interactions or in reducing the solvent accessible area of the DNA as determined with DnaproDB (Sagendorf et al. 2017). (D) EMSA with two SMAD2β point mutations (R116 and at K121) and the cy5-labeled SBE probe kept at 7.5-nM concentration. The mutants showed a negligible ability to interact with DNA. 1D NMR experiments showing that the samples are properly folded are shown in Supplemental Figure S2F. (E) DNA shape comparison of SMAD2β bound to GTCTG site (this work, PDB: 6H3R), SMAD3 bound to GTCT or GGCT sites (PDB entries:1OZJ and 5ODG). Major groove width (top) and depth (bottom) were calculated using Curves+ (Lavery et al. 2009). Since the GTCT and GGCT sites are shorter than the GTCTG site, the gaps in the palindromic sequence are indicated as dashed lines. (F) Comparison of SMAD3 (graphite and orchid ribbons) and SMAD4 (green) MH1 complexes to that of SMAD2β (gold) bound to GTCTG site. All MH1 domains are very similar. The differences are observed in two loops (loop1 or G-loop and loop3) as well as at the length of helix α2 (indicated by an arrow). DNA shown is that of the SMAD2β structure (white ribbon).
Figure 3.
Figure 3.
SMAD2 MH1 conformations in solution. (A) Overlay of the SMAD2β MH1 domain (beige) to different NMR-based models of the SMAD2 MH1 domain (blue) determined using NMR restrains and pyRosetta. Contacts used to determine the MH1 fold are labeled and shown in yellow (aromatic residues), brown (hydrophobic residues), and red (DNA-binding hairpin). The elements of secondary structure were determined based on 13C chemical shifts and NOEs. The MH1 core is shown in blue and the E3 insert is depicted in chartreuse. Observed NOEs are represented as dashed lines. (B) The sequence of the E3 insert (orange) and the elements of secondary structure are schematically indicated at the top. Residues affected upon DNA binding are underlined. Different orientations of the E3 are shown (open in chartreuse, closed in dark red. Conformations were calculated as described in the text. (C) Key features of the E3 insert. Secondary structure elements (chartreuse) were determined by the α, HN(1, 1+3) pattern of NOEs and by 13C values. Residues involved in packing of the helices are shown in dark green and are labeled. Contacts are indicated by a dashed line. (D) Overlay of the NMR SMAD2 open conformation (blue) and SMAD2β (PDB:6H3R, beige) complex. In the SMAD2 open conformation the β2-β3 DNA-binding hairpin is accessible. (E) Small angle X-ray scattering (SAXS) analysis of the SMAD2 (blue) and SMAD2β (beige) MH1 domains. Experimental and graphical output of the best fit are shown for each protein. Residuals for the fittings are shown below the data. (F) SMAD2 MH1 open conformation (blue) superimposed to the DNA as bound in the SMAD2β complex. Residues displaying chemical-shift changes are indicated in orange and labeled. Contacts with the major groove are conserved in both isoforms. The “SEQTR” fragment present in the E3 insert only, lies in the proximity of the minor groove. The starting and ending points of the E3 insert are indicated. A 90° rotation is shown as Supplemental Figure S3B.
Figure 4.
Figure 4.
SMAD2, SMAD2β, and SMAD3 in mESCs. (A) Western immunoblotting analysis of SMAD2, SMAD2β, and SMAD3 in the indicated mESC lines, using antibodies of the indicated specificity. Tubulin was used as a loading control. (B) Immunoblotting analysis of SMAD2, SMAD2β, and SMAD3 in wild-type mESCs and derived EBs. Cells were collected at indicated time point after LIF removal to allow EB formation. (Right) Plot of fluorescence intensity of the SMAD2, SMAD3, and SMAD2β bands determined using an Odyssey imaging system. (C) Immunoblotting of SMAD2, SMAD2β, and SMAD3 of cytosolic and nuclear fractions from wild-type and S2ΔE3 mESCs incubated with SB431542 (SB) for 6 h or Activin A (AC) for 1.5 h. Lamin B1 and tubulin were used as loading control for nuclear and cytosolic fractions. (Right) Plot of fluorescence intensity of the nuclear and cytosolic bands determined using an Odyssey imaging system and percentage of nuclear immunofluorescence for each sample. (D) mESCs were incubated with SB for 6 h or Activin for 1.5 h and fractionated into nuclear and cytosolic fractions. Anti-SMAD4 and anti-SMAD2/3 immunoblotting of aliquots from these samples (input) or of anti-SMAD2 and anti-SMAD3 immunoprecipitates was performed to determine the levels of SMAD2-bound and SMAD3-bound SMAD4. (E) Signal-dependent interaction of SMAD2 and SMAD2β with SMAD4. Wild-type and S2ΔE3 mESCs were incubated with SB for 6 h, followed by a 2-h incubation with SB or the indicated concentrations of Activin. Anti-SMAD4 immunoprecipitates from these cells were subjected to anti-SMAD2/2β or anti-SMAD4 immunoblotting. The densities of SMAD2 or SMAD2β pulled down by SMAD4 were measured by Odyssey imaging system and marked below the immunoblotting.
Figure 5.
Figure 5.
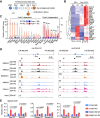
SMAD binding to FOXH1 pioneer-dependent mesendoderm genes. (A) Scheme of ES-E14TG2a.4 mESC differentiation into EBs rich in mesendoderm progenitors. Differentiation is enabled by placing of mESCs in media devoid of LIF. Starting on days 2–3, EB start expressing mesendoderm genes and losing expression of pluripotency genes. The process is driven by autocrine Nodal in a feedforward loop. Mesendoderm gene expression peaks on day 4, but day-3 EBs can be stimulated to acutely increase the expression of these genes by treatment with Activin A, which signals through Activin/Nodal receptors. Activin addition to cells in the ESC stage increases the expression of certain pluripotency genes (e.g., Nanog) and negative feedback genes (e.g., Smad7, Skil), but the cells are not yet competent to respond to Activin with mesendoderm gene expression (Wang et al. 2017) and refer to B. (B) Heatmap showing the expression of Activin-responsive genes in mESCs and day-3 EBs treated with SB431542 (SB) or Activin (AC) for 1.5 h and analyzed by RNA-seq (GSE70486). Two biological replicates per condition were analyzed. (C) FOXH1 dependence of Activin gene response. mRNA levels of select Activin-responsive genes were determined by qRT-PCR analysis of wild-type and Foxh1–/– EBs treated with SB or AC. mRNA levels of each gene are expressed relative to the levels in WT cells under SB treatment. N = 3. Error bars, S.D. P-values were calculated by unpaired t-test, (*) P < 0.05; (**) P < 0.01; ns, not significant. (D) SMAD and FOXH1 ChIP-seq tags on the Gsc and Eomes loci. Gene track view for SMAD2, SMAD3, SMAD4, and FOXH1 ChIP-seq data in ESCs, and day-3 EBs treated with SB or AC. Precleared chromatin prior to primary antibody addition (Input) is also shown. Tag densities normalized to reads per million reads. Gene bodies are schematically represented at the top of each track set. Closed arrowheads, proximal promoter (PP) sites; open arrowheads, distal enhancer (DE) sites used in E. (E) ChIP-qPCR analysis of SMAD4 binding to the PP and DE regions of Gsc, Eomes, and Foxa2 in wild-type (WT) and S2ΔE3 mESCs. N = 3; error bars represent SD, and P-values were calculated by t-test.
Figure 6.
Figure 6.
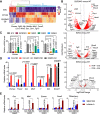
The SMAD2 E3 insert promotes Nodal-dependent mesendoderm gene expression. (A) Heatmap of the top 500 genes with the highest variance of expression between wild-type mESCs and day-4 EBs RNA-seq transcriptomic profiles and expression of these genes in day-4 S2/3DKO mESCs. Three classes are highlighted: (I) Genes expressed in mESCs and down-regulated in EBs; (II) genes up-regulated in wild-type EBs but not in S2/3DKO EBs, which include many mesendoderm differentiation genes; (III) genes up-regulated in wild-type as well as S2/3DKO EBs. Two biological replicates at each condition were analyzed. (B) Volcano plot of RNA-seq transcriptomic data of day-4 EBs derived from S2/3DKO, S2KO, S3KO cells, compared with wild-type EBs. Each red dot represents a gene that was differentially under- or overexpressed (false discovery rate <0.05) in the SMAD-deficient cells compared with wild type. Representative lineage specification genes for mesendoderm (T/Brachyury, Foxa2, Eomes, Mixl1, Gsc, Lhx1, Afp, Cer1, Fgf8, Fgf10, Fgf5, and Wnt8a), ectoderm (Nes, Pax6, Sox1, Tubbe, and Trp63), and extra-embryonic fates (H19, Rhox6, Rhox9, Plac1, Peg10, Ascl2, and Elf5) are highlighted. Two biological replicates for each condition were analyzed. (C) qRT-PCR analysis of representative mesendoderm genes (Eomes, Gsc, Foxa2) in day-4 EBs derived from wild-type, S2/3DKO, S2KO, or S3KO cells. N = 3; error bars represent SD, and P-values were calculated by t-test. (D) qRT-PCR analysis of the indicated mesendoderm genes and pathway feedback genes in day-3 EBs from wild-type or S2ΔE3 cells treated with SB or Activin for 2 h. Experiment performed in triplicate, one representative set of results is shown. Error bars represent SD and P-values were calculated by t-test. (E) qRT-PCR analyses of representative mesendoderm genes in day-3 EBs derived from Smad2–/– mESCs expressing HA-tagged human SMAD2, HA-tagged human SMAD2β, or empty vector as control (Con). Cells were treated with SB or Activin for 2h. mRNA levels of each gene are expressed relative to the SB condition in the control cells. N = 3, biological replicates; error bars represent S.D. Two-tailed Mann–Whitney test.
Figure 7.
Figure 7.
The SMAD2 E3 insert promotes early mouse development. (A) Schematic of embryo chimera generation by injecting mESCs expressing a constitutive mCherry marker into wild-type E3.5 blastocysts. Embryos were transferred to pseudopregnant females and dissected at E7.5 and E8.5 to assess development. (B) Chimeras, generated by injecting either WT or S3KO, S2KO, S2ΔE3, S2/3DKO, mESCs into WT E3.5 blastocysts were dissected at E7.5 and E8.5 and categorized based on gross morphology as normal/mild defects, developmentally retarded or severely abnormal. At E7.5, a small fraction of WT chimeras displayed small clumps of cells in the amniotic cavity, possibly as an artifact of the microinjection and hence were scored as abnormal. Numbers shown within the bars represent the number of chimeric embryos obtained and scored. (CG) Confocal sagittal optical sections of whole-mount immunostained chimeric embryos and cryosections of representative embryos. Dashed lines indicate approximate plane of section. Nuclei were stained with Hoechst. Note, mCherry fluorescence, marking mESC progeny, was diminished postfixation of whole-mount imaging and was not clearly observed after cryosectioning. Arrowheads in panel F mark abnormal cell masses protruding into the cavity. Dashed line in the last panel of panel F marks the presumptive boundary between the epiblast and extraembryonic mesoderm. Brackets demarcate the primitive streak (PS). HF, headfold; NT, neural tube; Al, allantois; Am, amnion; Epi, epiblast; ExM, extraembryonic mesoderm; ExE, extraembryonic ectoderm; meso, mesoderm; A, anterior; P, posterior; Pr, proximal; Ds, distal; L, left; R, right. Scale bars, 50 µm. (H) Model of Nodal/SMAD signaling in the activation of differentiation genes and in mouse mesendoderm progenitors. Mesendoderm differentiation genes (e.g., Gsc) are bound by the pioneer factor FOXH1, which recruits SMAD3 to regulatory elements in the absence of Nodal signals, whereas the unique E3 insert of SMAD2 conditionally limits DNA-binding activity and allows SMAD2 to remain poised for Nodal/Activin-driven binding of SMAD4 from signal transduction to the nucleus. Thus, a basal SMAD3–FOXH1 complex primes mesendoderm differentiation genes for regulation, whereas signal-driven SMAD2:SMAD4 complexes join SMAD3 and FOXH1 to trigger transcriptional activation.

References

    1. Aragon E, Goerner N, Zaromytidou AI, Xi Q, Escobedo A, Massagué J, Macias MJ. 2011. A Smad action turnover switch operated by WW domain readers of a phosphoserine code. Genes Dev 25: 1275–1288. 10.1101/gad.2060811 - DOI - PMC - PubMed
    1. Ashcroft GS, Yang X, Glick AB, Weinstein M, Letterio JL, Mizel DE, Anzano M, Greenwell-Wild T, Wahl SM, Deng C, et al. 1999. Mice lacking Smad3 show accelerated wound healing and an impaired local inflammatory response. Nat Cell Biol 1: 260–266. 10.1038/12971 - DOI - PubMed
    1. BabuRajendran N, Palasingam P, Narasimhan K, Sun W, Prabhakar S, Jauch R, Kolatkar PR. 2010. Structure of Smad1 MH1/DNA complex reveals distinctive rearrangements of BMP and TGF-β effectors. Nucleic Acids Res 38: 3477–3488. 10.1093/nar/gkq046 - DOI - PMC - PubMed
    1. Baburajendran N, Jauch R, Tan CY, Narasimhan K, Kolatkar PR. 2011. Structural basis for the cooperative DNA recognition by Smad4 MH1 dimers. Nucleic Acids Res 39: 8213–8222. 10.1093/nar/gkr500 - DOI - PMC - PubMed
    1. Barbato G, Ikura M, Kay LE, Pastor RW, Bax A. 1992. Backbone dynamics of calmodulin studied by nitrogen-15 relaxation using inverse detected two-dimensional NMR spectroscopy: the central helix is flexible. Biochemistry 31: 5269–5278. 10.1021/bi00138a005 - DOI - PubMed

Publication types