. 2019 Nov 8;294(45):16942-16952.
doi: 10.1074/jbc.RA119.009742. Epub 2019 Oct 3.

Binding-induced folding under unfolding conditions: Switching between induced fit and conformational selection mechanisms

Affiliations

Binding-induced folding under unfolding conditions: Switching between induced fit and conformational selection mechanisms

Sreemantee Sen et al. J Biol Chem. .

Abstract

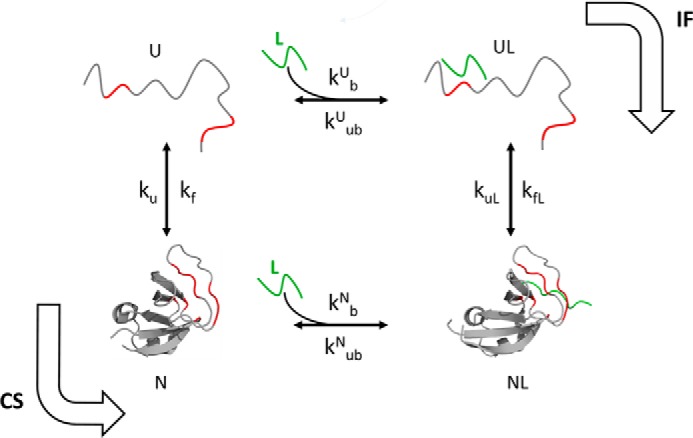
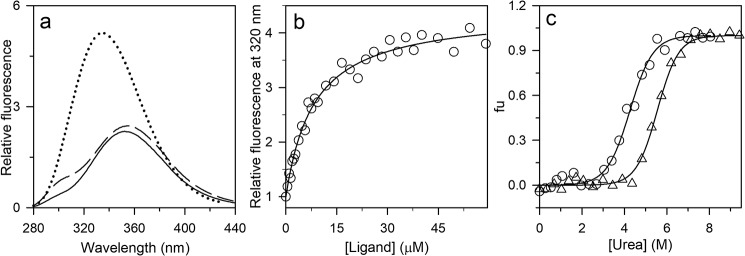
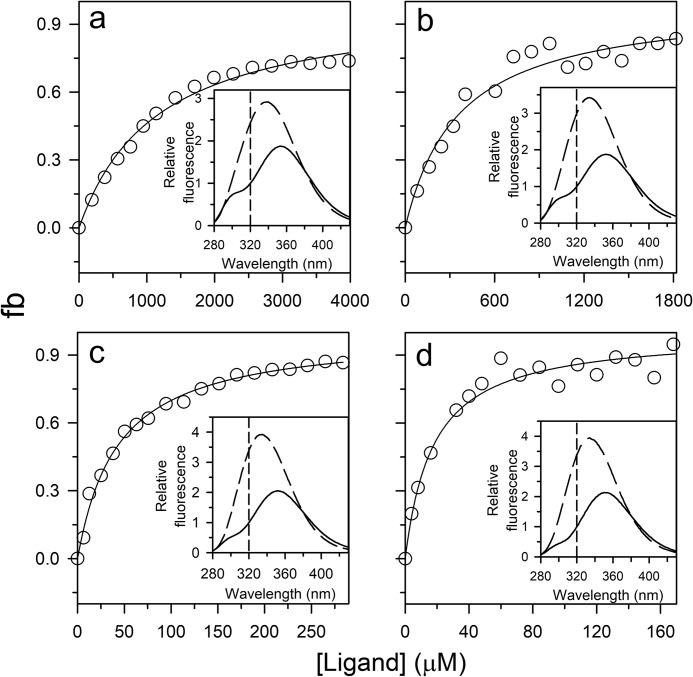
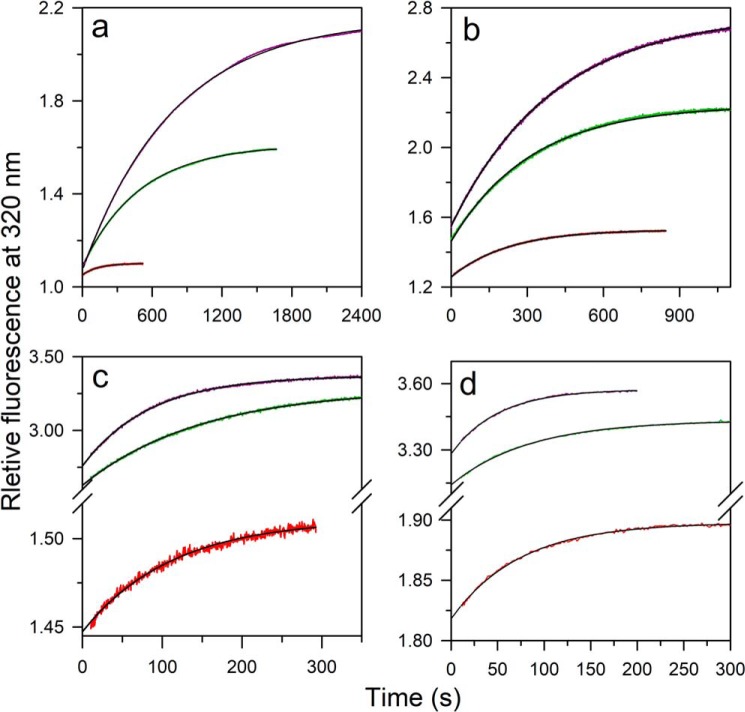
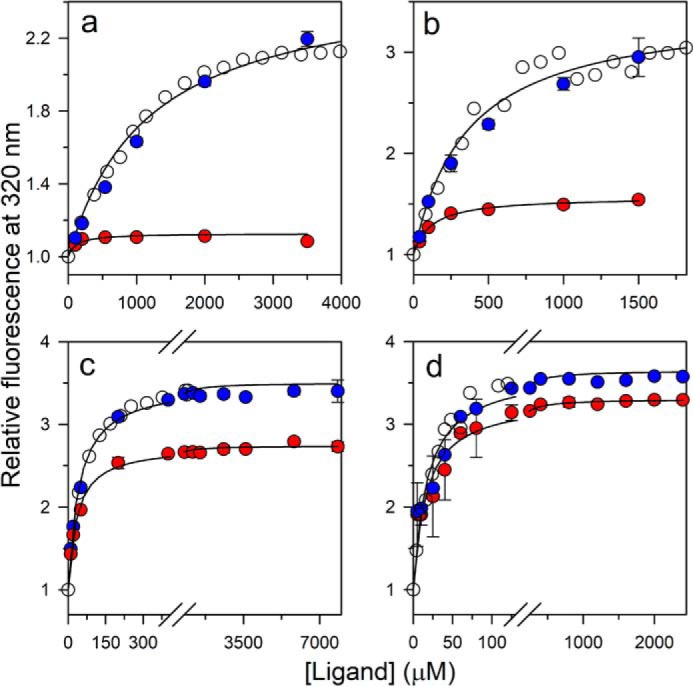
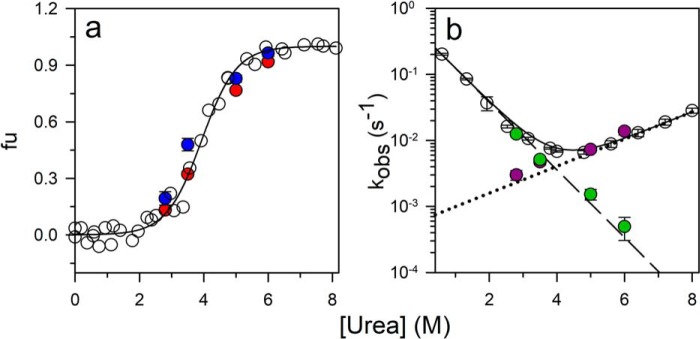
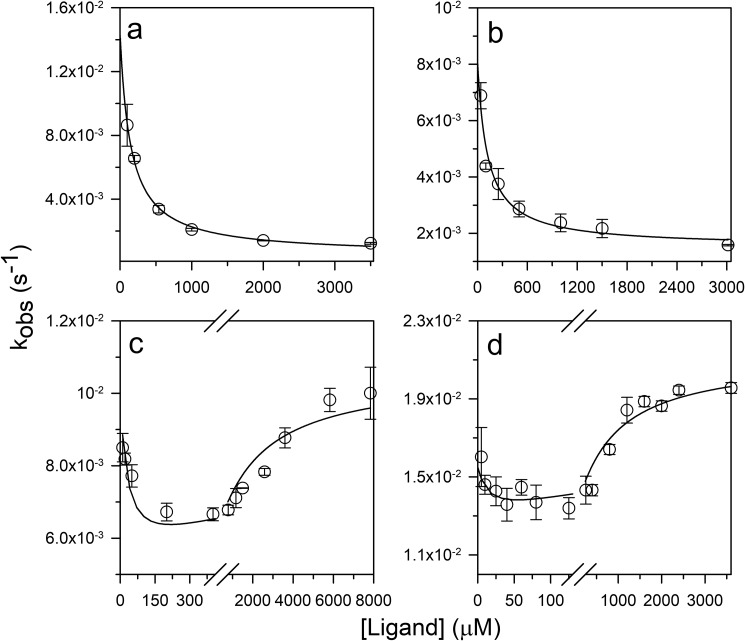
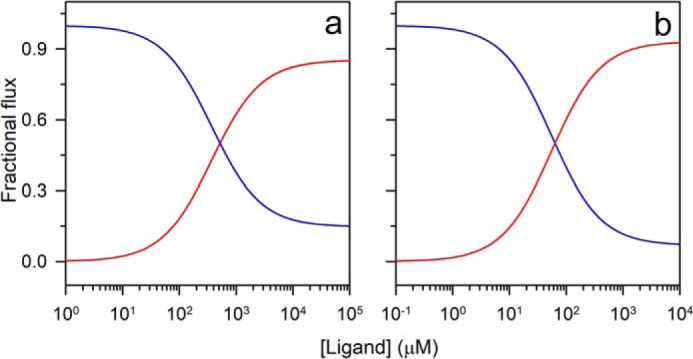
The chemistry of protein-ligand binding is the basis of virtually every biological process. Ligand binding can be essential for a protein to function in the cell by stabilizing or altering the conformation of a protein, particularly for partially or completely unstructured proteins. However, the mechanisms by which ligand binding impacts disordered proteins or influences the role of disorder in protein folding is not clear. To gain insight into this question, the mechanism of folding induced by the binding of a Pro-rich peptide ligand to the SH3 domain of phosphatidylinositol 3-kinase unfolded in the presence of urea has been studied using kinetic methods. Under strongly denaturing conditions, folding was found to follow a conformational selection (CS) mechanism. However, under mildly denaturing conditions, a ligand concentration-dependent switch in the mechanism was observed. The folding mechanism switched from being predominantly a CS mechanism at low ligand concentrations to being predominantly an induced fit (IF) mechanism at high ligand concentrations. The switch in the mechanism manifests itself as an increase in the reaction flux along the IF pathway at high ligand concentrations. The results indicate that, in the case of intrinsically disordered proteins too, the folding mechanism is determined by the concentration of the ligand that induces structure formation.

Keywords: Src homology 3 domain (SH3 domain); conformational selection; induced fit; intrinsically disordered protein; ligand-binding protein; peptides; protein folding; reaction flux.


Conflict of interest statement

The authors declare that they have no conflicts of interest with the contents of this article

Figures

Figure 1.
Figure 1.
Ligand binding coupled to the folding of the PI3K SH3 domain. The binding site in the protein is highlighted in red, and the ligand is shown in green. The Protein Data Bank (PDB) codes of the structures represented as N and NL are 3I5S and 3I5R, respectively.
Figure 2.
Figure 2.
Characterization of the PI3K SH3 domain in the absence and presence of the ligand. a, fluorescence emission spectra of N (solid black line), U (dashed black line), and ligand-bound N (dotted line) upon excitation at 268 nm. b, the binding curve was obtained by measuring the change in the intrinsic Trp fluorescence signal at 320 nm upon excitation at 268 nm. The data were obtained by equilibrating 0.3 μm protein with the indicated ligand concentrations. The raw data were normalized to values of 1 for the fluorescence signals of the completely unbound state of the protein. The solid line through the points is a fit to Equation 1. A value of 7 μm was obtained for KDN. c, equilibrium unfolding curves in the absence (○) and presence (▵) of the ligand (350 μm) were determined by monitoring the fluorescence at 300 and 320 nm, respectively, upon excitation at 268 nm. The data were converted to fraction unfolded (fu) values and plotted against the concentration of urea. The solid lines through the data are fits to a two-state model of unfolding.
Figure 3.
Figure 3.
Binding curves of the PI3K SH3 domain obtained at different concentrations of urea. The binding curves were obtained by measuring the change in the intrinsic Trp fluorescence signal at 320 nm upon excitation at 268 nm in 6 (a), 5 (b), 3.5 (c), and 2.8 m (d) urea. The data were obtained by equilibrating 1–5 μm protein with varying ligand concentrations. To determine the fraction of the protein bound to ligand (fb), the data were normalized to values of 0 and 1 for the fluorescence signal of the completely unbound state and completely bound state, respectively. The solid lines through the points are fits to Equation 2. For fitting, the value of KDN was fixed to the value obtained from the t = 0 points of ligand-induced folding traces, and the value of KU used at each urea concentration was first determined from the equilibrium unfolding curve obtained in the absence of any ligand. The inset in each panel shows the fluorescence spectra of the bound (dashed line) and unbound (solid line) states upon excitation at 268 nm. The vertical dashed lines indicate the wavelength at which the binding curve was acquired. The values of KDU obtained are listed in Table 1.
Figure 4.
Figure 4.
Kinetic traces of folding induced by the ligand at different urea concentrations. Ligand-induced folding in 6 (a), 5 (b), 3.5 (c), and 2.8 m (d) urea was monitored by measurement of the change in the intrinsic Trp fluorescence signal at 320 nm upon excitation at 268 nm. The protein at different concentrations of urea was diluted to different concentrations of ligand manually without changing the urea concentration. The concentrations of the peptide ligand were, from top to bottom, 3500, 1000, and 100 μm (a); 1500, 500, and 100 μm (b); 8700, 400, and 10 μm (c); 2400, 125, and 10 μm (d). Each trace was normalized to a value of 1 for the fluorescence signal of the protein in the absence of ligand. The reactions were carried out under pseudo-first-order conditions, and the solid lines through the data are fits to a single exponential equation.
Figure 5.
Figure 5.
Comparison of the kinetic amplitudes with the equilibrium amplitudes of folding in 6 (a), 5 (b), 3.5 (c), and 2.8 m urea (d). Open circles, equilibrium binding curve; red filled circles, the t = 0 points; and blue filled circles, the t = ∞ points of the kinetic traces of folding induced by ligand binding. For each urea concentration, the data have been normalized to a value of 1 for the protein fluorescence signal in the absence of ligand. The solid lines through the t = 0 points (red filled circles) are fits to Equation 1. The error bars, showing the spread in the data, were obtained from two or more independent experiments.
Figure 6.
Figure 6.
Dependence of the fraction unfolded protein and rate constants of folding and unfolding obtained from urea-induced folding and unfolding experiments and from ligand-induced folding experiments. a, the equilibrium unfolding curve was measured by monitoring the fluorescence at 300 nm upon excitation at 268 nm. The data were converted to fraction unfolded (fu) values and plotted versus urea concentration (open circles). The solid line through the data are a fit to a two-state model of unfolding. Fraction unfolded was also calculated both from the burst phase amplitude (red filled circles) and from the folding and unfolding rate constants (blue filled circles) determined from kinetic analysis of the ligand-induced folding reactions. b, observed rate constants of folding and unfolding (open circles) obtained from urea-jump experiments. The solid line through the data points is a fit to Equation 11. The folding (purple filled circles) and unfolding (green filled circles) rate constants were obtained from ligand-induced folding experiments. The error bars showing the spread in the data, were obtained from two or more independent experiments.
Figure 7.
Figure 7.
Dependence of the observed rate constants of ligand-induced folding on ligand concentration. Dependence of the observed rate constants of ligand-induced folding were determined in 6 (a), 5 (b), 3.5 (c), and 2.8 m (d) urea. The solid lines through the data in a and b are fits to Equation 3, and the solid lines through the data in c and d are fits to Equation 4. The values of KDN were fixed to the values obtained from the t = 0 points of ligand-induced folding traces, and the values of KDU were fixed to the values obtained from equilibrium binding curves. The parameters obtained from fitting the data are listed in Table 1. The error bars, showing the spread in the data, were obtained from two or more independent experiments.
Figure 8.
Figure 8.
Dependence of fractional flux along CS and IF pathways of ligand concentration. The reaction flux along the CS (blue) and the IF (red) pathways at 3.5 (a) and 2.8 m (b) urea was calculated by using the values of the parameters obtained from the ligand-induced folding reaction in Equations 7 and 10. The reaction flux along each pathway was then converted to fractional flux values.

References

    1. Wright P. E., and Dyson H. J. (1999) Intrinsically unstructured proteins: re-assessing the protein structure-function paradigm. J. Mol. Biol. 293, 321–331 10.1006/jmbi.1999.3110 - DOI - PubMed
    1. Ward J. J., Sodhi J. S., McGuffin L. J., Buxton B. F., and Jones D. T. (2004) Prediction and functional analysis of native disorder in proteins from the three kingdoms of life. J. Mol. Biol. 337, 635–645 10.1016/j.jmb.2004.02.002 - DOI - PubMed
    1. Koshland D. E. Jr., Némethy G., and Filmer D. (1966) Comparison of experimental binding data and theoretical models in proteins containing subunits. Biochemistry 5, 365–385 10.1021/bi00865a047 - DOI - PubMed
    1. Monod J., Wyman J., and Changeux J.-P. (1965) On the nature of allosteric transitions: a plausible model. J. Mol. Biol. 12, 88–118 10.1016/S0022-2836(65)80285-6 - DOI - PubMed
    1. Ivarsson Y., Travaglini-Allocatelli C., Jemth P., Malatesta F., Brunori M., and Gianni S. (2007) An on-pathway intermediate in the folding of a PDZ domain. J. Biol. Chem. 282, 8568–8572 10.1074/jbc.M611026200 - DOI - PubMed

Publication types

MeSH terms

LinkOut - more resources