. 2019 Oct 3;10(1):4486.
doi: 10.1038/s41467-019-12211-8.

The genome-wide multi-layered architecture of chromosome pairing in early Drosophila embryos

Affiliations

The genome-wide multi-layered architecture of chromosome pairing in early Drosophila embryos

Jelena Erceg et al. Nat Commun. .

Abstract

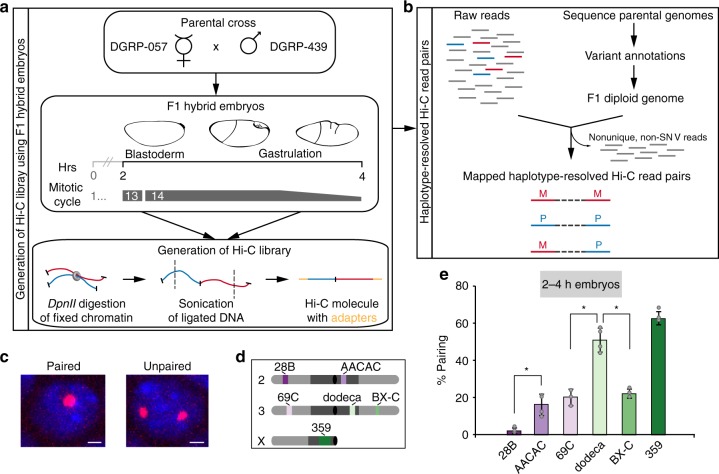
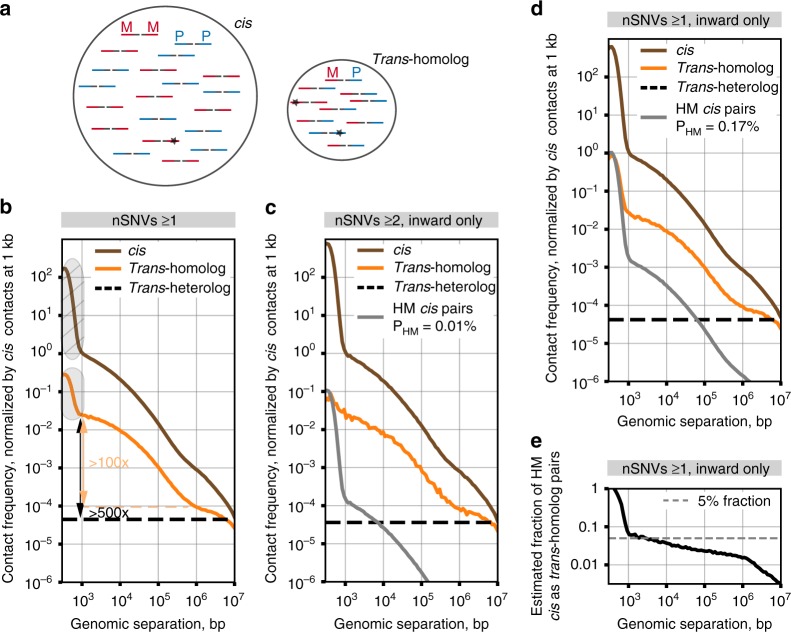
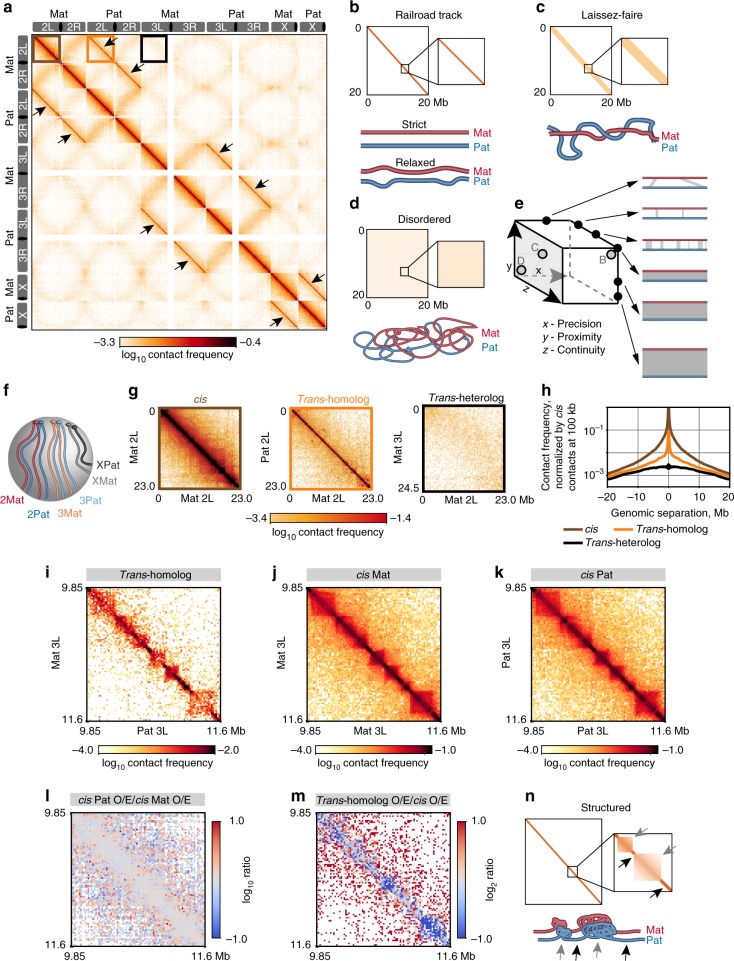
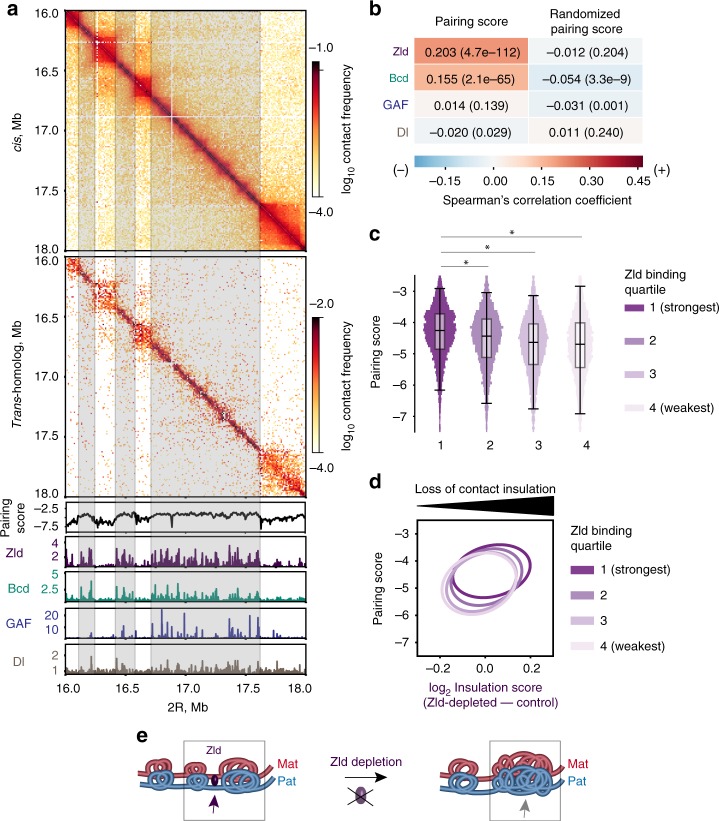
Genome organization involves cis and trans chromosomal interactions, both implicated in gene regulation, development, and disease. Here, we focus on trans interactions in Drosophila, where homologous chromosomes are paired in somatic cells from embryogenesis through adulthood. We first address long-standing questions regarding the structure of embryonic homolog pairing and, to this end, develop a haplotype-resolved Hi-C approach to minimize homolog misassignment and thus robustly distinguish trans-homolog from cis contacts. This computational approach, which we call Ohm, reveals pairing to be surprisingly structured genome-wide, with trans-homolog domains, compartments, and interaction peaks, many coinciding with analogous cis features. We also find a significant genome-wide correlation between pairing, transcription during zygotic genome activation, and binding of the pioneer factor Zelda. Our findings reveal a complex, highly structured organization underlying homolog pairing, first discovered a century ago in Drosophila. Finally, we demonstrate the versatility of our haplotype-resolved approach by applying it to mammalian embryos.


Conflict of interest statement

The authors declare no competing interests.

Figures

Fig. 1
Fig. 1
Haplotype-resolved Hi-C to characterize embryonic homolog pairing. a Generation of Hi-C libraries using 2–4 h hybrid embryos and b haplotype-resolved mapping. c Homolog pairing as assessed by FISH. Nuclei are considered paired nuclei when FISH signals are ≤0.8 μm (center-to-center distance) apart. Bar = 1 μm. d Location of FISH targets (heterochromatin, dark gray; euchromatin, light gray; centromere, black circle). e Percentage of nuclei showing paired loci in 2–4 h embryos (error bars, standard deviation of at least three replicates; n ≥ 100 nuclei/replicate; *P < 0.0001, Fisher’s two-tailed exact). Source data are provided as a Source Data file
Fig. 2
Fig. 2
Strategy for robust distinction of trans-homolog from cis contacts. a Homolog misassignment can arise from sequencing errors, false SNVs, or sample heterogeneity (lines, Hi-C molecules; red, maternal fragment (M); blue, paternal fragment (P); stars, errors). b Contact frequency plotted against genome separation using ≥ 1 SNV per read. Arrows, change in contact frequency between short-range trans-homolog contacts and either long-range (>1 Mb) trans-homolog (orange) or trans-heterolog (black) contacts. Shaded area over the trans-homolog curve, enrichment of contact frequency due to homolog-misassigned “dangling ends” (shaded area over cis curve). c Contact frequency for inward only read pairs with at least two SNVs per read, with no sequence mismatches allowed (PHM = 0.01%). d Contact frequency for inward only read pairs with at least one SNV per read (PHM = 0.17%). e Fraction of homolog-misassigned cis contacts among trans-homolog pairs as a function of genomic separation. bd Contact frequencies for chromosomes 2 and 3 normalized by cis contact frequency at 1 kb. Dashed black line, average trans-heterolog contact frequency; HM, homolog misassignment; PHm, probability of homolog misassignment
Fig. 3
Fig. 3
Highly structured homolog pairing resembles features of cis-organization. a Haplotype-resolved Hi-C map of F1 hybrid embryos. Arrows, trans-homolog diagonals. bd Homologs juxtaposed in a b railroad track fashion, c a loose, laissez-faire mode, or d a highly disordered structure. e Homolog pairing may encompass a range of structures defined by precision, proximity, and continuity. f Rabl positioning of chromosomes. The g zoomed-in maps of chromosomal arms (color coded boxes in a; L, left; R, right) and h respective contact frequencies as a function of genomic distance (see Methods). i trans-homolog, j cis maternal, and k cis paternal maps of matching regions on chr3L. l Ratio of cis Pat/cis Mat Hi-C maps indicates the cis contact patterns of two homologs are highly consistent. m The ratio of trans-homolog/average cis maps suggests that pairing resembles cis contacts, albeit with lower interactions in some regions (dark blue). n Homolog pairing displays highly structured trans-domains (black) and trans-boundaries (gray), reflecting cis-organization of homologs
Fig. 4
Fig. 4
Homolog pairing is related to Zld-mediated opening of chromatin. a Cis (upper panel) and trans-homolog (second panel from the top) contact maps of a 2 Mb region (2 R:16-18 Mb). Lower panels, pairing score (PS) calculated using a 28 kb window at 4 kb resolution (black), ChIP-seq profiles of Zld (dark purple), Bcd (green), GAF (blue), and Dl (brown). Gray boxes, regions associated with elevated PS values in boundaries. b Correlation analyses between the PS values and the binding profiles of Zld, Bcd, GAF, and Dl as determined using pairwise Spearman correlation. Control, randomized 200 kb chunks of the PS. Spearman correlation coefficients indicated in each box and by a heatmap; P-values in parentheses. c 25% of the strongest Zld binding coincides significantly with high PS regions, compared to the remaining Zld binding (*P < 10−10, Mood’s median test). d PS values vs loss of contact insulation upon Zld depletion, grouped by Zld binding strength quartile. Ovals represent the contours of 2D-Gaussian approximations, at a distance of 2 standard deviations from the mean (the dot). Regions with stronger Zld binding show both high PS values and increased loss of contact insulation upon Zld depletion. e Zld depletion affects insulation of domain boundaries at regions otherwise associated with high pairing. Thus, Zld may affect homologs to be further away from each other when insulation is lost

References

    1. Apte MS, Meller VH. Homologue pairing in flies and mammals: gene regulation when two are involved. Genet. Res. Int. 2012;2012:430587. - PMC - PubMed
    1. Joyce EF, Erceg J, Wu CT. Pairing and anti-pairing: a balancing act in the diploid genome. Curr. Opin. Genet. Dev. 2016;37:119–128. doi: 10.1016/j.gde.2016.03.002. - DOI - PMC - PubMed
    1. Fukaya T, Levine M. Transvection. Curr. Biol. 2017;27:R1047–R1049. doi: 10.1016/j.cub.2017.08.001. - DOI - PMC - PubMed
    1. Cattoni DI, et al. Single-cell absolute contact probability detection reveals chromosomes are organized by multiple low-frequency yet specific interactions. Nat. Commun. 2017;8:1753. doi: 10.1038/s41467-017-01962-x. - DOI - PMC - PubMed
    1. Szabo Q, et al. TADs are 3D structural units of higher-order chromosome organization in Drosophila. Sci. Adv. 2018;4:eaar8082. doi: 10.1126/sciadv.aar8082. - DOI - PMC - PubMed

Publication types

MeSH terms