. 2019 Oct 3;10(1):4496.
doi: 10.1038/s41467-019-12505-x.

Gingival solitary chemosensory cells are immune sentinels for periodontitis

Affiliations

Gingival solitary chemosensory cells are immune sentinels for periodontitis

Xin Zheng et al. Nat Commun. .

Abstract

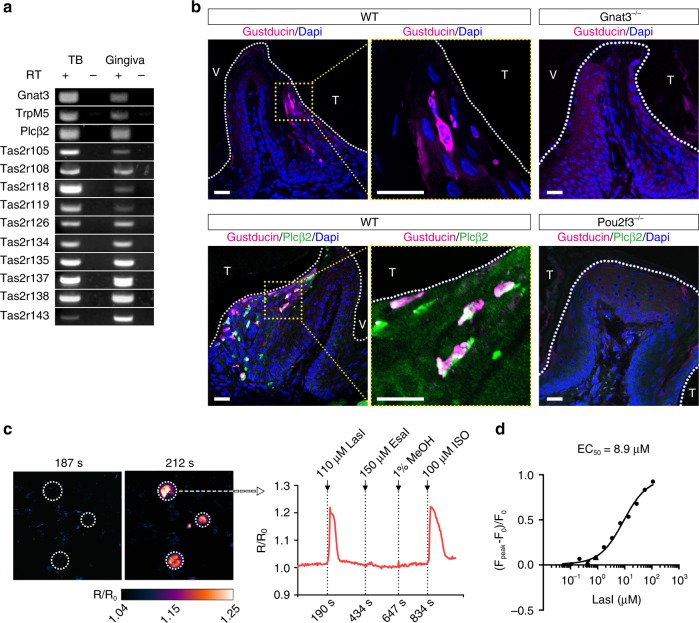
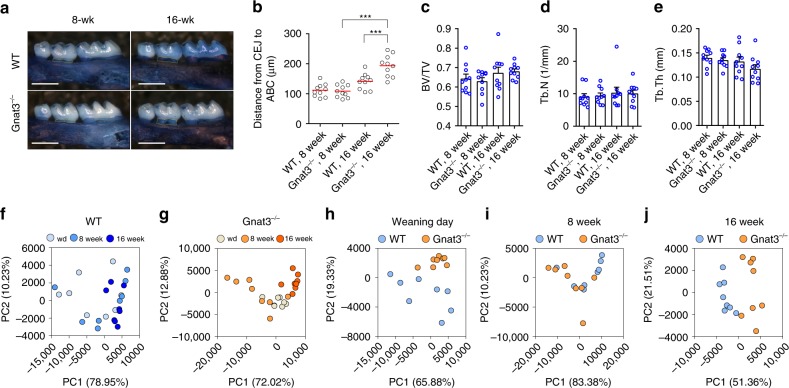
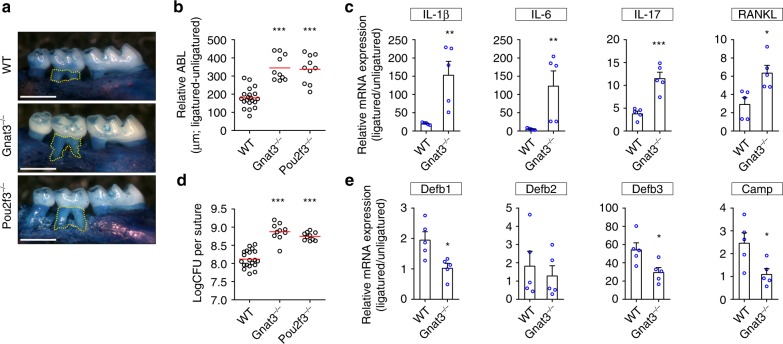
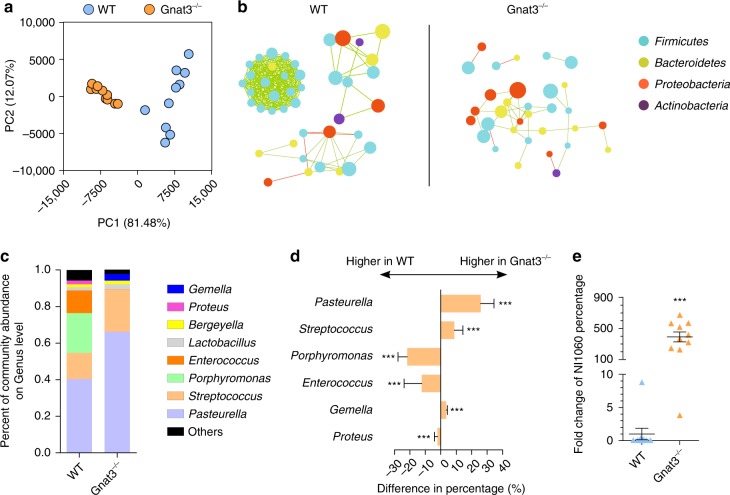
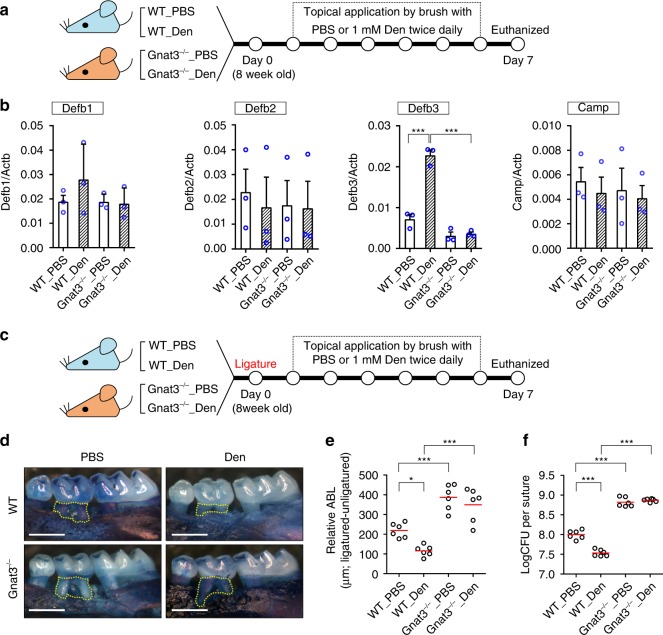
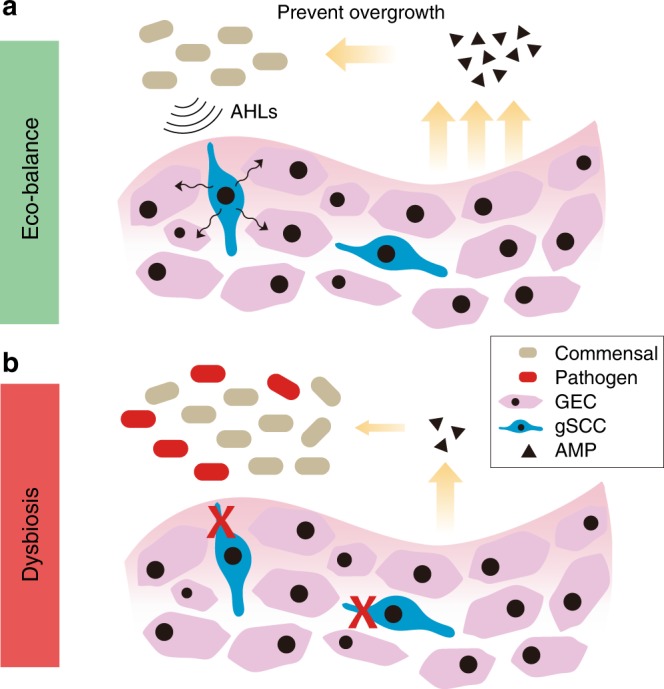
Solitary chemosensory cells (SCCs) are epithelial sentinels that utilize bitter Tas2r receptors and coupled taste transduction elements to detect pathogenic bacterial metabolites, triggering host defenses to control the infection. Here we report that SCCs are present in mouse gingival junctional epithelium, where they express several Tas2rs and the taste signaling components α-gustducin (Gnat3), TrpM5, and Plcβ2. Gnat3-/- mice have altered commensal oral microbiota and accelerated naturally occurring alveolar bone loss. In ligature-induced periodontitis, knockout of taste signaling molecules or genetic absence of gingival SCCs (gSCCs) increases the bacterial load, reduces bacterial diversity, and renders the microbiota more pathogenic, leading to greater alveolar bone loss. Topical treatment with bitter denatonium to activate gSCCs upregulates the expression of antimicrobial peptides and ameliorates ligature-induced periodontitis in wild-type but not in Gnat3-/- mice. We conclude that gSCCs may provide a promising target for treating periodontitis by harnessing innate immunity to regulate the oral microbiome.


Conflict of interest statement

The authors declare no competing interests.

Figures

Fig. 1
Fig. 1
Solitary chemosensory cells in gingival epithelium. a Expression in gingiva of mRNAs for taste transduction elements examined by RT-PCR. TB taste buds, RT +/− with/without reverse transcription. Uncropped scans of the gel are provided in the Source Data file. b Expression in gingiva of gustducin (Gnat3) and phospholipase Cβ2 (Plcβ2) in wild-type (WT), Gnat3−/−, and Pou2f3−/− mice. Nuclei stained by DAPI are blue. White dotted lines show tooth margins. T tooth facing side, V vestibular groove facing side. Yellow dotted lines indicate the fields with magnified views. Scale bars: 150 μm. c Responses of HEK293 cells transfected with Tas2r105 and chimeric reporter G protein (Gα16Gust44) to topically administered stimuli. The pseudocolor map represents calcium changes (R/R0) measured by fluorescence intensity. LasI bacterially produced 3-oxo-C12-homoserine lactone (HSL), EsaI bacterially produced 3-oxo-C6-HSL, MeOH methanol vehicle control, ISO isoproterenol positive control. d Dose-dependent calcium responses to LasI of HEK293 cells transfected with Tas2r105 and Gα16Gust44. Source data are provided as a Source Data file
Fig. 2
Fig. 2
Accelerated naturally occurring alveolar bone loss and distinct commensal oral microbiota in Gnat3−/− mice. a Defleshed maxillae stained with methylene blue from wild-type (WT) and Gnat3−/− mice at 8 or 16 weeks of age. Yellow dotted line indicates the area between the cementoenamel junction (CEJ) of the second maxillary molar and the alveolar bone crest (ABC). Scale bars: 500 μm. b Quantitation of the distance from the CEJ of the second maxillary molar to the ABC. The result for each mouse is plotted; the red line indicates the mean (n = 10 mice). ***p < 0.001, one-way ANOVA test followed by Tukey’s test. ce MicroCT analysis of alveolar bone (n = 10 mice). BV/TV bone volume/tissue volume, Tb.N trabecular number, Tb.Th trabecular thickness. fj Principal component analysis (PCA) of microbiota recovered from oral swabs collected from WT and Gnat3−/− mice at three time points: weaning day (wd) and 8 and 16 weeks of age. Each circle represents an individual oral swab sample (n = 8 mice), color coded by age (f, g) or genotype (hj). Error bars in ce represent the SEM. Source data are provided as a Source Data file
Fig. 3
Fig. 3
Ligature-induced periodontitis is more severe in mice lacking SCC signaling elements. a Ligatured maxillae from WT and knockout mice. Yellow dotted line indicates the area between the cementoenamel junction of the second maxillary molar and the alveolar bone crest. Scale bars: 500 μm. b Quantitation of relative alveolar bone loss (ABL) calculated by subtracting the ABL of the unligatured side from the ABL of the ligatured side. Results for each mouse are plotted; the red line indicates the mean (n = 10 for each knockout mouse and n = 20 WT mice). ***p < 0.001, one-way ANOVA test followed by Tukey’s test. c Expression of pro-inflammatory cytokine mRNAs determined by qPCR. Results are normalized against β-actin mRNA expression and are represented as the fold change in transcript levels in ligatured sites relative to those of the corresponding contralateral unligatured sites, which are assigned a value of 1 (n = 5 independent experiments). IL-1β, -6, -17 interleukin-1β, -6, -17, respectively, RANKL receptor activator of nuclear factor kappa-B ligand. **p < 0.01, ***p < 0.001, Student’s t test. d qPCR quantitation of bacteria colonized on the ligatures recovered 1 week after placement. Result of each mouse is plotted; the red line indicates the mean (n = 10 knockout mice and n = 30 WT mice). CFU colony-forming unit. ***p < 0.001, one-way ANOVA test followed by Tukey’s test. e Expression levels of antimicrobial peptides determined by qPCR (n = 5 independent experiments). Defb1–3 β-defensin 1–3, respectively, Camp cathelicidin antimicrobial peptide LL-37. *p < 0.05, Student’s t test. Error bars in c and e represent the SEM. Source data are provided as a Source Data file
Fig. 4
Fig. 4
Gnat3−/− mice develop distinct oral microbiota. a Principal component analysis (PCA) of microbiota recovered from ligatures around molars of WT and Gnat3−/− mice (n = 10 mice). Each circle represents an individual ligature sample, colored by genotype. b Operational taxonomic unit (OTU)-level correlation network analysis of ligature microbiota from WT and Gnat3−/− mice (n = 10 mice). The most abundant 50 OTUs from each genotype were analyzed. Each circle represents one OTU, colored by phylum. The size of a circle indicates the abundance of the OTU. Green lines indicate positive correlations between two OTUs; red lines indicate negative correlations. c Average genus-level composition of ligature microbiota from WT and Gnat3−/− mice (n = 10 mice). d Prevalent genus with significant difference in abundance between WT and Gnat3−/− mice (n = 10 mice, means ± 95% confidence interval). ***p < 0.01, Wilcoxon rank-sum test. e qPCR quantification of NI1060, a ligature-induced periodontitis-related pathogen. Result of each ligature sample is plotted, with black line indicating means ± SEM (n = 10 mice). ***p < 0.01, Wilcoxon rank-sum test. Source data are provided as a Source Data file
Fig. 5
Fig. 5
Activation of gSCCs stimulated expression of beta-defensin and alleviated periodontitis in wild-type mice. a Molars of WT and Gnat3−/− mice were topically treated with 1 mM denatonium benzoate (Den) or PBS for 6 days and then mice euthanized at day 7. Gingival tissues were collected for RNA isolation and qRT-PCR. b Gingival expression of antimicrobial peptide mRNAs determined by qRT-PCR. Results are normalized against β-actin mRNA (Actb). Data are means ± SEM (n = 3 mice). Defb1–3 β-defensin 1–3, respectively, Camp LL-37. ***p < 0.001, one-way ANOVA test followed by Tukey’s test. c At day 0, silk ligatures were placed around the second maxillary left molars of WT and Gnat3−/− mice. The mice were treated with 1 mM Den or PBS from day 1 to day 6 and sacrificed on day 7. d Maxillae from ligatured WT and Gnat3−/− mice treated with PBS or Den. Yellow dotted line indicates the area between the cementoenamel junction of the second maxillary molar to the alveolar bone crest. Scale bars: 500 μm. e Quantitation of relative ABL calculated by subtracting the ABL of the unligatured side from the ABL of the ligatured side. Result of each mouse is plotted; the red line indicates the mean (n = 6 mice). *p < 0.05; ***p < 0.001; one-way ANOVA test followed by Tukey’s test. f Quantitation by qPCR of the bacteria colonized on the ligatures recovered 1 week after placement. Result of each mouse is plotted, with the red line indicating the mean (n = 6 mice). ***p < 0.001, one-way ANOVA test followed by Tukey’s test. Source data are provided as a Source Data file
Fig. 6
Fig. 6
Potential roles of gingival SCCs in oral microbiome regulation. a Taste-like gSCCs in mouse gingival tissue may detect bacterial signals (e.g., acylated homoserine lactones (AHLs)) via bitter taste receptors (Tas2rs), thus triggering host innate immune responses (e.g., antimicrobial peptide (AMP) secretion) to prevent the overgrowth of oral bacteria and also regulate the microbial composition. b The dysfunction of gSCCs may cause insufficient AMP secretion, rendering a dysbiotic microbiota characterized with increased bacterial load, diminished diversity, and increased levels of pathogens (e.g. NI1060). GEC gingival epithelial cells

References

    1. Darveau RP. Periodontitis: a polymicrobial disruption of host homeostasis. Nat. Rev. Microbiol. 2010;8:481–490. doi: 10.1038/nrmicro2337. - DOI - PubMed
    1. Kassebaum NJ, et al. Global burden of severe periodontitis in 1990-2010: a systematic review and meta-regression. J. Dent. Res. 2014;93:1045–1053. doi: 10.1177/0022034514552491. - DOI - PMC - PubMed
    1. Lamont RJ, Hajishengallis G. Polymicrobial synergy and dysbiosis in inflammatory disease. Trends Mol. Med. 2015;21:172–183. doi: 10.1016/j.molmed.2014.11.004. - DOI - PMC - PubMed
    1. Abusleme L, et al. The subgingival microbiome in health and periodontitis and its relationship with community biomass and inflammation. ISME J. 2013;7:1016–1025. doi: 10.1038/ismej.2012.174. - DOI - PMC - PubMed
    1. Ai D, et al. Integrated metagenomic data analysis demonstrates that a loss of diversity in oral microbiota is associated with periodontitis. BMC Genomics. 2017;18:1041. doi: 10.1186/s12864-016-3254-5. - DOI - PMC - PubMed

Publication types

MeSH terms

LinkOut - more resources