. 2019 Oct 3;10(1):4494.
doi: 10.1038/s41467-019-12546-2.

East Greenland ice core dust record reveals timing of Greenland ice sheet advance and retreat

Affiliations

East Greenland ice core dust record reveals timing of Greenland ice sheet advance and retreat

Marius Folden Simonsen et al. Nat Commun. .

Abstract

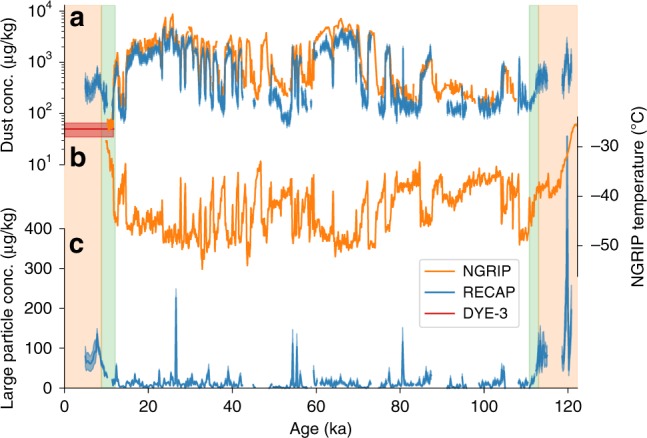
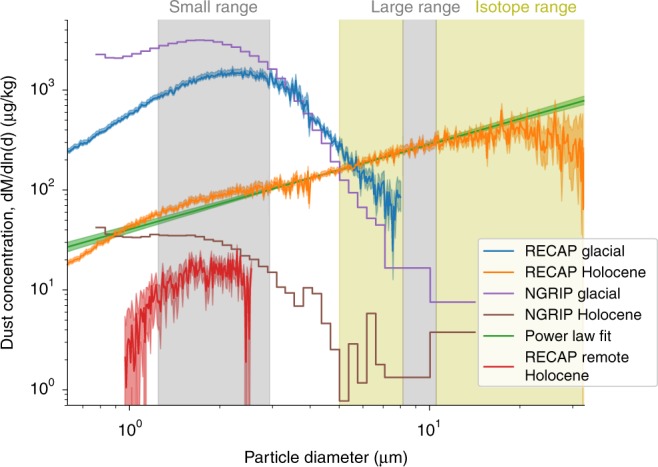
Accurate estimates of the past extent of the Greenland ice sheet provide critical constraints for ice sheet models used to determine Greenland's response to climate forcing and contribution to global sea level. Here we use a continuous ice core dust record from the Renland ice cap on the east coast of Greenland to constrain the timing of changes to the ice sheet margin and relative sea level over the last glacial cycle. During the Holocene and the previous interglacial period (Eemian) the dust record was dominated by coarse particles consistent with rock samples from central East Greenland. From the coarse particle concentration record we infer the East Greenland ice sheet margin advanced from 113.4 ± 0.4 to 111.0 ± 0.4 ka BP during the glacial onset and retreated from 12.1 ± 0.1 to 9.0 ± 0.1 ka BP during the last deglaciation. These findings constrain the possible response of the Greenland ice sheet to climate forcings.


Conflict of interest statement

The authors declare no competing interests.

Figures

Fig. 1
Fig. 1
Dust and temperature records from Greenland ice cores. a The total concentration of dust particles in the size range 1.25–10.5 μm in the RECAP and NGRIP ice cores over a full glacial cycle on 50 year resolution. For DYE-3 the plot shows the average Holocene value. The coloured shadings around the curves are 1σ errors. b NGRIP temperature reconstructed from atmospheric nitrogen isotope ratios. c The large (8.13–10.5 μm) particle concentration in the RECAP ice core on 200 year resolution. The background colours indicate periods of high (orange) and low (white) large particle concentrations and the transition between the two states (green), determined by a piecewise continuous rampfit function
Fig. 2
Fig. 2
Dust size distributions in RECAP and NGRIP ice cores. RECAP dust size distributions were measured by Coulter Counter. The glacial data cover the time period (12,800–33,900) ± 500 years b2k, while the Holocene covers selected samples from the period (356 ± 2 − 4010 ± 50) years b2k. A power law is fitted to the Holocene data from 4 to 6 μm and extrapolated to 0.9 μm, with the residual Holocene dust relative to the power law fit shown in red. It is interpreted as the size distribution of the RECAP remote Holocene dust. The coloured shadings around the curves are 1σ errors. The grey bars show the size ranges assigned to represent small and large particles in the RECAP dust time series. The yellow area shows the size range of particles sampled for Sr and Nd isotope measurements
Fig. 3
Fig. 3
Sr/Nd isotopic signatures of dust in Greenland ice cores and potential dust source regions. a Strontium and neodymium isotope ratios from RECAP (blue circles) compared to possible dust source regions in Greenland (Scoresby Sund and Kong Christian X Land, this study), Iceland and Asia; and ice core samples from Renland (red circle), Hans Tausen (green circle) and central Greenland (DYE-3, NGRIP, GRIP, Site A, empty circles). Errors are 2σ, but smaller than the data markers. The RECAP samples each cover approximately 1 ka. The Hans Tausen sample is from approximately 1000 CE while all other Greenland samples are from the 17th-18th century. The Renland ice core (red circle) was drilled in 1988 at a location less than 2 km from the RECAP ice core (blue circles). b Copernicus Atmosphere Monitoring Service reanalysis map of total aerosol optical depth from April 27 2016 indicating dust deflation zones along central East Greenland. The coloured circles indicate ice core drill sites; from north to south: Hans Tausen, NGRIP, GRIP, RECAP, Site A and DYE-3. The white box shows the area in subplot c including the RECAP ice core location (blue circle). Generated using Copernicus Atmosphere Monitoring Service information [2018]. Neither the European Commission nor ECMWF is responsible for any use that may be made of the Copernicus Information or Data it contains. c Locations of potential dust sources (triangles, square, diamond) proximal to RECAP ice core drilling site (blue circle). Google Earth map data: IBCAO US Geological Survey
Fig. 4
Fig. 4
Glacial-interglacial transitions in RECAP dust. The small (1.25–2.9 μm) (a) and large (8.13–10.5 μm) (b) particle concentration and the ratio (c) between the large and small particle concentrations found in RECAP ice core are shown. 200 year means are shown for dust particle sizes measured by an Abakus laser particle sensor from Klotz GmbH, Germany (blue) together with 55 cm Coulter Counter samples (orange) and a piecewise continuous rampfit function applied to the Abakus data (red). The blue shadings around the curves are 1σ errors. d NGRIP temperature (orange), relative sea level in Scoresby Sund (red) and probability density function (PDF) of deglacial 10Be ages for the Scoresby Sund region (green). The deglacial 10Be PDF shows the number of rock exposure timing measurements in the Scoresby Sund region through the glacial termination

References

    1. Funder, S., Kjeldsen, K. K., Kjær, K. H. & Ó Cofaigh, C. in Developments in Quaternary Sciences Vol. 15 (eds. Jürgen Ehlers, Philip L. Gibbard, & Philip D. Hughes) Ch. 50, 699-713 (Elsevier, 2011).
    1. Alley RB, et al. History of the Greenland Ice Sheet: paleoclimatic insights. Quat. Sci. Rev. 2010;29:1728–1756. doi: 10.1016/j.quascirev.2010.02.007. - DOI
    1. Kelly MA, Lowell TV. Fluctuations of local glaciers in Greenland during latest Pleistocene and Holocene time. Quat. Sci. Rev. 2009;28:2088–2106. doi: 10.1016/j.quascirev.2008.12.008. - DOI
    1. Funder S, et al. History of a stable ice margin—East Greenland during the middle and upper Pleistocene. Quat. Sci. Rev. 1998;17:77–123. doi: 10.1016/S0277-3791(97)00082-6. - DOI
    1. Sugden DE, McCulloch RD, Bory AJ-M, Hein AS. Influence of Patagonian glaciers on Antarctic dust deposition during the last glacial period. Nat. Geosci. 2009;2:281–285. doi: 10.1038/ngeo474. - DOI

Publication types