. 2019 Oct 3;10(1):4485.
doi: 10.1038/s41467-019-12208-3.

Highly structured homolog pairing reflects functional organization of the Drosophila genome

Affiliations

Highly structured homolog pairing reflects functional organization of the Drosophila genome

Jumana AlHaj Abed et al. Nat Commun. .

Abstract

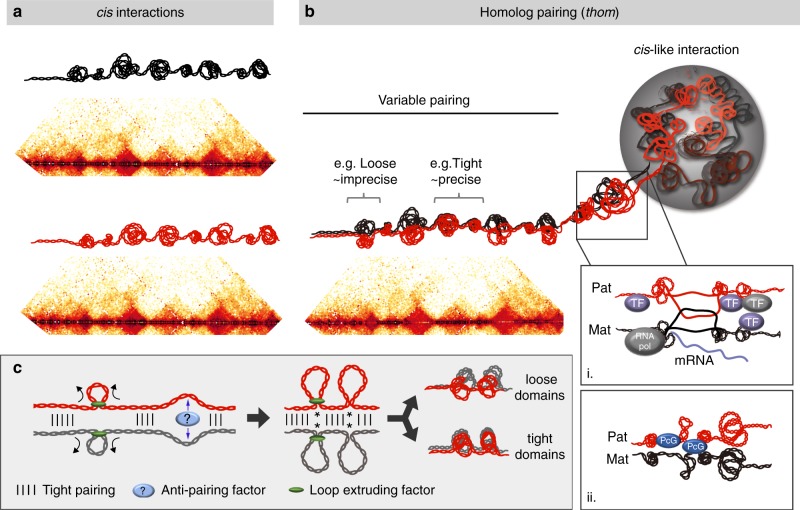
Trans-homolog interactions have been studied extensively in Drosophila, where homologs are paired in somatic cells and transvection is prevalent. Nevertheless, the detailed structure of pairing and its functional impact have not been thoroughly investigated. Accordingly, we generated a diploid cell line from divergent parents and applied haplotype-resolved Hi-C, showing that homologs pair with varying precision genome-wide, in addition to establishing trans-homolog domains and compartments. We also elucidate the structure of pairing with unprecedented detail, observing significant variation across the genome and revealing at least two forms of pairing: tight pairing, spanning contiguous small domains, and loose pairing, consisting of single larger domains. Strikingly, active genomic regions (A-type compartments, active chromatin, expressed genes) correlated with tight pairing, suggesting that pairing has a functional implication genome-wide. Finally, using RNAi and haplotype-resolved Hi-C, we show that disruption of pairing-promoting factors results in global changes in pairing, including the disruption of some interaction peaks.


Conflict of interest statement

The authors declare no competing interests.

Figures

Fig. 1
Fig. 1
PnM cell line characterization. a Generation of the cell line. b Karyotyping demonstrates PnM cells to be male and diploid (N = 50). c Homolog-specific probes (HOPs) distinguishing 057-derived (magenta) from 439-drived (green) homologs for chromosomes (Chr) 2 and 3 on metaphase spreads for PnM and control (non-hybrid) clone8 cells confirmed PnM to be hybrid. Scale bar = 5 μm. d Left: Locations of heterochromatic (light blue) and euchromatic (dark blue) chromosomal regions targeted by FISH. Oval, centromere. Right: Levels of pairing in PnM cells quantified as percent of nuclei in which FISH signals, representing allelic regions, co-localized (center-to-center distance between signals ≤ 0.8 μm; error bars, s.d. for two biological replicates; N > 100 nuclei/replicate). Source data are provided as a Source Data file
Fig. 2
Fig. 2
Homolog pairing is highly structured, encompassing tightly and loosely paired regions. a Contact map for the left (L) and right (R) arms of chromosomes 2 and 3. b, i. Top, cis and thom contact frequencies, P(s), plotted against genomic separation, s, normalized to cis frequency at s = 1 kb. Dotted line: thom contacts at s = 1 were as frequent as cis at s = 8 kb. Bottom, Pthom(s)/Pcis(s). Cis and thom contact frequencies differed noticeably at s < ~100 kb and were concordant at s > ~100 kb (shaded). b, ii–iii. Dashed lines, Pthom(s) as a function of s = |i1-j2| for loci i1 and j2 located on different homologs, compared to Pcis(s) for loci i1 and j1 separated by s = |i1-j1| on one homolog. Left, P(s) at s < ~100 kb. Right, P(s) at s > ~100 kb, shaded. c 1.5 Mb region on 2 L: Cis contact maps were concordant with each other and with the thom contact map. Bottom, thom/cis map showed concordance of thom with cis maps, apart from a depletion of contacts in some domains (blue). d Overlap of domain boundaries as defined by cis and thom contacts. e 4 Mb region of 2 L: Top, thom domains, and insulating boundaries. Bottom, pairing score (PS, green) and cis score (CS, gray). f Examples of tight and loose pairing with schematics of possible structures. g Distributions of PS and CS near (<4 kb, grey), or far from (>28 kb, orange) boundaries revealed higher pairing near boundaries. h Top, cis and thom contact frequencies, P(s), plotted against genomic separation, s, within tightly and loosely paired regions (normalized as in Fig. 2b). Middle, Pthom(s)/Pcis(s); bottom, slopes. Tightly paired regions showed two modes of decay, shallow (dark blue box) and steep (light blue box), while loosely paired regions showed one shallow mode (orange box). Dashed lines: thom contacts at s = 1 kb were as frequent as cis contacts at s = ~5 kb and ~30 kb in tightly and loosely paired region, respectively. Schematics illustrate differences in the organization of tightly and loosely paired regions
Fig. 3
Fig. 3
Pairing in PnM cells is correlated with active genomic regions and can be disrupted by RNAi. a 1.5 Mb region of 2 L: Pairing scores (PS) and cis scores (CS) shown in a genome browser as compared to chromatin types identified in Kc167 cells and with SNVs in PnM cells. b Normalized distributions of PS within regions of different chromatin types. Dashed line shows the threshold between tight and loose pairing. *p < 1−10, Mood’s test against yellow chromatin. c Distribution of PS values relative to the eigenvector shows that pairing is correlated with compartmentalization, A-type compartments being almost exclusively tightly paired, Spearman’s correlation coefficient (rs) = 0.706, p < 10−10. d Distribution of PS values relative to gene expression in PnM cells shows that expressed genes are almost exclusively tightly paired, Spearman’s correlation coefficient (rs) = 0.397, p < 10−10. e Levels of pairing (quantified and displayed as in Fig. 1d, in PnM cells after Slmb and TopII knockdown showed a reduction as compared to the control (mock) at all loci (*P < = 0.05, unpaired t-test) except for the AACAC satellite repeat and, in the case of TopII knockdown, at BX-C (ns, non-significant; error bars, s.d for three biological replicates; for N > 100 nuclei/replicate). Source data are provided as a Source Data file. f After Slmb and TopII knockdown, the aggregated pairing score (APS) values were reduced by 0.203% and 0.201%, respectively, as compared to untreated sample (p < 0.001) and 0.141% and 0.139%, respectively, as compared to mock (p < 0.001). The 0.062% reduction in mock as compared to untreated samples was also significant (p < 0.001). p-values determined using bootstrapping (Methods)
Fig. 4
Fig. 4
Haplotype-resolved Hi-C in PnM cells distinguished different forms of thom from cis interactions. a Cis contact maps for two homologs and schematics depicting possible cis interactions. b Thom contact map demonstrating a variable structure of pairing, including tight, precise pairing interspersed with looser, less precise pairing. Thom interactions encompass organizational structures that are concordant with cis behavior and could facilitate a variety of transcriptional states, including i. active or ii. repressive environments. c Left: Homologous loops between tightly paired regions may form by extrusion (black arrows), anti-pairing (blue arrows), or a combination of both. Right: Here, loops could result in thom domains that are either loosely paired (top), or railroad-track paired throughout if they fold back on each other, (bottom), with cis-maternal and cis-paternal domain boundaries concordant in both scenarios. Note, loop extrusion in mammalian systems is proposed to involve a cohesin ring, (green oval) through which a single chromosome passes, suggesting that extrusion in the context of pairing may involve the passage of each homolog separately (shown) or two homologs simultaneously (not shown), the outcome of which could be either loosely or tightly paired domains. In a nonexclusive alternative, loops are formed by anti-pairing, where pairing might be counterbalanced with unpairing via anti-pairing factors such as Cap-H2. Interestingly, extrusion and/or anti-pairing could bring enhancers and promoters together at the base of the loops (indicated by *), activating transcription, such as might happen in tightly paired regions. In the context of anti-pairing, this could explain the curious co-localization of Cap-H2 with regions of tight pairing (Supplementary Table 3; also ref. )

References

    1. Cremer T, Cremer M. Chromosome territories. Cold Spring Harb. Perspect. Biol. 2010;2:a003889. doi: 10.1101/cshperspect.a003889. - DOI - PMC - PubMed
    1. Lieberman-Aiden E, et al. Comprehensive mapping of long-range interactions reveals folding principles of the human genome. Science. 2009;326:289–293. doi: 10.1126/science.1181369. - DOI - PMC - PubMed
    1. Kalhor R, Tjong H, Jayathilaka N, Alber F, Chen L. Genome architectures revealed by tethered chromosome conformation capture and population-based modeling. Nat. Biotechnol. 2011;30:90–98. doi: 10.1038/nbt.2057. - DOI - PMC - PubMed
    1. Dixon JR, et al. Topological domains in mammalian genomes identified by analysis of chromatin interactions. Nature. 2012;485:376–380. doi: 10.1038/nature11082. - DOI - PMC - PubMed
    1. Hou C, Li L, Qin ZS, Corces VG. Gene density, transcription, and insulators contribute to the partition of the Drosophila genome into physical domains. Mol. Cell. 2012;48:471–484. doi: 10.1016/j.molcel.2012.08.031. - DOI - PMC - PubMed

Publication types