. 2019 Oct 3;9(1):14250.
doi: 10.1038/s41598-019-50530-4.

Centrosomal and ciliary targeting of CCDC66 requires cooperative action of centriolar satellites, microtubules and molecular motors

Affiliations

Centrosomal and ciliary targeting of CCDC66 requires cooperative action of centriolar satellites, microtubules and molecular motors

Deniz Conkar et al. Sci Rep. .

Abstract

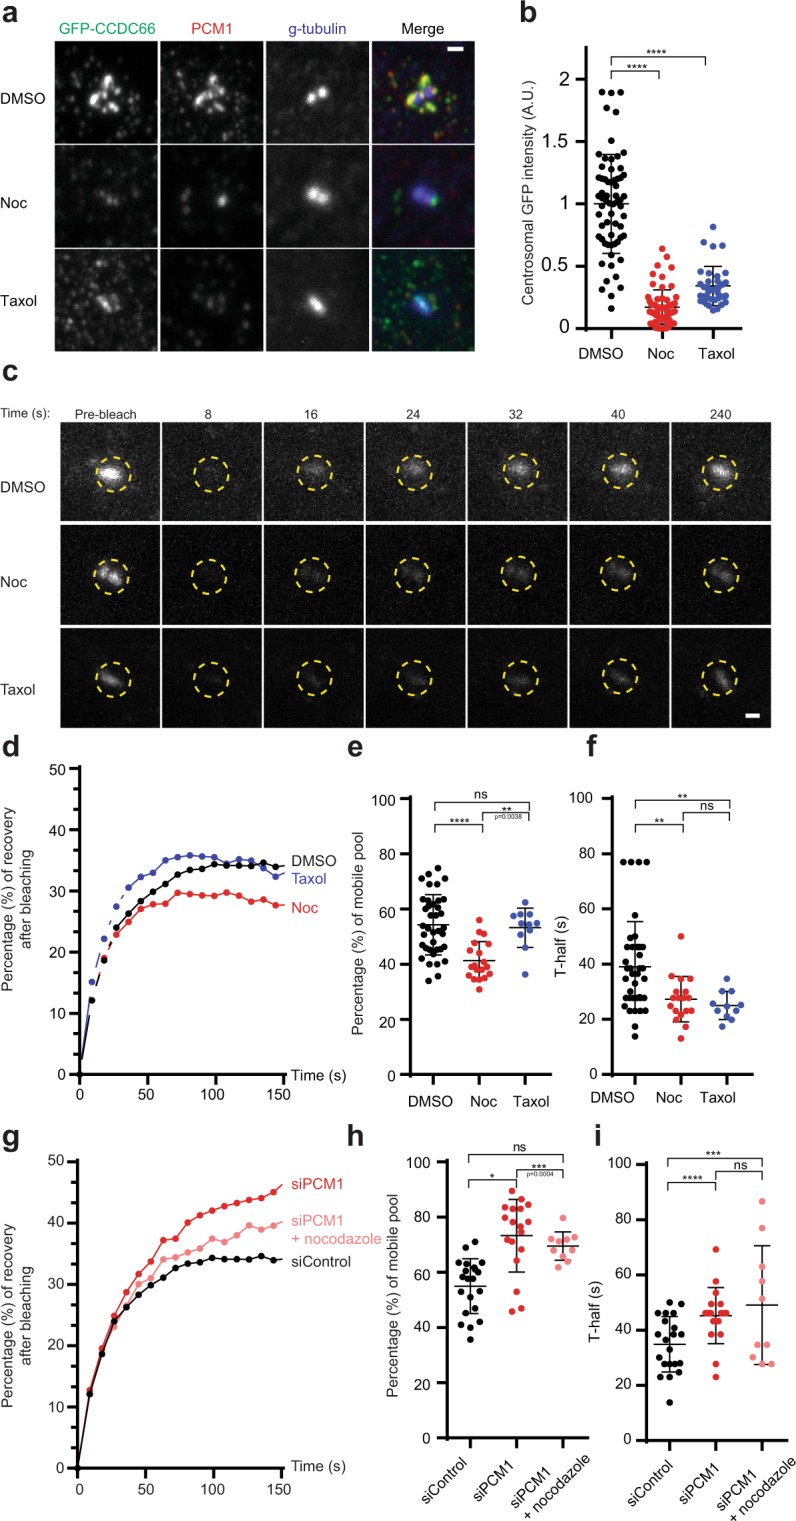
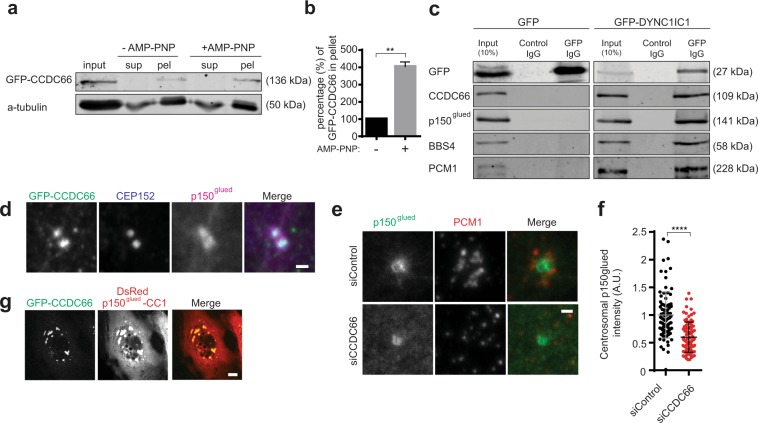
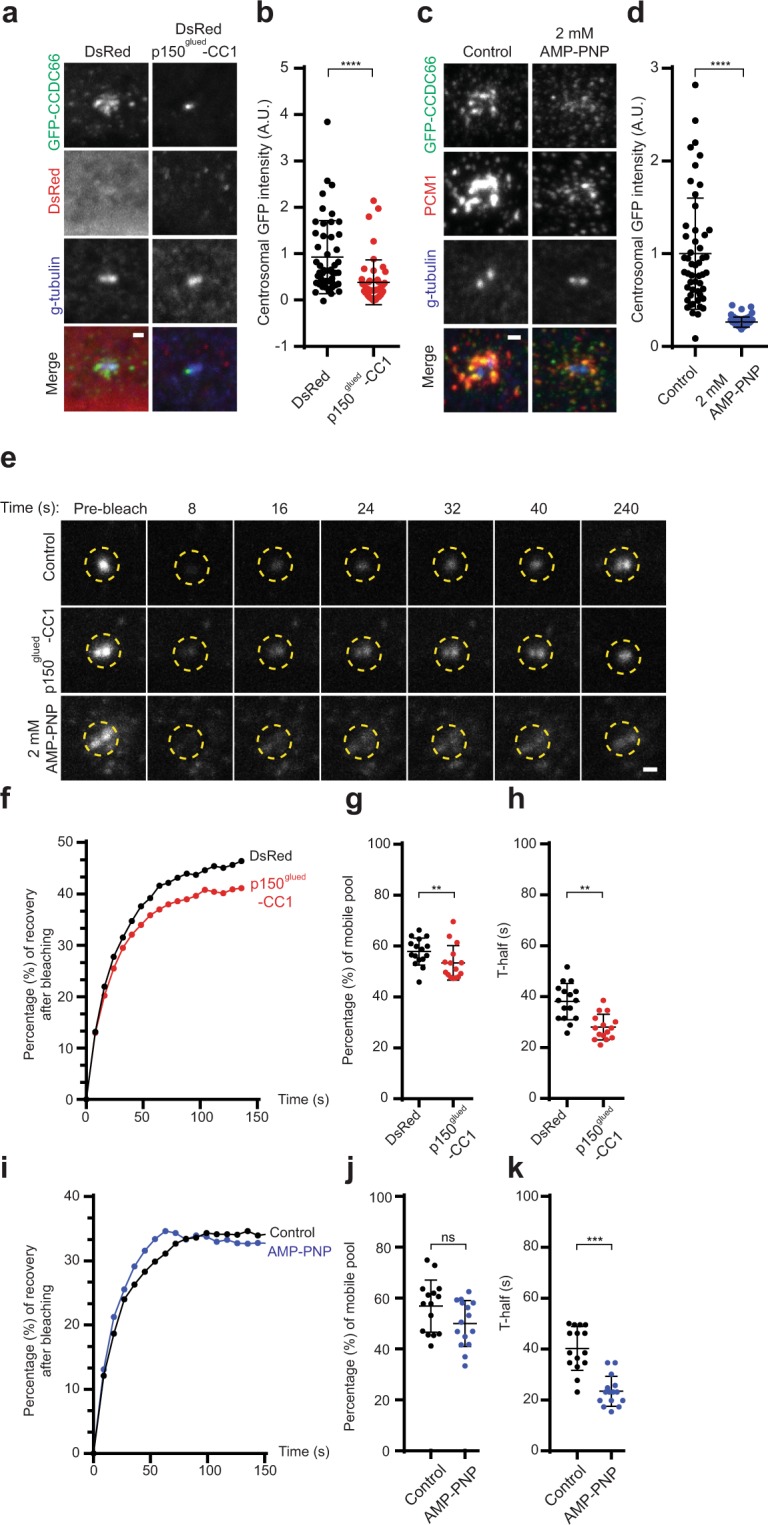
Mammalian centrosomes and cilia play key roles in many cellular processes and their deregulation is linked to cancer and ciliopathies. Spatiotemporal regulation of their biogenesis and function in response to physiological stimuli requires timely protein targeting. This can occur by different pathways, including microtubule-dependent active transport and via centriolar satellites, which are key regulators of cilia assembly and signaling. How satellites mediate their functions and their relationship with other targeting pathways is currently unclear. To address this, we studied retinal degeneration gene product CCDC66, which localizes to centrosomes, cilia, satellites and microtubules and functions in ciliogenesis. FRAP experiments showed that its centrosomal pool was dynamic and the ciliary pool associated with the ciliary axoneme and was stable. Centrosomal CCDC66 abundance and dynamics required microtubule-dependent active transport and tethering, and was inhibited by sequestration at satellites. Systematic quantitation of satellite dynamics identified only a small fraction to display microtubule-based bimodal motility, consistent with trafficking function. Majority displayed diffusive motility with unimodal persistence, supporting sequestration function. Together, our findings reveal new mechanisms of communication between membrane-less compartments.


Conflict of interest statement

The authors declare no competing interests.

Figures

Figure 1
Figure 1
Centriolar satellites inhibit CCDC66 dynamic localization at the centrosome. (a) Effect of PCM1, CEP72 and CEP290 depletion on CCDC66 level at the centrosome. RPE1::GFP-CCDC66 cells were transfected with control, PCM1, CEP290 or CEP72 siRNAs for 48 h. Cells were then fixed and stained for GFP, PCM1 and gamma tubulin. Images represent centrosomes in cells from the same coverslip taken with the same camera settings. Scale bar, 1 μm. (b) Quantification of (a). GFP-CCDC66 fluorescence intensities were measured in a 2.5 μm2 circular area around the centrosome from two independent experiments. Levels are normalized to the mean of the control group (=1). n )0.50 cells for each group. t-test was used for statistical analysis. Standard error of mean (SEM): siControl = 0.046, siPCM1 = 0.075, siCEP290 = 0.17, siCEP72 = 0.27. (c) Effect of PCM1, CEP72 and CEP290 depletion on total cellular CCDC66 levels. Cells were transfected with control, PCM1, CEP290 or CEP72 siRNAs for 48 h. Cell extracts were cells were immunoblotted for CCDC66, PCM1, CEP290 and CEP72. Beta-actin was used as a loading control. (d) Effect of PCM1, CEP72 and CEP290 depletion on CCDC66 dynamics at the centrosome. RPE1::GFP-CCDC66 cells were transfected with control, PCM1, CEP290 or CEP72 siRNAs for 48 h. 2.5 μm2 circular area around the centrosome marked by yellow dashed circle was photobleached and imaged for 250 seconds after photobleaching. Still images represent centrosomal GFP-CCDC66 signal at the indicated times. Scale bar, 1 μm. (e) Percentage of recovery graph from (d). Individual FRAP experiments from two independent experiments were fitted into one phase association curves. n = 8 for control and PCM1, n = 8 for CEP290 and n = 6 for CEP72 depleted cells per group. Half-time of and mobile pool were calculated using recovery data. (f) mobile pool of (d). Error bars, SEM: siControl = 2.49, siPCM1 = 3.10, siCEP290 = 2.16, siCEP72 = 3.64 and (g) half-time analysis of (d). Error bars, SEM: siControl = 4.00, siPCM1 = 2.39, siCEP290 = 2.89, siCEP72 = 2.50.
Figure 2
Figure 2
An intact and dynamic microtubule network is required for CCDC66 dynamic localization at the centrosome. (a) Effect of microtubule depolymerization and stabilization on CCDC66 level at the centrosome. RPE1::GFP-CCDC66 cells were treated with 0.1% DMSO, 5 μg/ml nocodazole or 5 μM taxol for 1 h. Cells were then fixed and stained for GFP, PCM1 and gamma tubulin. Images represent centrosomes in cells from the same coverslip taken with the same camera settings. Scale bar, 1 μm. (b) Quantification of (a). GFP-CCDC66 fluorescence intensities were measured in a 2.5 μm2 circular area around the centrosome from two independent experiments. Levels are normalized to the mean of the control group ( =1). n = 50 cells for each group. t-test was used for statistical analysis. Error bars, SEM: DMSO control = 0.05, nocodazole = 0.02, taxol = 0.03. **<00.05, ***0.0005. (c) Effect of microtubule depolymerization and stabilization on CCDC66 dynamics at the centrosome. RPE1::GFP-CCDC66 cells were treated with 0.1% DMSO, 5 μg/ml nocodazole or 5 μM taxol for 1 h. 2.5 μm2 circular area around the centrosome marked by yellow dashed circle was photobleached and imaged for 250 seconds after photobleaching. Still images represent centrosomal GFP-CCDC66 signal at the indicated times. Scale bar, 1 μm. (d) Percentage of recovery graph from (c). Individual FRAP experiments from two independent experiments were fitted into one phase association curves. n = 10 for DMSO, n = 9 for nocodazole and n = 5 for taxol treated cells per group. Half-time of and mobile pool were calculated using recovery data. (e) mobile pool of (d). Error bars, SEM: DMSO = 1.77, nocodazole = 1.57, taxol = 2.13. (f) half-time analysis of (d). Error bars, SEM: DMSO = 2.67, nocodazole = 1.95, taxol = 1.52. (g) Combinatorial effect of microtubule depolymerization and PCM1 depletion on CCDC66 dynamics at the centrosome. RPE1::GFP-CCDC66 cells were transfected with control and PCM1 siRNAs for 48 h and then treated with 5 μg/ml nocodazole for 1 h. Individual FRAP experiments from two independent experiments were fitted into one phase association curves and percentage of recovery graphs were generated. n = 12 for control depleted, n = 12 for PCM1 depleted and n = 10 for PCM1 depleted and nocodazole treated cells per group. Half-time of and mobile pool were calculated using recovery data. (h) mobile pool of (d) Error bars, SEM: siControl = 2.19, siPCM1 = 1.48, siPCM1+nocodazole = 1.63. (i) half-time analysis of (d). Error bars, SEM: siControl = 2.2, siPCM1 = 2.4, siPCM1 = nocodazole = 6.80.
Figure 3
Figure 3
They dynein complex interacts and co-localizes with CCDC66. (a) Analysis of CCDC66 microtubule association in cells treated with unhydrolyzable ATP analog AMP-PNP. HEK293T cells were transfected with GFP-CCDC66, treated with 0.5 mM unhydrolyzable ATP analog AMP-PNP and in vitro microtubule pelleting experiments were performed with extracts from control and AMP-PNP-treated cells. Equal volumes of input, supernatant and pellet fractions were immunoblotted for GFP and alpha-tubulin. Graph represents the mean values from two independently performed pelleting experiments, p = 0.0038. (b) Quantification of GFP-CCDC66 amount in pellet from (a). Percentage of GFP-CCDC66 in the pellet relative to input was quantified by measuring GFP band intensities of pellet and input fractions and normalizing them to alpha tubulin levels. (c) Immunoprecipitation of the dynein complex. HEK293T cells were transfected with GFP or GFP-DYNC1IC1 for 48 h. Complexes were immunoprecipitated (IP) with control IgG or anti-GFP antibody, and co-precipitated proteins were detected with GFP, CCDC66, p150glued, BBS4 and PCM1. (d) Localization of CCDC66 and p150glued at the centrosome. RPE1::GFP-CCDC66 cells were fixed with methanol and stained with GFP, p150glued and CEP152 (centrosome marker). Scale bar, 1 μm. (e) Effect of CCDC66 depletion on p150glued level at the centrosome. RPE1 cells were transfected with control and CCDC66 siRNAs for 48 h. Cells were then fixed and stained for p150glued and PCM1. Images represent centrosomes in cells from the same coverslip taken with the same camera settings. Scale bar, 1 μm. (f) Quantification of (e). p150glued fluorescence intensities were measured in a 2.5 μm2 circular area around the centrosome from two independent experiments. Levels are normalized to the mean of the control group (=1). n = 50 cells for each group. t-test was used for statistical analysis. Error bars, SEM: siControl = 0.04, siCCDC66 = 0.03. (g) Effects of p150glued-CC overexpression on localization of CCDC66. RPE1::GFP-CCDC66 were transfected with DsRed p150glued 217-548 for 24 h, fiexed and stained for GFP. Scale bar, 10 μm.
Figure 4
Figure 4
Activity of molecular motors are required for CCDC66 dynamic localization at the centrosome. (a) Effect of inhibiting dynein complex activity on CCDC66 level at the centrosome. RPE1::GFP-CCDC66 cells were transfected with DsRed (control) or DsRed p150glued 217-548 for 24 h. Cells were then fixed with PFA and stained for gamma tubulin. Images represent centrosomes in cells from the same coverslip taken with the same camera settings. Scale bar, 1 μm. (b) Quantification of (a). GFP-CCDC66 fluorescence intensities were measured in a 2.5 μm2 circular area around the centrosome from two independent experiments. Levels are normalized to the mean of the control group (=1). n = 50 cells for each group. t-test was used for statistical analysis. Error bars, SEM: DsRed = 0.12, p150glued CC1 = 0.07. (c) Effect of inhibiting molecular motor activity on CCDC66 level at the centrosome. RPE1-CCDC66 cells were treated with 2 mM AMP-PNP for 10 min. Cells were then fixed and stained for GFP, PCM1 and gamma tubulin. Scale bar, 1 μm. (d) Quantification of (a). GFP-CCDC66 fluorescence intensities were measured in a 2.5 μm2 circular area around the centrosome from two independent experiments. Levels are normalized to the mean of the control group (=1). n = 50 cells for each group. t-test was used for statistical analysis. Error bars, SEM: control = 0.84, AMP-PNP = 0.01. (e) Effect of inhibiting molecular motor activity on CCDC66 dynamics at the centrosome. RPE1::GFP-CCDC66 cells were transfected with DsRed (control) or DsRed p150glued 217-548 for 24 h and in parallel they cells were treated with 2 mM AMP-PNP for 10 min. 2.5 μm2 circular area around the centrosome marked by yellow dashed circle was photobleached and imaged for 250 seconds after photobleaching. Still images represent centrosomal GFP-CCDC66 signal at the indicated times. Scale bar, 1 μm. (f,i) Percentage of recovery graph from (c). Individual FRAP experiments from two independent experiments were fitted into one phase association curves. n = 8 for DsRed and n = 6 for p150glued CC1 transfected cells per group. n = 10 for control and n = 7 for AMP-PNP treated cells per group. Half-time of and mobile pool were calculated using recovery data. (g, j) mobile pool of (d). Error bars, SEM: DsRed = 1.35, p150glued CC1 = 1.38, control = 2.65, AMP-PNP = 2.34. (h,k) half-time analysis of (d). Error bars, SEM: DsRed = 1.41, p150glued CC1 = 1.95, control = 2.23, AMP-PNP = 1.52.
Figure 5
Figure 5
Ciliary CCDC66 is not dynamic and its recruitment is regulated by satellites. (a) STED analysis of ciliary CCDC66 localization. RPE1::GFP-CCDC66 cells were serum starved for 48 h, fixed with 4% PFA and stained for GFP, Arl13B (ciliary membrane marker) or acetylated tubulin (ciliary axoneme marker). Cells were imaged on a Leica TCS SP8 STED 3X confocal laser scanning microscope. Scale bar, 1 μm. (b) FRAP analysis of ciliary GFP CCDC66. RPE1::GFP-CCDC66 cells were serum starved for 48 h. Whole cilium, upper ciliary region or area between the tip and basal body indicated by yellow dashed rectangles was photobleached and cells were imaged for 250 seconds after photobleaching. Still images represent ciliary GFP-CCDC66 signal at indicated time points. Scale bar: 1 μm. (c,d) Percentage of recovery graph from (b). Individual FRAP experiments from two independent experiments (n In7 in total) were fitted into one phase association curves. (e) Effect of PCM1, CEP72 and CEP290 depletion on CCDC66 level at the cilia. RPE1::GFP-CCDC66 cells were transfected with control, PCM1, CEP290 or CEP72 siRNAs. 24 h after transfection, they were serum starved for 48 h. Cells were then fixed and stained for GFP, PCM1 and acetylated tubulin (cilia marker). Images represent cilia in cells from the same coverslip taken with the same camera settings. Scale bar, 1 μm. (f) Quantification of GFP-CCDC66 ciliary concentration from (e). GFP-CCDC66 fluorescence intensities were measured in the ciliary area defined by the acetylated tubulin ciliary marker from two independent experiments. Ciliary protein concentrations were determined by dividing fluorescence signal of the protein to the cilium length, which was quantified using acetylated tubulin staining. Levels are normalized to the mean of the control group (=1). n = 50 cells for each group. t-test was used for statistical analysis. Error bars, SEM: siControl = 0.06, siPCM1 = 0.21, siCEP290 = 0.14, siCCEP72 = 0.27.
Figure 6
Figure 6
CCDC66-positive centriolar satellites exhibit both diffusive and microtubule-mediated directional motility. (a) Representative fluorescence images of satellites from time-lapse videos of RPE1::GFP-CCDC66 cells (top-left and bottom-left panels) and corresponding trajectories of satellites as a function of time (top-right and bottom-right panels). CCDC66-positive satellites were identified and tracked using the single-particle tracking algorithms detailed in Materials and Methods. Satellites were classified into persistent (magenta) and diffusive (green) motility groups using a persistence ratio cutoff value of 0.5. (b) The distribution of the persistence ratio (direct distance(D)/total distance(T)) was used to determine the different motility groups. Persistence histogram (gray bars) were fitted with a single or double Gaussian function (black line). (c) Average speed and direct distance of satellites. (d) The distribution of satellite instant speed. The changes at higher instant speed values were shown in the inset. (e) Time-colored trajectories of persistent (top-left) and diffusive (bottom-left) satellites and analysis of their directionality to the centrosome (right-hand graphs). Corresponding distribution of distance from/to centroids were plotted to determine the directed motility of satellites. Centroids were marked as C, indicating the localization of the centrosome. Negative values indicate movement towards the centrosome and positive values indicate movement away from the centrosome. (f) A representative fluorescence image of RPE1::GFP-CCDC66 cells stained with SIR-Tubulin. Images were overlaid to determine microtubule mediated movement of satellite that move persistently. The right-hand panel indicates the time dependent movement of satellites. (g) Representative satellite (green) exhibits bimodal motility by alternating between persistent and diffusive movements. Still images from Movie 6 at the indicated time points were shown. The bottom right-hand panel indicates the time dependent movement of the satellite.

References

    1. Heydeck W, Fievet L, Davis EE, Katsanis N. The complexity of the cilium: spatiotemporal diversity of an ancient organelle. Curr Opin Cell Biol. 2018;55:139–149. doi: 10.1016/j.ceb.2018.08.001. - DOI - PMC - PubMed
    1. Nigg EA, Holland AJ. Once and only once: mechanisms of centriole duplication and their deregulation in disease. Nat Rev Mol Cell Biol. 2018;19:297–312. doi: 10.1038/nrm.2017.127. - DOI - PMC - PubMed
    1. Braun Daniela A., Hildebrandt Friedhelm. Ciliopathies. Cold Spring Harbor Perspectives in Biology. 2016;9(3):a028191. doi: 10.1101/cshperspect.a028191. - DOI - PMC - PubMed
    1. Reiter JF, Leroux MR. Genes and molecular pathways underpinning ciliopathies. Nat Rev Mol Cell Biol. 2017;18:533–547. doi: 10.1038/nrm.2017.60. - DOI - PMC - PubMed
    1. Andersen JS, et al. Proteomic characterization of the human centrosome by protein correlation profiling. Nature. 2003;426:570–574. doi: 10.1038/nature02166. - DOI - PubMed

Publication types