. 2019 Oct 3;9(1):14265.
doi: 10.1038/s41598-019-50642-x.

Transcriptome Sequencing of Peripheral Blood Mononuclear Cells from Elite Controller-Long Term Non Progressors

Affiliations

Transcriptome Sequencing of Peripheral Blood Mononuclear Cells from Elite Controller-Long Term Non Progressors

Francisco Díez-Fuertes et al. Sci Rep. .

Abstract

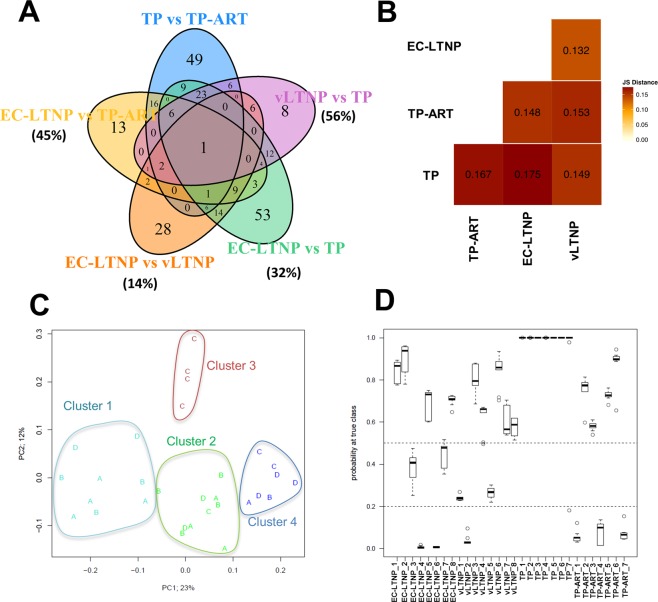
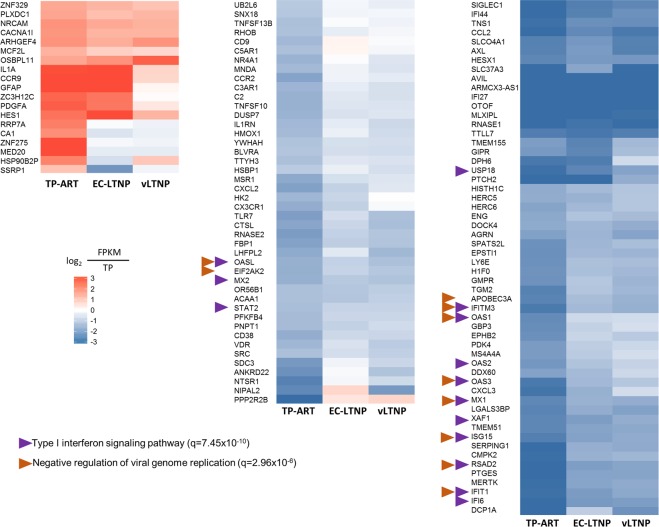
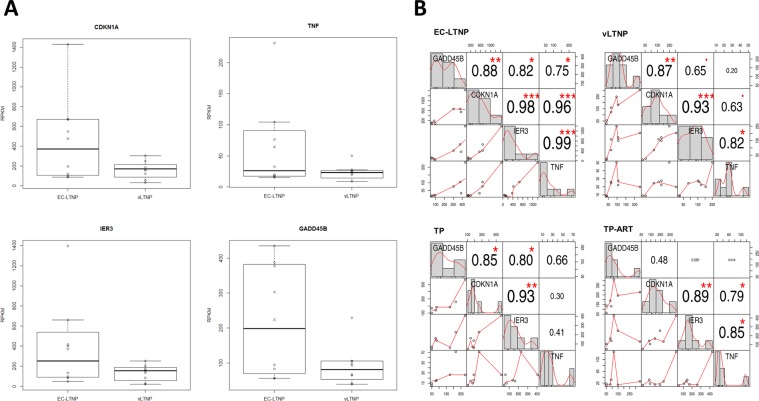
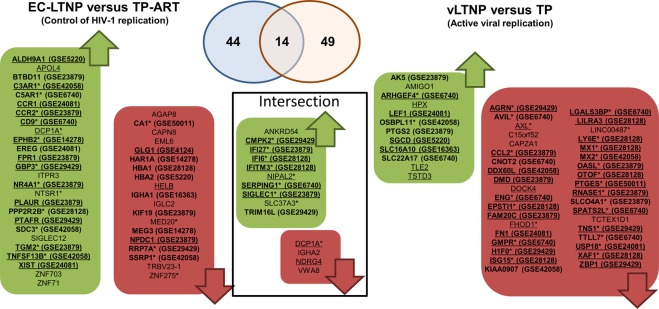
The elite controller (EC)-long term non-progressor (LTNP) phenotype represent a spontaneous and advantageous model of HIV-1 control in the absence of therapy. The transcriptome of peripheral blood mononuclear cells (PBMCs) collected from EC-LTNPs was sequenced by RNA-Seq and compared with the transcriptomes from other phenotypes of disease progression. The transcript abundance estimation combined with the use of supervised classification algorithms allowed the selection of 20 genes and pseudogenes, mainly involved in interferon-regulated antiviral mechanisms and cell machineries of transcription and translation, as the best predictive genes of disease progression. Differential expression analyses between phenotypes showed an altered calcium homeostasis in EC-LTNPs evidenced by the upregulation of several membrane receptors implicated in calcium-signaling cascades and intracellular calcium-mobilization and by the overrepresentation of NFAT1/Elk-1-binding sites in the promoters of the genes differentially expressed in these individuals. A coordinated upregulation of host genes associated with HIV-1 reverse transcription and viral transcription was also observed in EC-LTNPs -i.e. p21/CDKN1A, TNF, IER3 and GADD45B. We also found an upregulation of ANKRD54 in EC-LTNPs and viremic LTNPs in comparison with typical progressors and a clear alteration of type-I interferon signaling as a consequence of viremia in typical progressors before and after receiving antiretroviral therapy.


Conflict of interest statement

The authors declare no competing interests.

Figures

Figure 1
Figure 1
Comparison between phenotypes. Venn diagram showing overlapped DEGs found in several comparisons analyzed in the study (TP vs TP-ART, EC-LTNP vs TP-ART, EC-LTNP vs vLTNP, EC-LTNP vs TP and vLTNP vs TP). Only SLC37A3 were found in all the comparisons analyzed (A). Distance matrix showing similarities between phenotypes, calculated by the Jensen-Shannon divergence as implemented in the Bioconductor’s package cummerbund (B). Multidimensional scaling (MDS) plot of the 30 samples based on the first two principal coordinates (PC, x and y axes). Labels A, B, C and D correspond to EC-LTNP, vLTNP, TP and TP-ART phenotypes, respectively. Color code is based on k-means clustering results with N = 4. The percentage of variability explained by each PC is indicated (C). Probabilities to be correctly classified for each individual employing the 20 best predictive genes. A total of ten independent predictions were carried out with LOOCV and the distribution of these probabilities are showed. The majority of the individuals (n = 22, 73.3%) were correctly classified and 20 of them obtained p-values > 0.5 at true class after 10 repetitions (and therefore p-values < 0.5 for the sum of the probabilities to be classified as any of the 3 other false classes). At the other extreme, some other individuals were repeatedly incorrectly classified with all the p-values < 0.2 for the 10 models. This is the case for EC-LTNPs 4 and 6, vLTNP 2 and TP-ARTs 1, 4 and 7. EC-LTNP 4 and 6 were classified as vLTNPs for all the repetitions whereas the vLTNP 2 was classified as EC-LTNP also in all the iterations. In the case of the three TP-ARTs erroneously classified (1, 4 and 7), two of them were classified as EC-LTNPs and the other one as vLTNP. Between these two situations, 2 individuals (vLTNPs 1 and 5) were ambiguously classified with p-values at true class below 0.3 and with similar p-values to be classified as EC-LTNPs. The 10 models were able to classify correctly all the TPs with p-values close to 1 in all cases (except 1 out of the 10 models for TP 7 which was classified as vLTNP) (D).
Figure 2
Figure 2
Best predictor genes of disease progression according to the hierarchical Bayesian classification model. The boxplots were generated in R and show the first and third quartile values for the RPKM distribution (upper and lower limits of the box), the median (the line splitting the box into two parts), the highest and lowest values (lines connected to the box through dashed lines), outlier values (open circles) and the mean value (crosses) for each phenotype.
Figure 3
Figure 3
Deregulated genes in the TP/TP-ART comparison. Heatmap showing the comparison of the mean RPKM expression values for genes differentially expressed between TPs before and after receiving ART (the values for EC-LTNP and vLTNP were also showed just for the information). The RPKM expression values obtained for TPs, EC-LTNPs and vLTNPs are represented as a comparison with the values obtained for TPs.
Figure 4
Figure 4
EC-LTNP versus TP-ART comparison. Gene Ontology terms statistically significant in the comparison EC-LTNP versus TP-ART (FDR corrected p-values < 0.1) (A). The promoter sequences of the genes differentially expressed between EC-LTNP and TP-ART were inspected to identify putative transcription factor binding sites using PROMO algorithm in ALGGEN server. The total number of transcriptional factor binding sites found and the percentage of these genes with a concrete binding site are showed (B).
Figure 5
Figure 5
Expression of GADD45B, CDKN1A, IER3 and TNF genes. RPKMs obtained for each gene in EC-LTNPs and vLTNPS (A). The correlation of these expression values between genes is shown for each group of patients. The distribution of each variable is shown on the diagonal, the bivariate scatter plots of RPKMs with a fitted line are displayed on the bottom of the diagonal and the value of the correlation plus the significance level as stars on the top of the diagonal according to Pearson parametric correlation test. This plot was generated using “PerformanceAnalytics” R package. Statistically significant p- values indicate a significant linear relationship between the expression values of two genes and are displayed as follows: ***p < 0.001; **p < 0.01 and *p < 0.05 (B).
Figure 6
Figure 6
Protein-protein interaction network of CDKN1A, TNF, IER3 and GADD45B with viral proteins. The whole HIV-1 human interaction database was downloaded and all the interactions of CDKN1A, TNF, IER3 and GADD45B with viral proteins were mapped.
Figure 7
Figure 7
Genes associated with LTNP condition. The figure shows DEGs in the EC-LTNP versus TP-ART and vLTNP versus TP comparisons. Framed genes represent the intersection between both comparisons. Green and red boxes show upregulated and downregulated DEGs, respectively. Genes regulated by interferon are underlined whereas genes associated with an active viral replication (identified by the comparison of TP with TP-ART) are designated by an asterisk. DEGs found in other transcriptomic profiling studies of HIV-positive individuals with different degrees of disease progression were searched for a curated dataset collection. The DEGs found in other datasets are in bold, indicating their Gene Expression Omnibus (GEO) accession numbers in parenthesis. Only datasets generated from blood cells and with a fold change of at least 2.0 were included in this figure. The included datasets and the phenotypes compared were: GSE14278 (HIV resistent vs HIV high-risk negative), GSE16363 (aviremic vs viremic), GSE23879 (elite controller vs HIV-negative), GSE24081 (controller vs progressor), GSE28128 (CD4 rapid progressors vs CD8 rapid progressors), GSE29429 (healthy vs HIV-positive), GSE4124 (HIV− vs HIV+ transmitter), GSE42058 (uninfected vs HIV infected), GSE50011 (CD4 count >500 vs CD4 count <500), GSE5220 (aviremic vs viremic), GSE6740 (CD4 uninfected vs CD4 non-progressor) and GSE6740 (CD8 non-progressor vs CD8 acute).

References

    1. Deeks SG, Walker BD. Human immunodeficiency virus controllers: mechanisms of durable virus control in the absence of antiretroviral therapy. Immunity. 2007;27:406–416. doi: 10.1016/j.immuni.2007.08.010. - DOI - PubMed
    1. Poropatich K, Sullivan DJ., Jr. Human immunodeficiency virus type 1 long-term non-progressors: the viral, genetic and immunological basis for disease non-progression. J Gen Virol. 2010;92:247–268. doi: 10.1099/vir.0.027102-0. - DOI - PubMed
    1. Collaborative Group on AIDS Incubation and HIV Survival. Time from HIV-1 seroconversion to AIDS and death before the widespread use of highly active anti-retroviral therapy: a collaborative re-analysis. Lancet. 355, 1131–1137 (2000). - PubMed
    1. Okulicz JF, et al. Infectious Disease Clinical Research Program (IDCRP) HIV Working Group. Clinical outcomes of elite controllers, viremic controllers, and long-term nonprogressors in the US Department of Defense HIV Natural History Study. J Infect Dis. 2009;200:1714–1723. doi: 10.1086/646609. - DOI - PubMed
    1. Saksena NK, Rodes B, Wang B, Soriano V. Elite HIV controllers: myth or reality? AIDS Rev. 2007;9:195–207. - PubMed

Publication types