. 2019 Oct 3;10(1):4503.
doi: 10.1038/s41467-019-12501-1.

A mechanism for the activation of the mechanosensitive Piezo1 channel by the small molecule Yoda1

Affiliations

A mechanism for the activation of the mechanosensitive Piezo1 channel by the small molecule Yoda1

Wesley M Botello-Smith et al. Nat Commun. .

Abstract

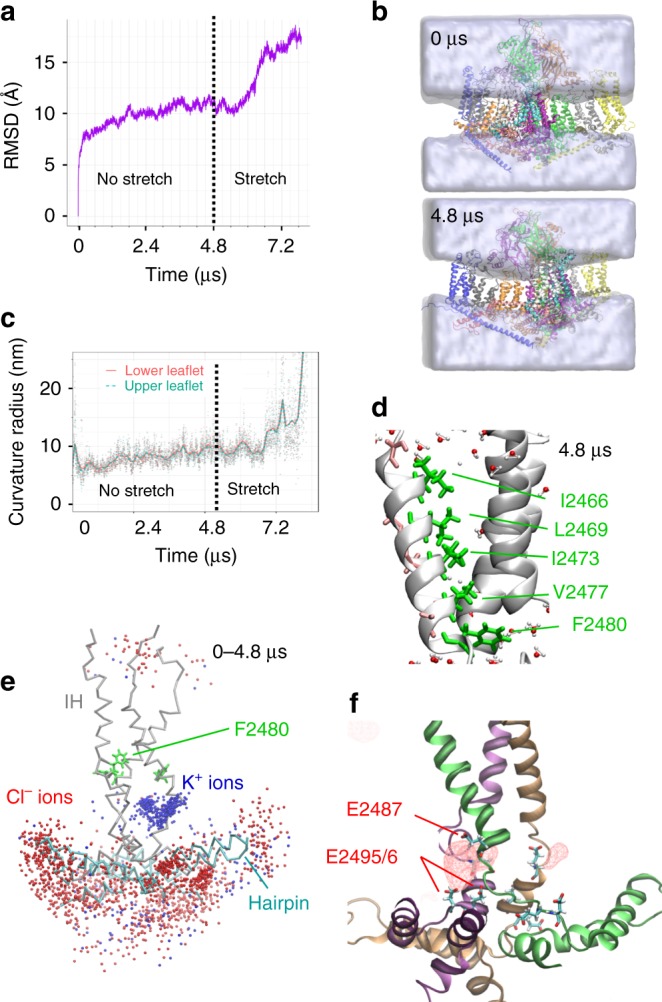
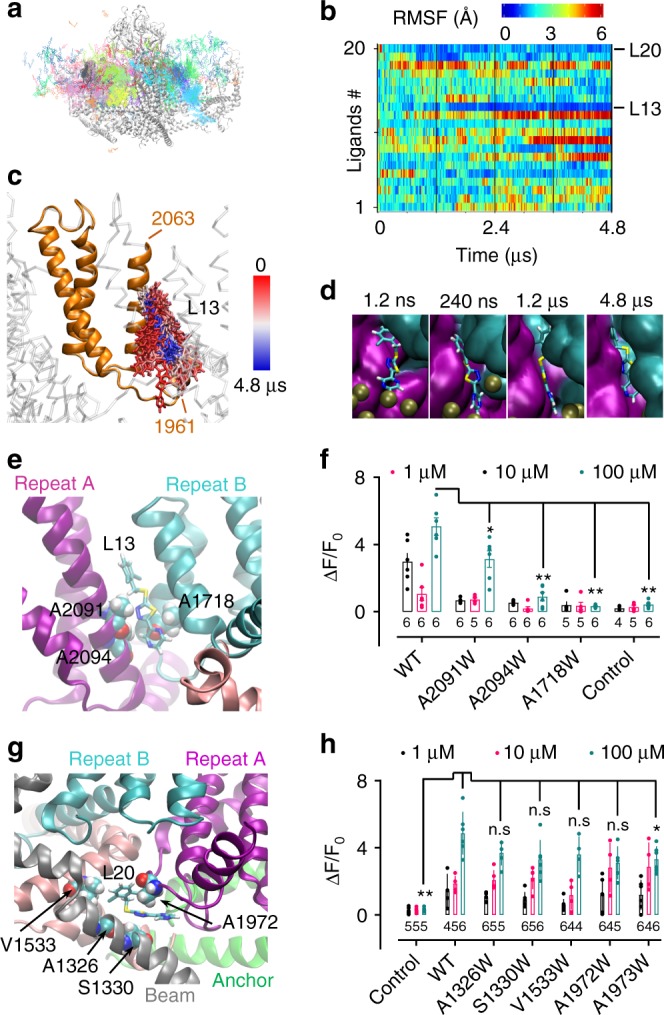
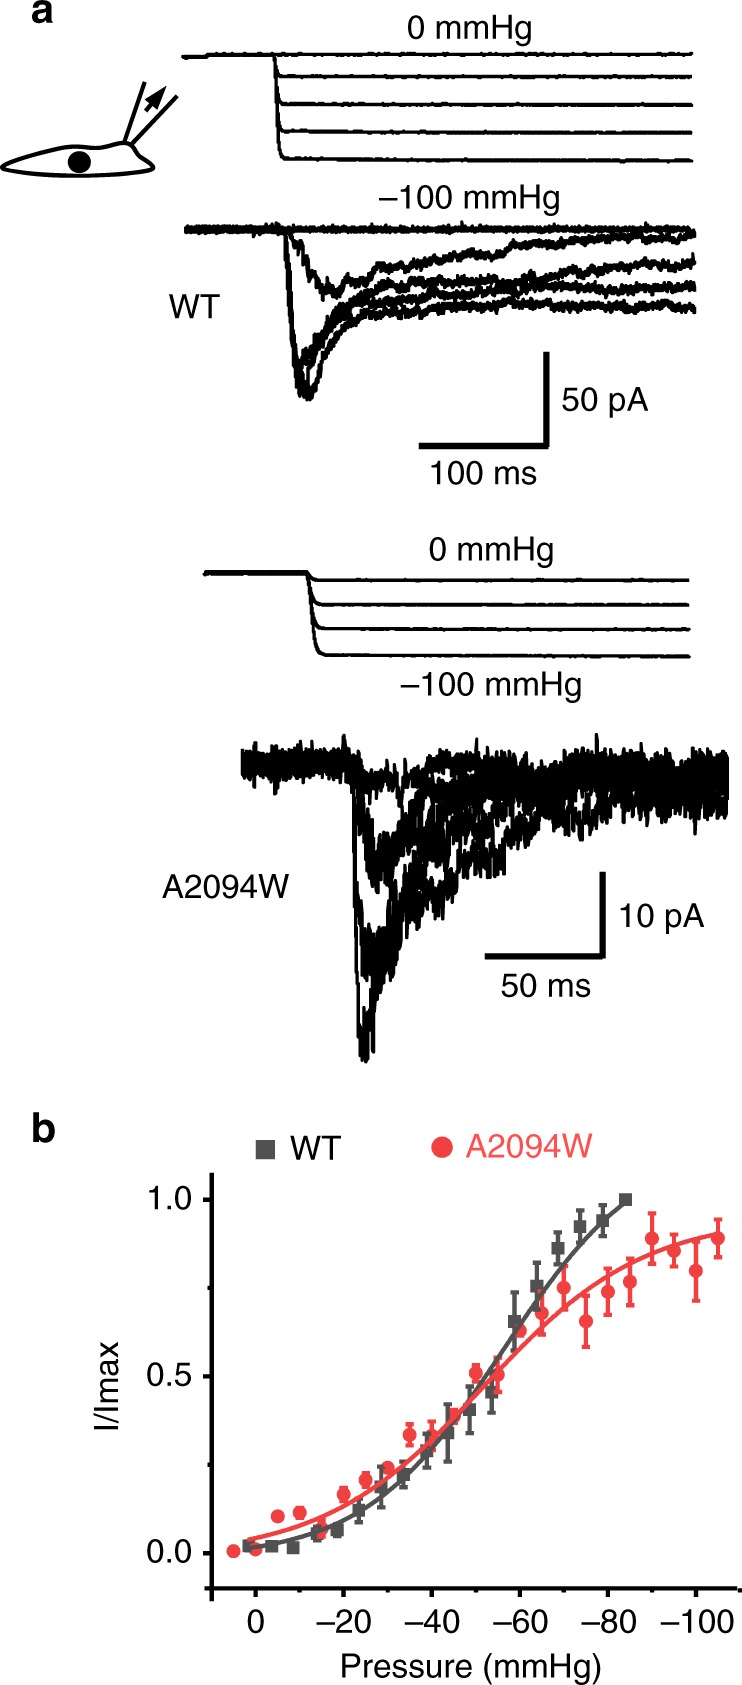
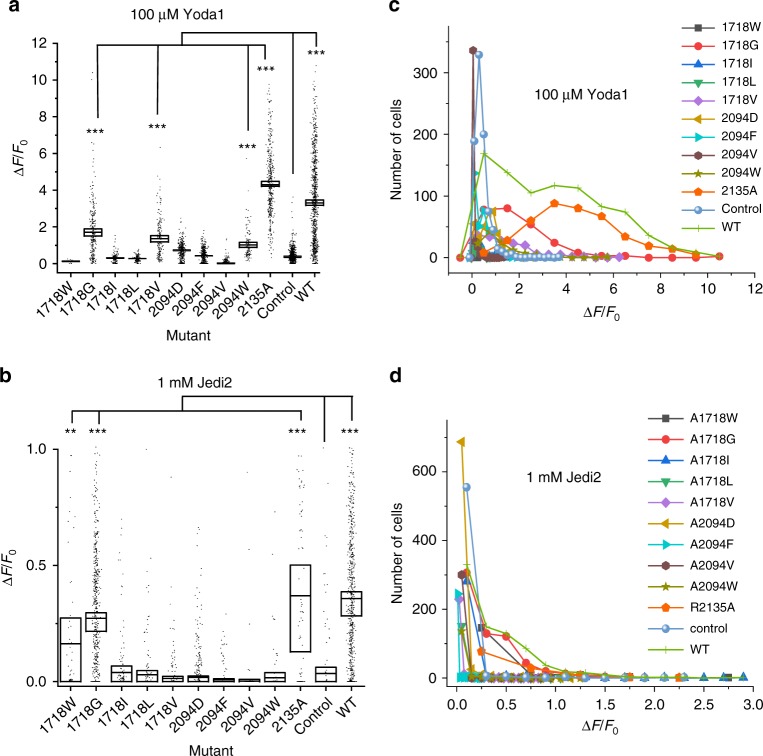
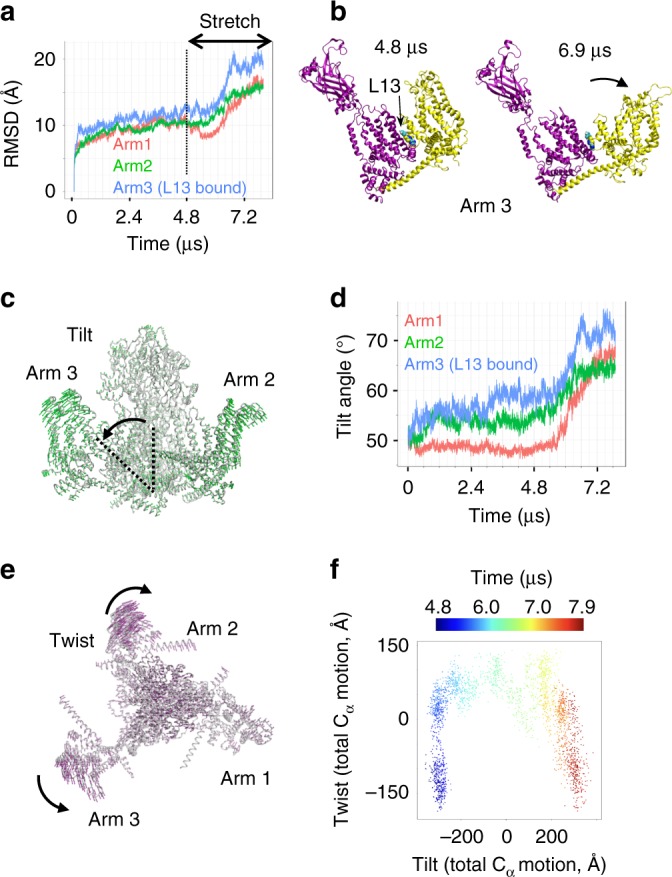
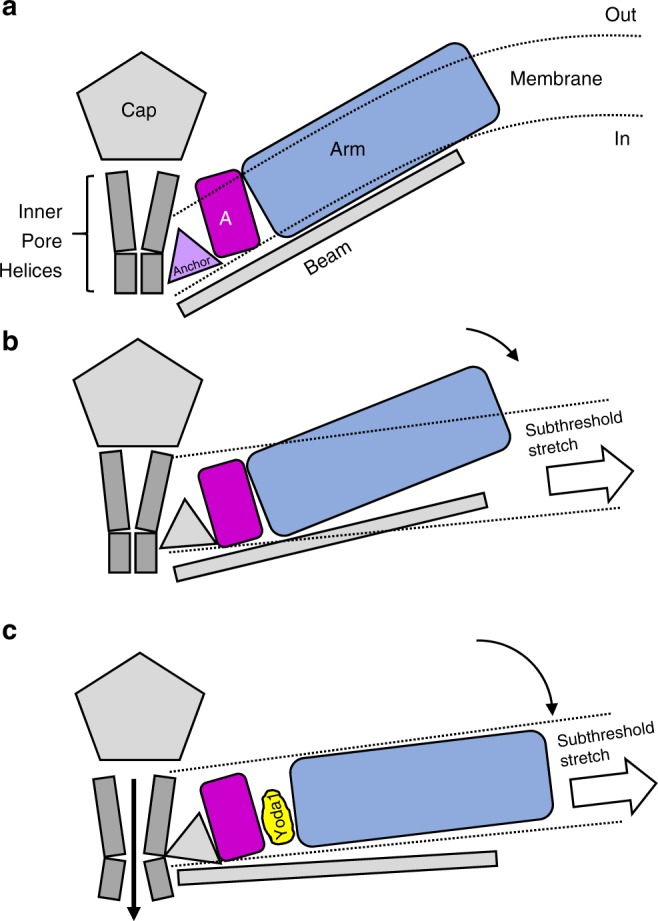
Mechanosensitive Piezo1 and Piezo2 channels transduce various forms of mechanical forces into cellular signals that play vital roles in many important biological processes in vertebrate organisms. Besides mechanical forces, Piezo1 is selectively activated by micromolar concentrations of the small molecule Yoda1 through an unknown mechanism. Here, using a combination of all-atom molecular dynamics simulations, calcium imaging and electrophysiology, we identify an allosteric Yoda1 binding pocket located in the putative mechanosensory domain, approximately 40 Å away from the central pore. Our simulations further indicate that the presence of the agonist correlates with increased tension-induced motions of the Yoda1-bound subunit. Our results suggest a model wherein Yoda1 acts as a molecular wedge, facilitating force-induced conformational changes, effectively lowering the channel's mechanical threshold for activation. The identification of an allosteric agonist binding site in Piezo1 channels will pave the way for the rational design of future Piezo modulators with clinical value.


Conflict of interest statement

The authors declare no competing interests.

Figures

Fig. 1
Fig. 1
Membrane curvature and cation-selective pore fenestrations. a RMSD for protein backbone atoms during MD simulation. b Snapshots showing evolution of water density (shown as gray) around Piezo1 (shown as colored protein backbone). c Curvature radius plotted over time for the upper (red) and lower (cyan) leaflets. Dots represent individual time point curvature calculations, and lines represent LOESS fit with span of 4.7% of the total time using ggplot2 geom_stat function. d Detailed view of the channel pore showing the three inner helices and water molecules within 5 Å of protein backbone at t = 4.8 µs. Side chains are shown in one inner helix for clarity. e Pore region showing accumulated K+ (blue spheres) and Cl- (red spheres) ions within 5 Å of backbone and sampled every 24 ns during the first 4.8 µs (backbone shown at t = 4.8 µs). IH, inner helices. f Accumulated K+ ions density (red spheres)
Fig. 2
Fig. 2
Identification of a putative Yoda1 binding site and binding pathway. a Accumulated positions of all simulated ligands (every 24 ns) along 4.8 µs trajectory. The backbone is represented at t = 4.8 µs. b RMSF time course for each simulated ligand (L1–L20) colored as indicated from the scale from lower (blue) to higher (red) values. c Accumulated L13 positions sampled every 24 ns from 0 (red) to 4.8 µs (blue) onto the backbone shown at 4.8 µs. Orange backbone corresponds to the 1961–2063 region. d Positions of L13 (licorice) sampled at the indicated time against the protein backbone (cyan: Piezo repeat B, magenta: Piezo repeat A, brown spheres: phosphate groups). e Positions of A1718, A2091 and A2094 and L13 inside the binding pocket sandwiched between Piezo repeats A (magenta) and B (cyan). f Dotted plot showing Yoda1-induced calcium signals in ΔPZ1 cells co-transfected with GC6 and the indicated constructs or transfected with GC6 only (control). g Position of L20 relative to surrounding small residues at 4.8 µs. h Dotted plot showing Yoda1-induced calcium signals in ΔPZ1 cells co-transfected with the indicated constructs and GC6 or transfected with GC6 only (control). In f, h the numbers indicate the number of independent experiments n and each data point represents an average of at least 10 individual cells. Source data are provided as a Source Data file. Error bars = standard errors of mean values. Two-tails Mann–Whitney U-tests were performed to compare data distribution between WT and mutants/control for 100 µM Yoda1. Asterisks indicate standard p-value range: *, 0.01 < p < 0.05; **, 0.001 < p < 0.01; ***, 0.001 < p < 0.01 and n.s. (non-significant): p > 0.05
Fig. 3
Fig. 3
The Yoda1-insensitive A2094W mutant is mechanosensitive. a Example of pressure-elicited ionic current traces for mPZ1 WT and the A2094W mutant obtained in transfected ΔPZ1 cells clamped at −80 mV. For clarity, only few traces are shown. b Mean I/Imax values plotted for WT (n = 8) and the A2094W mutant (n = 6) for comparison. Data are collected from n cells. Lines correspond to curve fitting using a Boltzmann equation. Source data are provided as a Source Data file. Error bars = standard errors of mean values
Fig. 4
Fig. 4
Coupling between chemical activation pathways in Piezo1. ΔPZ1 cells were co-transfected with GC6 and one of the indicated A1718 and A2094 mutant construct or with GC6 only (control). The relative amplitude of calcium signals (ΔF/F0) obtained by application of 100 µM Yoda1 (a) or 1 mM Jedi2 (b) is shown as a dotted box plot. For statistical analysis, cells from at least three independent experiments were pooled and considered as independent points (n values between 12 and 877). The box upper and lower limits represent standard error of mean values (shown as horizontal inner lines). Source data are provided as a Source Data file. Comparison of the mean values between WT/mutants and control was done using two-tails t-tests. Asterisks indicate standard p-value range. *, 0.01 < p < 0.05; **, 0.00 1 < p < 0.01; ***, p < 0.001 and n.s. (non-significant): p > 0.05. Statistical results are only shown for mutants exhibiting ΔF/F0 larger than control conditions. For clarity, the number of analyzed cells is from (a) and (b) are plotted as function of the range of ΔF/F0 values obtained with 100 µM Yoda1 (c) or 1 mM Jedi2 (d) for each tested mutant (gray rectangle: A1718W, red circles: A1718G, blue triangles: A1718I, green triangles: A1718L, purple diamonds: A1718V, gold triangles: A2094D, cyan triangles: A2094F, brown hexagons: A2094V, olive stars: A2094W, orange pentagons: R2135A, blue spheres: control and green crosses: WT)
Fig. 5
Fig. 5
Yoda1 facilitates tension-induced arm motions. a RMSD for each Piezo1 arm along the full multi-ligand trajectory. b Trajectory snapshots of the Yoda1-bound subunit (arm 3) taken before (4.8 µs) or after (6.9 µs) stretch. c PCA representation of tilt motions. The green arrows indicate the direction of tilt motions along the stretch region of the trajectory. d Time evolution of tilt angle for each arm along the multi-ligand trajectory. e PCA representation of twist motions. The purple arrows indicate the direction of twist motions along the stretch region of the trajectory. f 2-dimensional projection of tilt and twist motions (represented as total Cα motion) colored as function of time during the stretch region of the trajectory. The 0 value in the tilt and twist axes represent the average position along the corresponding PCA motion
Fig. 6
Fig. 6
A molecular wedge mechanism for Yoda1-mediated Piezo1 activation. a In absence of membrane tension, the Piezo1 arm (blue) is in a “flexed” position (only one arm is represented for clarity). b In presence of a sub-threshold stimulus, the arm is slightly extended due to the flattening of the lipid bilayer but not enough to open the pore. c By binding between Repeat A (magenta) and the N-terminal part of the arm, Yoda1 acts like a wedge by decoupling these two domains, hence increasing tension-induced arm extension. This wedge-like effect ultimately leads to channel opening in the presence of sub-threshold stimuli. The mechanism by which the lever motion opens the channel gate is unknown

References

    1. Cahalan, S. M. et al. Piezo1 links mechanical forces to red blood cell volume. Elife4, 10.7554/eLife.07370 (2015). - PMC - PubMed
    1. Florez-Paz D, Bali KK, Kuner R, Gomis A. A critical role for Piezo2 channels in the mechanotransduction of mouse proprioceptive neurons. Sci. Rep. 2016;6:25923. doi: 10.1038/srep25923. - DOI - PMC - PubMed
    1. Woo SH, et al. Piezo2 is the principal mechanotransduction channel for proprioception. Nat. Neurosci. 2015;18:1756–1762. doi: 10.1038/nn.4162. - DOI - PMC - PubMed
    1. Wang Fan, Knutson Kaitlyn, Alcaino Constanza, Linden David R., Gibbons Simon J., Kashyap Purna, Grover Madhusudan, Oeckler Richard, Gottlieb Philip A., Li Hui Joyce, Leiter Andrew B., Farrugia Gianrico, Beyder Arthur. Mechanosensitive ion channel Piezo2 is important for enterochromaffin cell response to mechanical forces. The Journal of Physiology. 2016;595(1):79–91. doi: 10.1113/JP272718. - DOI - PMC - PubMed
    1. Gudipaty SA, et al. Mechanical stretch triggers rapid epithelial cell division through Piezo1. Nature. 2017;543:118–121. doi: 10.1038/nature21407. - DOI - PMC - PubMed

Publication types