. 2019 Oct;574(7777):200-205.
doi: 10.1038/s41586-019-1620-6. Epub 2019 Oct 2.

Dynamics and genomic landscape of CD8+ T cells undergoing hepatic priming

Affiliations

Dynamics and genomic landscape of CD8+ T cells undergoing hepatic priming

Alexandre P Bénéchet et al. Nature. 2019 Oct.

Abstract

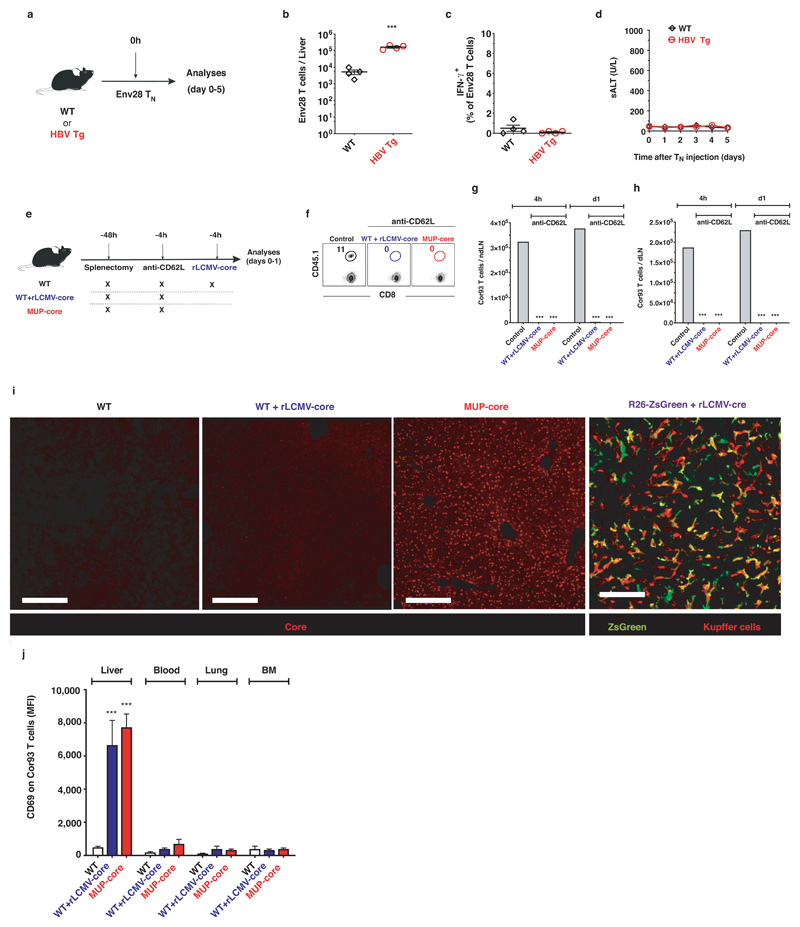
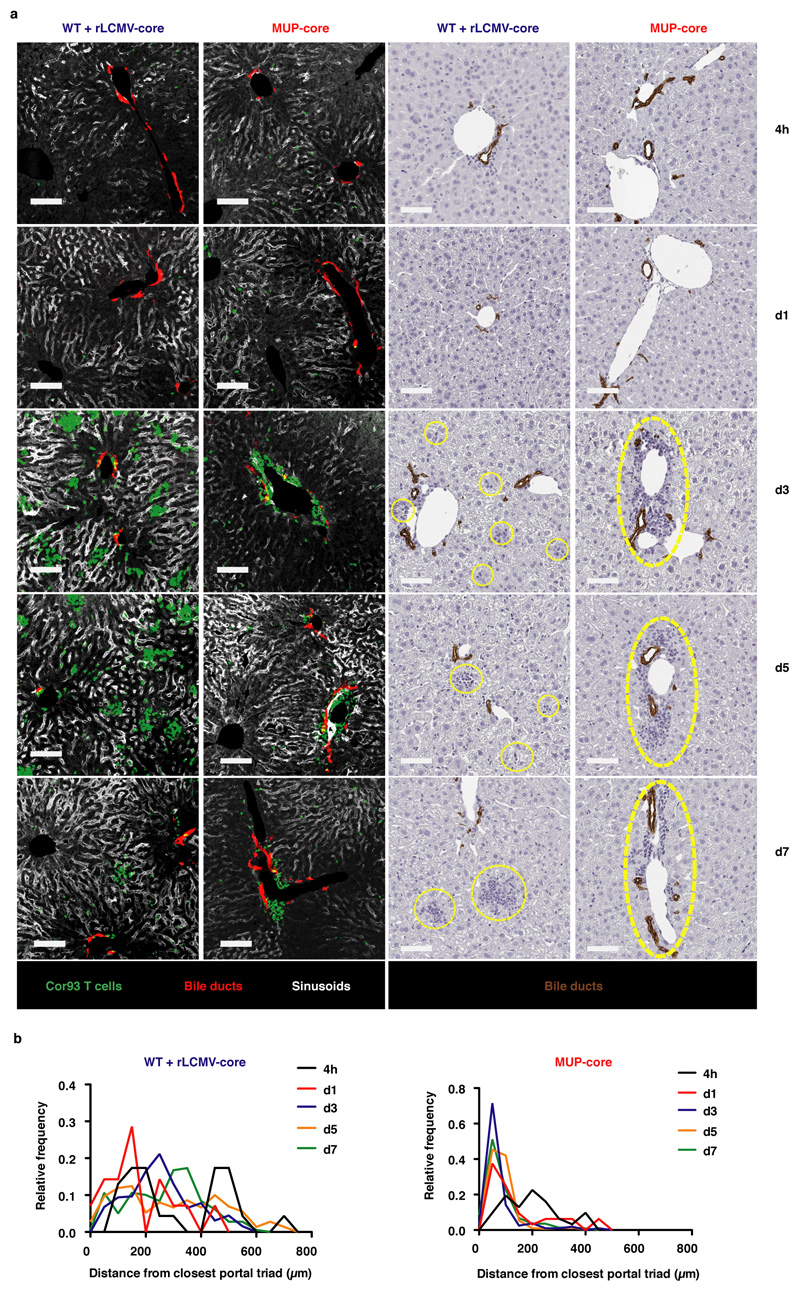
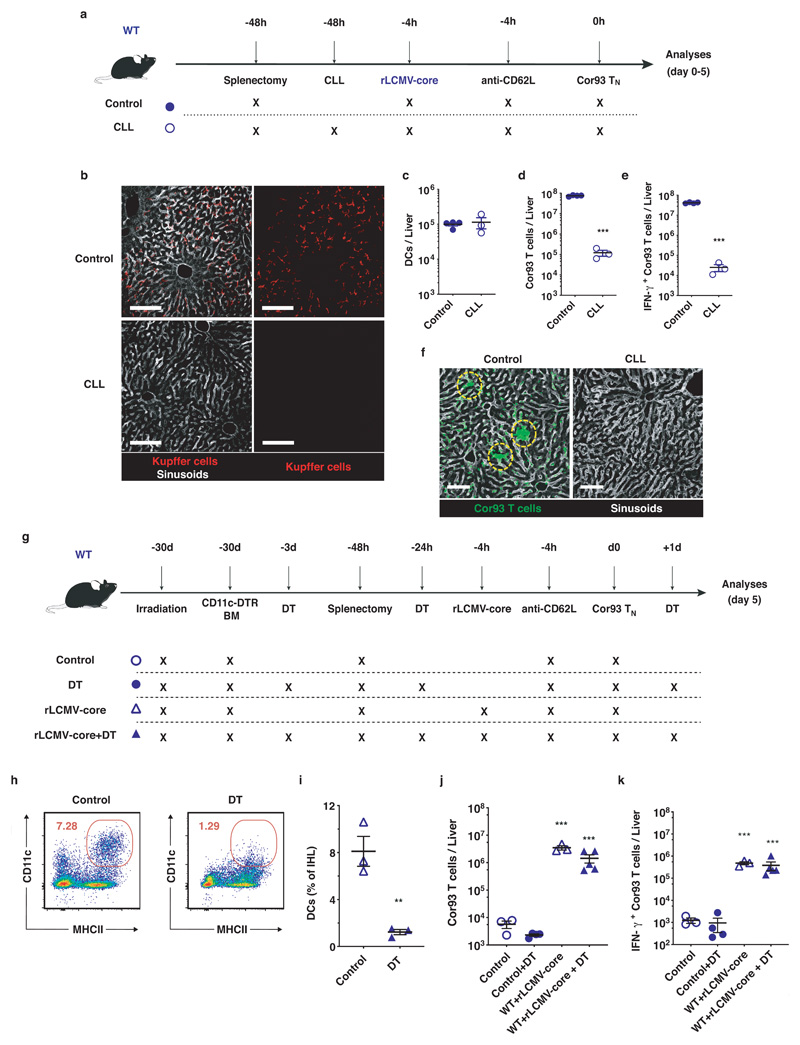
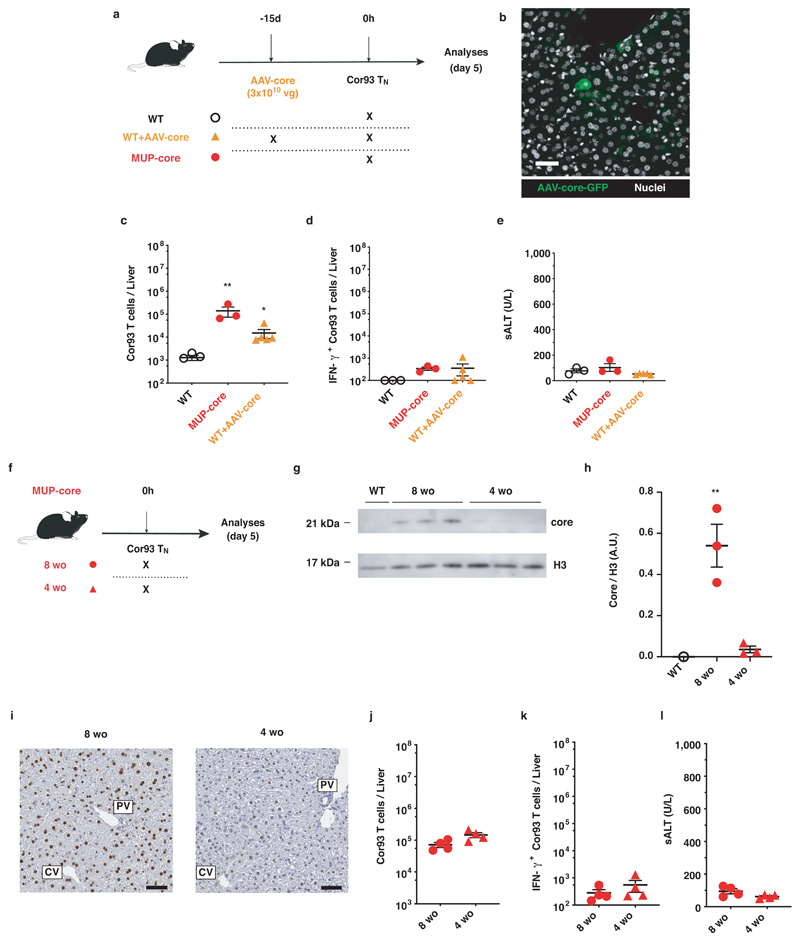
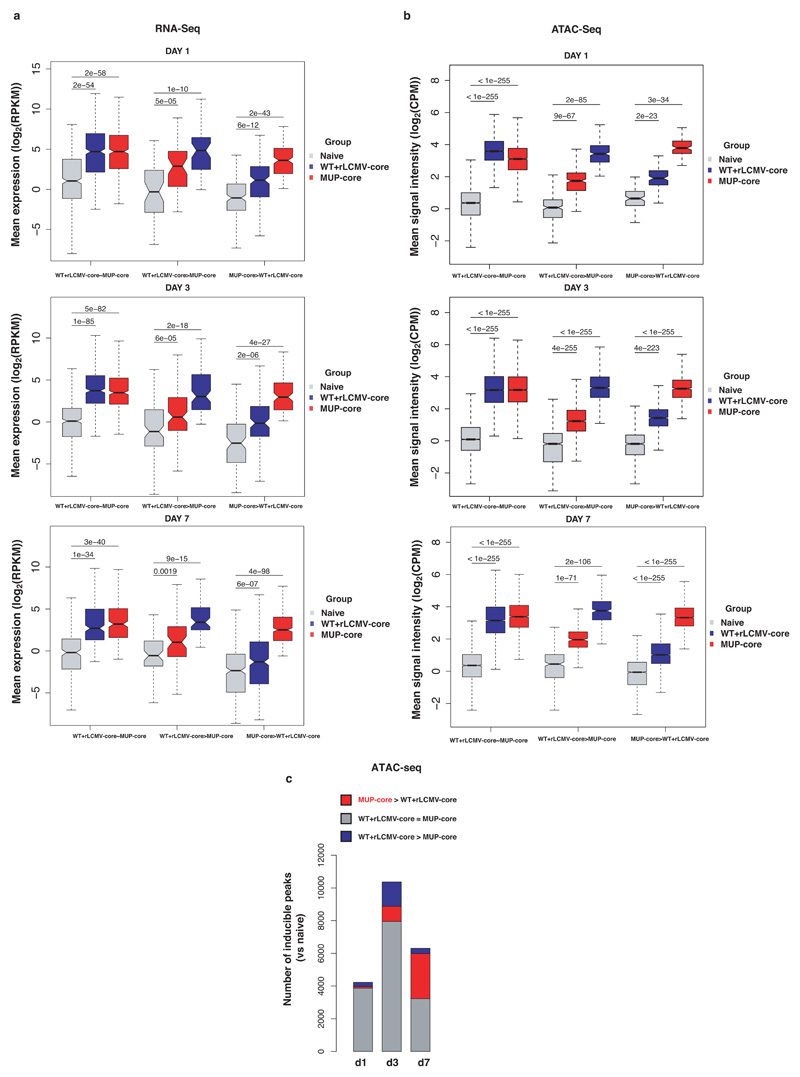
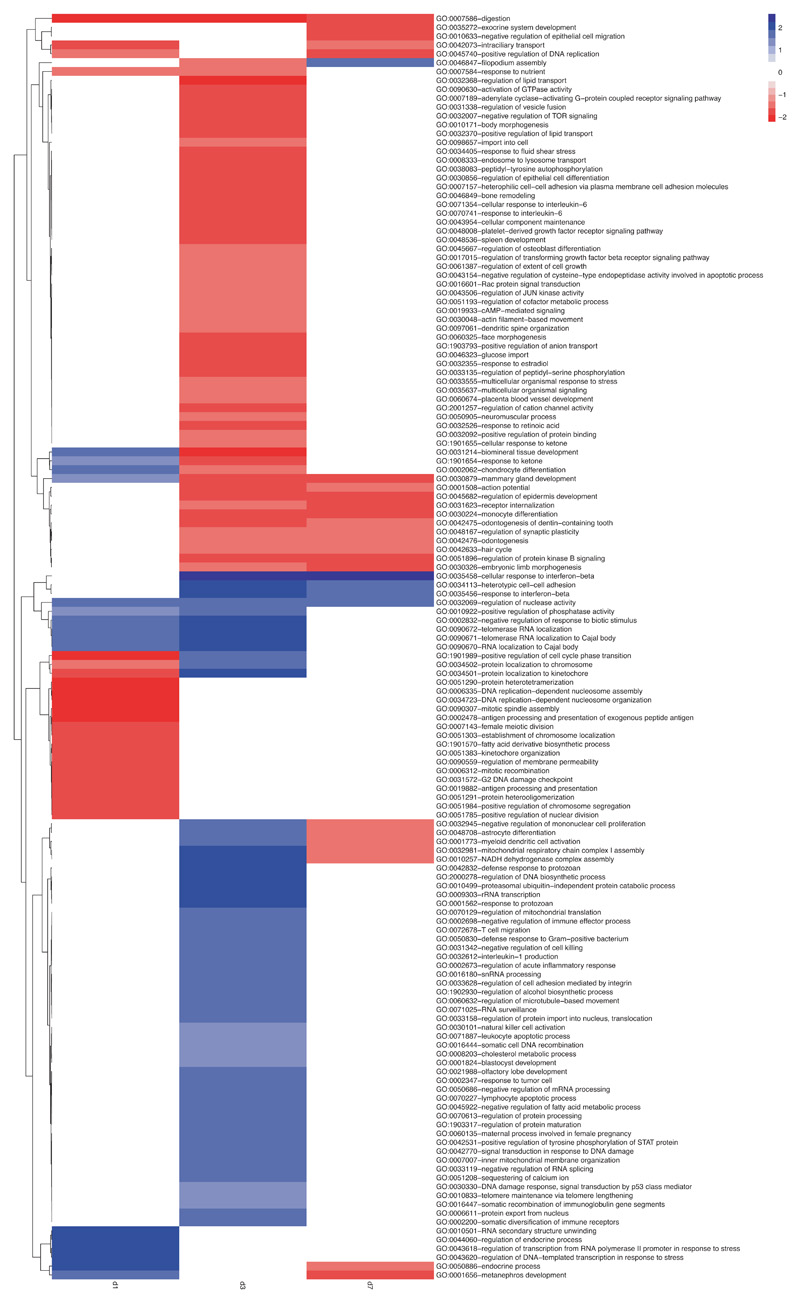
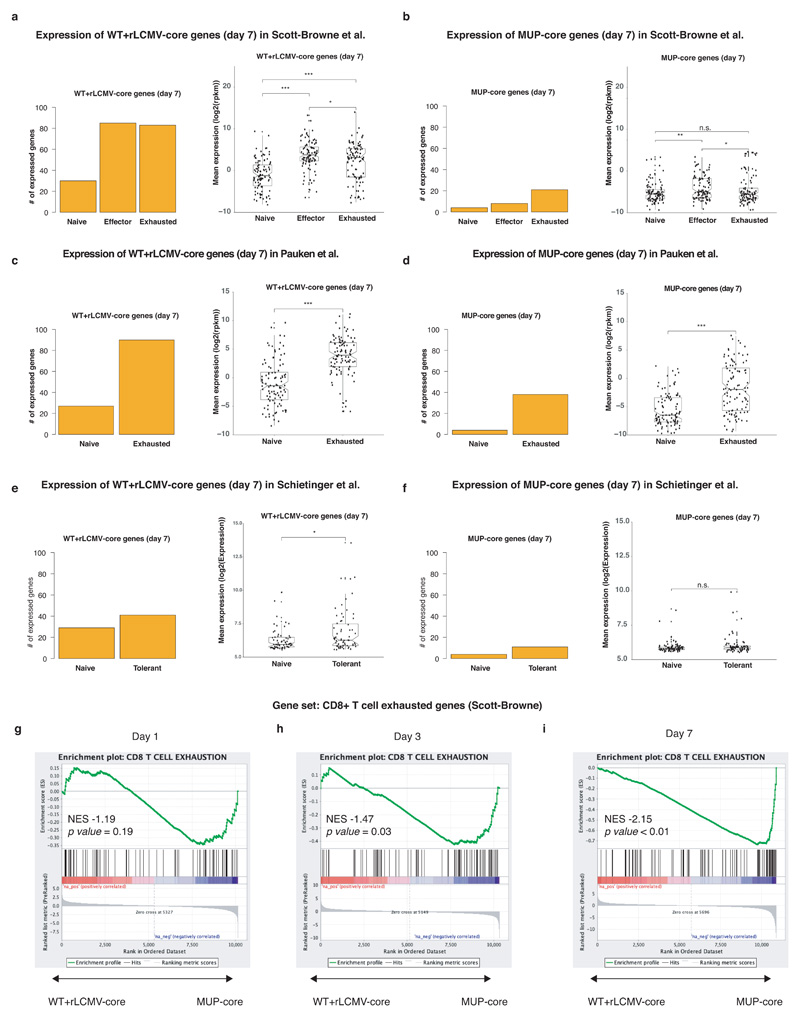
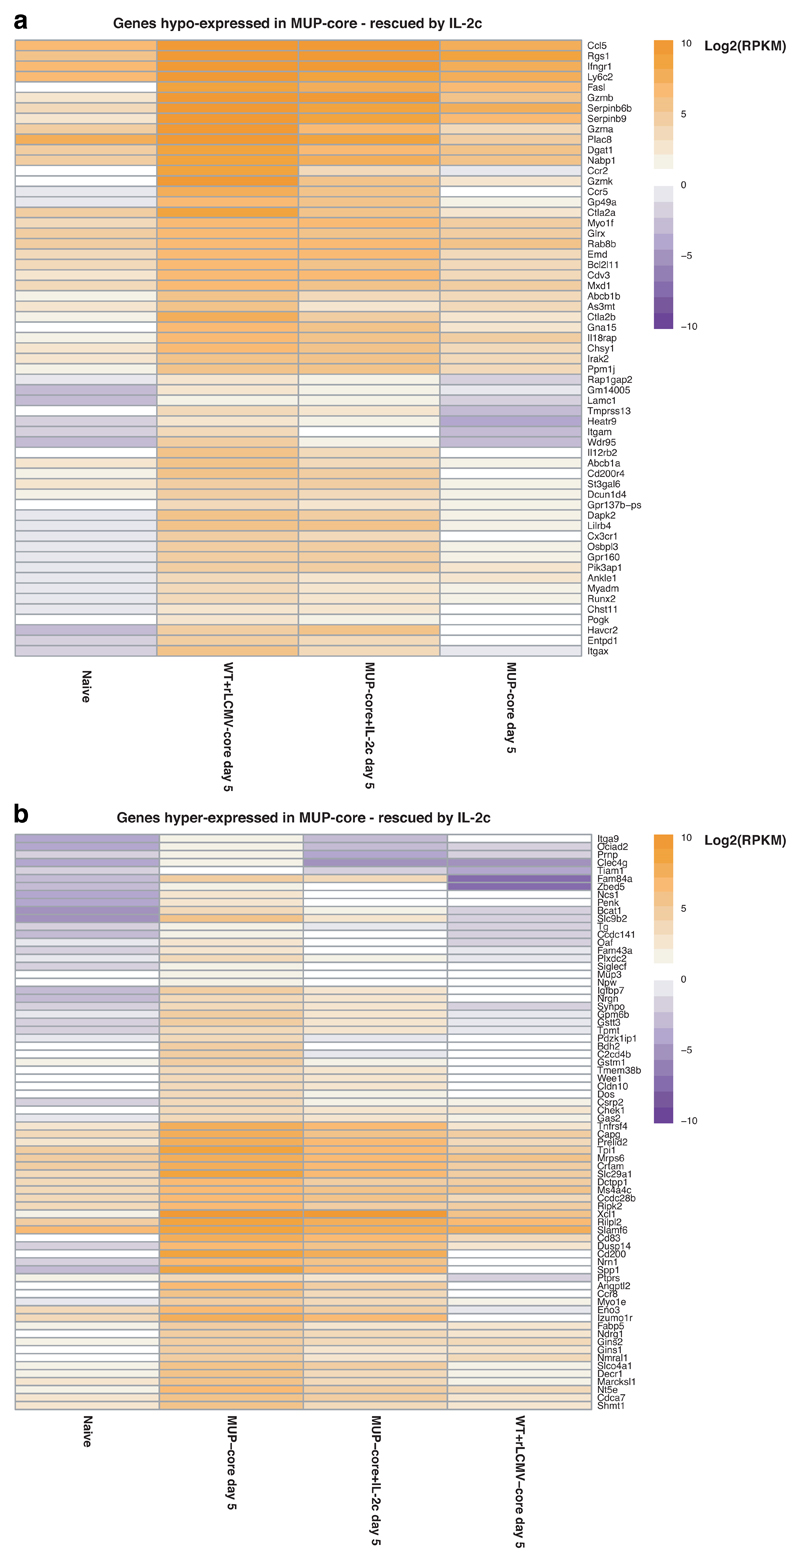
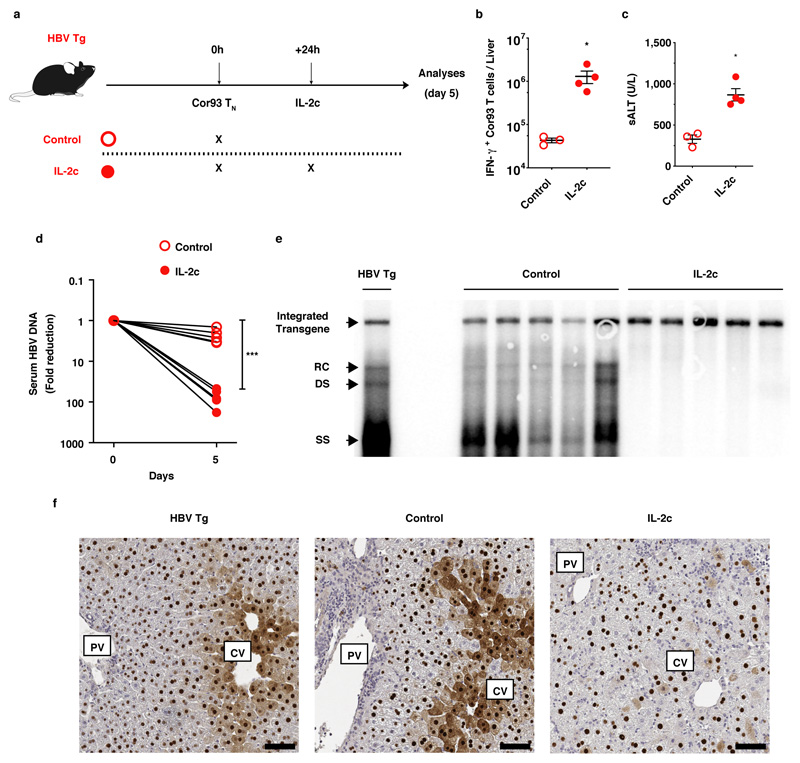
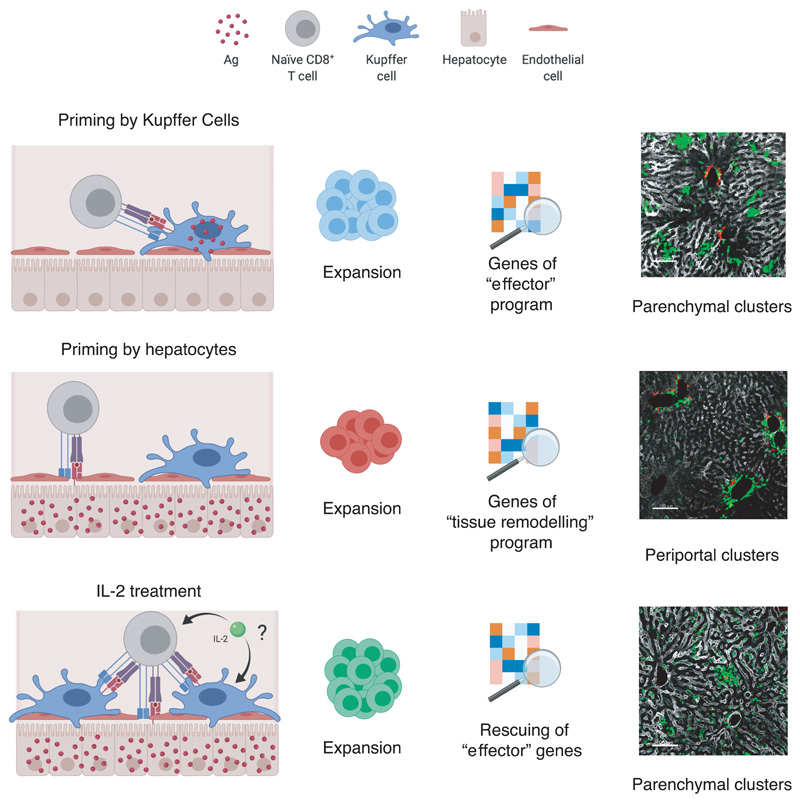
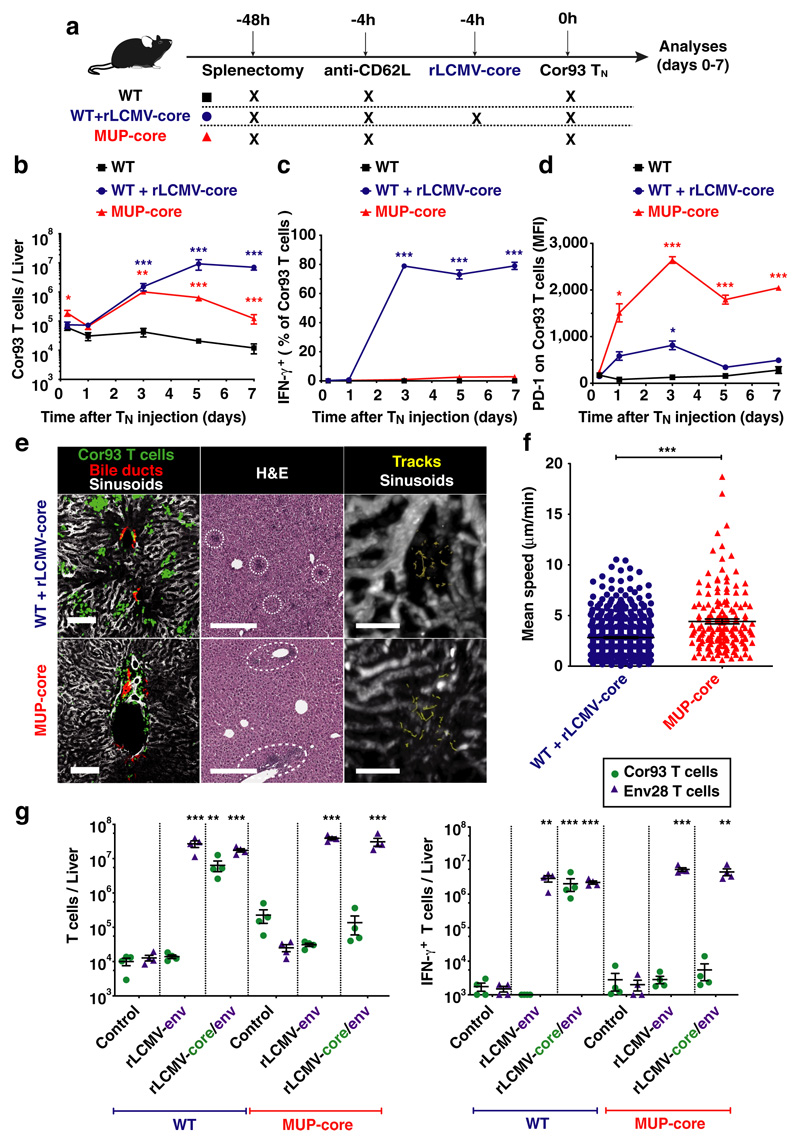
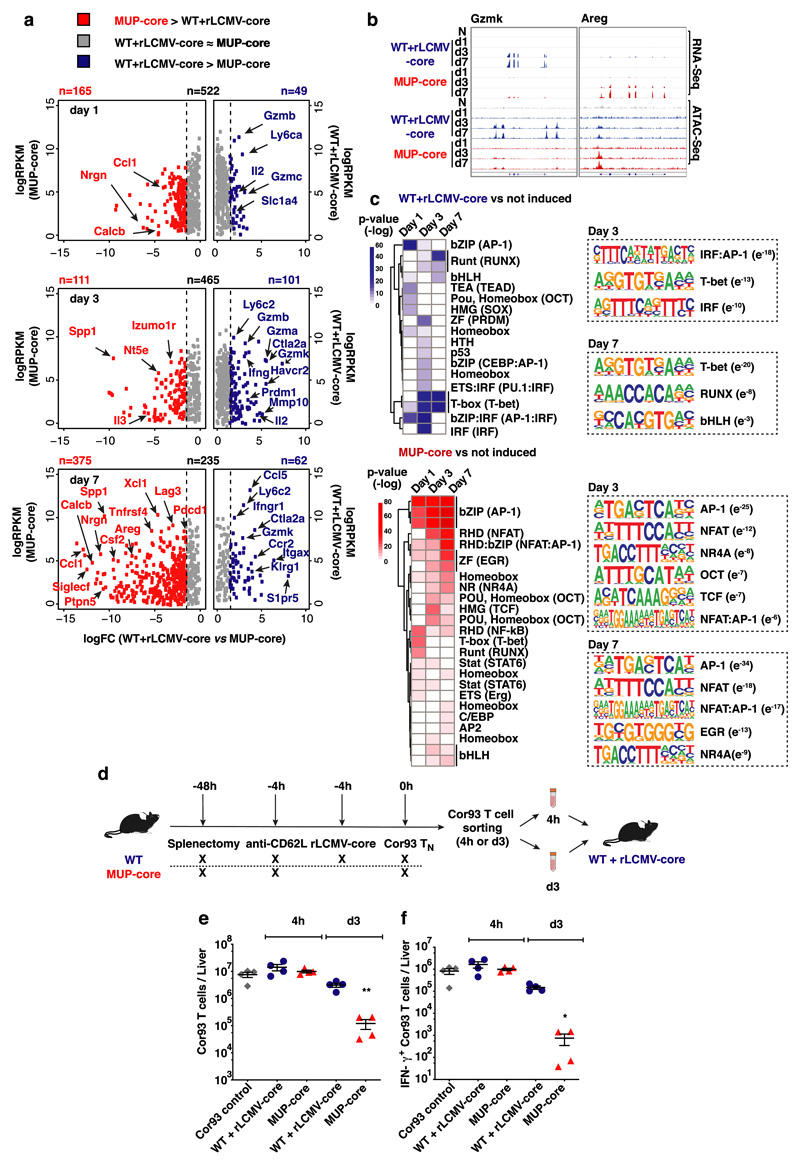
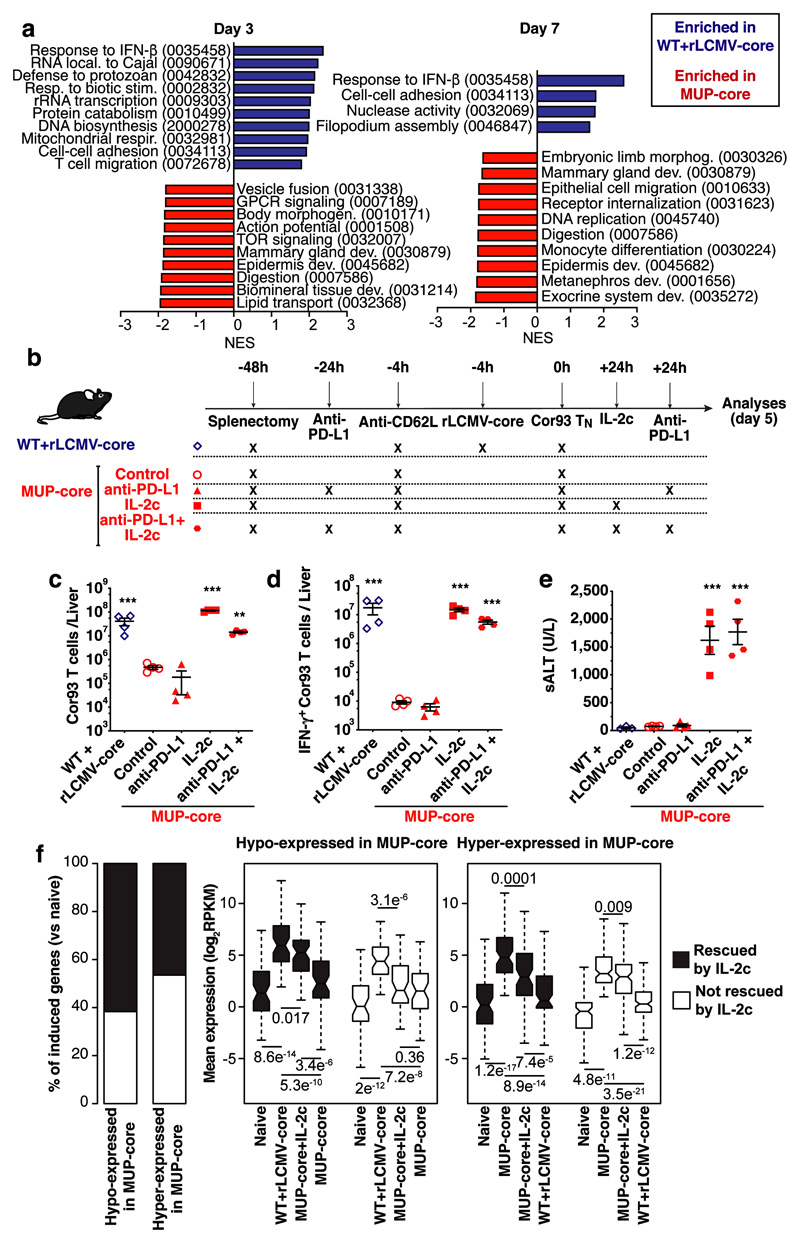
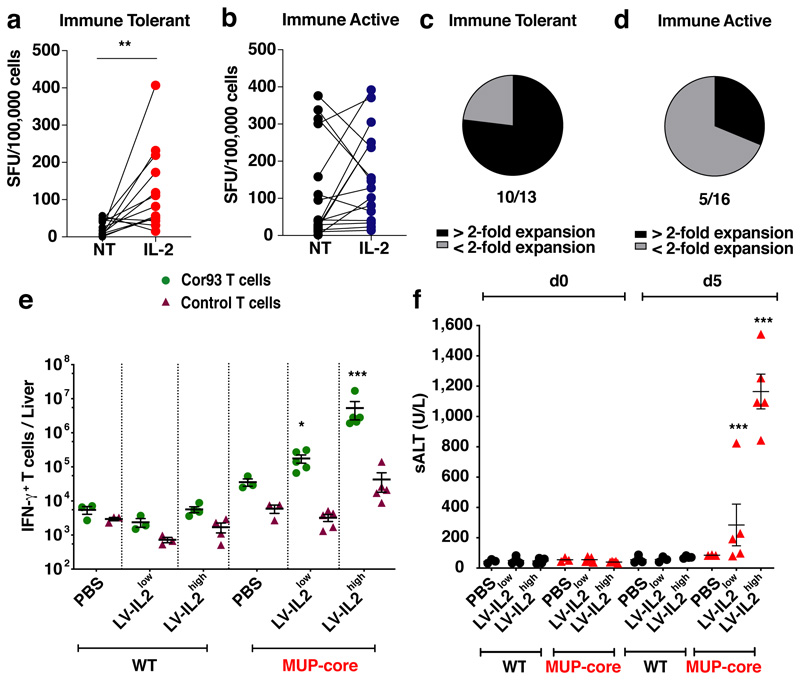
The responses of CD8+ T cells to hepatotropic viruses such as hepatitis B range from dysfunction to differentiation into effector cells, but the mechanisms that underlie these distinct outcomes remain poorly understood. Here we show that priming by Kupffer cells, which are not natural targets of hepatitis B, leads to differentiation of CD8+ T cells into effector cells that form dense, extravascular clusters of immotile cells scattered throughout the liver. By contrast, priming by hepatocytes, which are natural targets of hepatitis B, leads to local activation and proliferation of CD8+ T cells but not to differentiation into effector cells; these cells form loose, intravascular clusters of motile cells that coalesce around portal tracts. Transcriptomic and chromatin accessibility analyses reveal unique features of these dysfunctional CD8+ T cells, with limited overlap with those of exhausted or tolerant T cells; accordingly, CD8+ T cells primed by hepatocytes cannot be rescued by treatment with anti-PD-L1, but instead respond to IL-2. These findings suggest immunotherapeutic strategies against chronic hepatitis B infection.


Conflict of interest statement

The authors declare competing financial interest: M.I., L.G.G., R.O., A.C. and L.N. are inventors on patents filed, owned and managed by Telethon Foundation and San Raffaele Scientific Institute on LV technology related to the work presented in this manuscript. Readers are welcome to comment on the online version of the paper.

Figures

Extended Data Fig. 1
Extended Data Fig. 1. Naïve CD8+ T cells that recognize hepatocellular Ag are activated locally and expand, but fail to develop effector function.
(a) Schematic representation of the experimental setup. 5 x 10⁶ Env28 TN were transferred into C57BL/6 x Balb/c F1 (WT) or HBV replication-competent transgenic (HBV Tg, C57BL/6 x Balb/c F1) recipients. Livers were collected and analysed five days after Env28 TN transfer and sera from the same mice were collected every day from day 0 to day 5 after Env28 TN transfer. (b-c) Absolute numbers (b) and frequency of IFNγ-producing (c) Env28 T cells in the livers of the indicated mice. (d) ALT levels detected in the sera of the indicated mice at the indicated time points. n = 4. Results are expressed as mean ± SEM. Means among groups were compared with two-tailed t test (e) Schematic representation of the experimental setup. 5 x 10⁶ Cor93 TN were transferred into C57BL/6 (WT) or MUP-core recipients. Mice were splenectomized and treated with anti-CD62L 48 hours and 4 hours prior to cell transfer, respectively. Untreated WT mice that received 5 x 10⁶ Cor93 TN were used as controls. Where indicated, mice were injected with 2.5 x 10⁵ infectious units of non-replicating rLCMV-core 4 hours prior to Cor93 TN transfer. Liver-draining lymph nodes (dLN) and non-draining inguinal lymph nodes (ndLN) were collected at four hours and one day after Cor93 TN. (f) Representative flow cytometry plot at four hours upon Cor93 TN transfer. Numbers indicate the percentage of cells within the indicated gate. (g-h) Quantification of the absolute numbers of cells recovered from the ndLN (g) and dLN (h) of the indicated mice four hours and one day upon Cor93 TN transfer. n = 3. Results are expressed as mean ± SEM. Means among groups were compared with one-way ANOVA with Bonferroni post-test (i) Confocal immunofluorescence micrographs of liver sections from WT mice (WT), rLCMV-core-injected WT mice (WT + rLCMV-core), MUP-core mice and R26-ZsGreen mice injected with 2.5 x 10⁵ infectious units of non-replicating rLCMV-cre (R26-ZsGreen + rLCMV-cre). Scale bars represent 100 μm. Note that, because HBV core protein did not accumulate at detectable levels in KCs and hepatic dendritic cells [DCs] upon rLCMV-core injection, we confirmed the tropism of this vector by injecting rLCMV-cre into R26-ZsGreen mice – these mice express the fluorescent protein ZsGreen upon Cre-mediated recombination. (j) Mean Fluorescent Intensity (MFI) of CD69 expression on Cor93 T cells in the liver, blood, lung and bone marrow of the indicated mice four hours after Cor93 TN transfer. n = 4. Results are expressed as mean ± SEM. Means among groups were compared with one-way ANOVA with Bonferroni post-test. Data are representative of at least 3 independent experiments. *** p value < 0.001. Mouse drawings were adapted from reference .
Extended Data Fig. 2
Extended Data Fig. 2. Spatiotemporal dynamics of naïve CD8+ T cells upon intrahepatic priming.
5 x 10⁶ fluorescent Cor93 TN were transferred into MUP-core or rLCMV-core-injected WT recipients. Mice were splenectomized and treated with anti-CD62L 48 hours and 4 hours prior to Cor93 TN transfer, respectively. (a) (left panels) Confocal immunofluorescence micrographs of liver sections from the indicated mice at the indicated timepoints upon Cor93 TN transfer, showing the distribution of Cor93 T cells (green) relative to portal tracts (highlighted by anti-cytokeratin 7 Ab-mediated staining of bile ducts in red). Sinusoids are highlighted by anti-Lyve-1+ Abs (white). Scale bars represent 100 μm. (right panels) Immunohistochemical micrographs of liver sections from the indicated mice at the indicated timepoints upon Cor93 TN transfer, showing the distribution of leukocyte infiltrates relative to portal tracts (highlighted by anti-cytokeratin 7 Ab-mediated staining of bile ducts in brown). Scale bars represent 100 μm. (b) Distribution of the distances (μm) of each Cor93 T cell from the centre of the closest portal triad at the indicated timepoints. n = 3 mice. Data are representative of at least 3 independent experiments.
Extended Data Fig. 3
Extended Data Fig. 3. Kupffer cells, but not dendritic cells, promote CD8+ T cell effector differentiation upon rLCMV injection.
(a) Schematic representation of the experimental setup. 5 x 10⁶ Cor93 TN were transferred into C57BL/6 (WT) recipients. Mice were splenectomized and treated with anti-CD62L 48 hours and 4 hours prior to cell transfer, respectively and injected with 2.5 x 10⁵ infectious units of non-replicating rLCMV-core 4 hours prior to Cor93 TN transfer. Where indicated, mice were treated with clodronate liposomes (CLL) 48 hours prior to Cor93 TN transfer. (b) Confocal microscopy of liver sections from control mice (left panels) and clodronate liposomes-treated mice (right panels). Kupffer cells are depicted in red in all panels, while sinusoids are depicted in grey only in the first and third panel. Scale bars represent 100 μm. (c) Absolute numbers of CD11c+ MHC-IIhigh dendritic cells (DCs) in the livers of the indicated mice. (d-e) Absolute numbers of total (d) and of IFN-γ producing (e) Cor93 T cells in the livers of the indicated mice five days after Cor93 TN transfer. n = 4 (Control), 3 (CLL). Results are expressed as mean ± SEM. Means among groups were compared with two-tailed t test. (f) Confocal immunofluorescence micrographs of liver sections from the indicated mice five days after Cor93 TN transfer. Scale bars represent 100 μm. (g) Schematic representation of the experimental setup. WT mice were lethally irradiated and reconstituted with CD11c-DTR bone marrow (BM). 1 x 10⁶ Cor93 TN were transferred into recipients. Mice were injected with 2.5 x 10⁵ infectious units of non-replicating rLCMV-core 4 hours prior to Cor93 TN transfer. Indicated mice were treated with 400 ng of diphtheria toxin three days before, one day before and one day after T cell transfer. Livers were collected and analysed five days after Cor93 TN transfer. (h) Representative flow cytometry plots in the liver of control (left) or DT-treated (right) mice. (i) CD11c+ MHC-II+ DCs (expressed as percentage of the total intrahepatic leukocyte population, IHL) in the livers of the indicated mice. n = 3. Results are expressed as mean ± SEM. Means among groups were compared with two-tailed t test. (j-k) Absolute numbers of total (j) and of IFN-γ-producing (k) Cor93 T cells in the livers of the indicated mice five days after Cor93 TN transfer. n = 3 (Control and WT + rLCMV-core), 4 (Control + DT), 5 (WT + rLCMV-core + DT). Results are expressed as mean ± SEM. Means among groups were compared with one-way ANOVA with Bonferroni post-test. Data are representative of 3 independent experiments. ** p value < 0.01, *** p value < 0.001. Mouse drawings were adapted from reference .
Extended Data Fig. 4
Extended Data Fig. 4. A strong reduction in the levels of hepatocellular core Ag expression is per se not sufficient to induce effector differentiation.
(a) Schematic representation of the experimental setup. 1 x 10⁶ Cor93 TN were transferred into C57BL/6 (WT) or MUP-core recipients. Indicated WT mice were injected with 3 x 10¹⁰ viral genomes of AAV-core 15 days prior to Cor93 TN transfer. Livers were collected and analysed five days after Cor93 TN transfer. (b) Representative confocal immunofluorescence micrographs of a liver section from an AAV-core injected mouse 15 days after virus injection. Transduced hepatocytes are depicted in green and nuclei in grey. Scale bar represents 50 μm. n = 3 mice. (c-e) Absolute numbers of total (c) and of IFN-γ-producing (d) Cor93 T cells in the livers of the indicated mice five days after Cor93 TN transfer. (e) ALT levels detected in the sera of the indicated mice. n = 3 (WT and MUP-core), 5 (AAV-core). Results are expressed as mean ± SEM. Means among groups were compared with one-way ANOVA with Bonferroni post-test. (f) Schematic representation of the experimental setup. 1 x 10⁶ Cor93 TN were transferred into 8-week-old (8 wo) or 4-week-old (4 wo) MUP-core mice. Livers were collected and analysed five days after Cor93 TN transfer. (g) HBcAg expression in the livers of the indicated mice was analysed by Western Blotting (WB). (h) Quantification of the WB shown in C. Core expression, normalized to the housekeeping nuclear protein H3, is expressed as arbitrary units (A.U.). n=1 (WT), 3 (MUP-core 8wo and MUP-core 4wo). Results are expressed as mean ± SEM. Means among groups were compared with two-tailed t test. (i) Immunohistochemical micrographs of liver sections from the indicated mice, showing core Ag expression (brown). Scale bars represent 50 μm. PV, portal vein; CV, central vein. n = 3 mice. (j-k) Absolute numbers of total (j) and of IFN-γ-producing (k) Cor93 T cells in the livers of the indicated mice five days after Cor93 TN transfer. n = 4. Results are expressed as mean ± SEM. Means among groups were compared with two-tailed t test. (l) ALT levels detected in the sera of the indicated mice. n = 4. Results are expressed as mean ± SEM. Means among groups were compared with two-tailed t test. Data are representative of 2 independent experiments. * p value < 0.05, ** p value < 0.01. Mouse drawings were adapted from reference .
Extended Data Fig. 5
Extended Data Fig. 5. Genomic landscape of naïve CD8+ T cells undergoing intrahepatic priming.
(a) Box plots showing expression levels (log2RPKM) in the indicated experimental condition of genes belonging to the categories described in Fig. 2A. Results of two-sided Mann-Whitney U test are shown for the indicated comparisons. The midline of the box plot represents the median; lower and upper limits of the box plot represent the first and third quartile, respectively. Whiskers extend up to 1,5 times the interquartile range from the top and the bottom of the box plot. Sample size: naïve (n = 2), WT+rLCMV-core (n = 3), MUP-core (day1 and day3, n = 2; day7, n = 3). (b) Box plots showing ATAC-seq signal intensity (log2CPM) in the indicated experimental condition of peaks belonging to the categories described in Fig. 2C. Results of two-sided Mann-Whitney U test are shown for the indicated comparisons. The midline of the box plot represents the median; lower and upper limits of the box plot represent the first and third quartile, respectively. Whiskers extend up to 1,5 times the interquartile range from the top and the bottom of the box plot. Sample size: naïve (n = 2), WT+rLCMV-core (day 1 and day 7, n = 2; day 3, n = 3), MUP-core (day1 and day3, n = 2; day7, n = 3). (c) Bar plot showing the number of inducible ATAC-seq peaks (logFCCPM > 2.5, FDR < 0.001 versus Cor93 TN) in the indicated conditions. ATAC-seq peaks with higher intensity signal in Cor93 T cells from WT + rLCMV-core (logFCCPM > 1.5, FDR < 0.1) or from MUP-core mice (logFCCPM < -1.5, FDR < 0.1) are shown in blue and red, respectively. Differences in peak signal intensities were evaluated fitting a negative binomial generalized linear model on the dataset and then performing a quasi-likelihood (QL) F-test. The Benjamini-Hochberg procedure was applied in order to correct for multiple tests. Sample size: naïve (n=2), WT+rLCMV-core (day 1 and day 7, n = 2; day 3, n = 3), MUP-core (day1 and day3, n = 2; day7, n = 3).
Extended Data Fig. 6
Extended Data Fig. 6. Gene ontology analysis of intrahepatically primed CD8+ T cells.
Heatmap showing the NES value associated to the seed GO categories (identified by REVIGO) found enriched in the indicated time points by GSEA. Colour legends indicate NES, with positive values (in blue) reflecting enrichment of GOs in hepatic CD8+ T cells isolated from WT mice injected with rLCMV-core mice, and negative values (in red) reflecting enrichment of GOs in hepatic CD8+ T cells isolated from MUP-core mice.
Extended Data Fig. 7
Extended Data Fig. 7. While priming by hepatocytes initiates a unique dysfunctional program, hepatocellular Ag persistence may gradually trigger an additional exhaustion signature.
(a) Number (left panel) of top 100 genes from Cor93 T cells recovered from WT + rLCMV-core livers reaching log2RPKM>1 in the indicated conditions in RNA-seq data from splenic LCMV-specific effector or exhausted CD8+ T cells (ref.). Box plot (right panel) showing the expression levels of top 100 genes from Cor93 T cells recovered from WT + rLCMV-core livers in the indicated conditions in RNA-seq data from splenic LCMV-specific effector or exhausted CD8+ T cells (ref.) [two-tailed Wilcoxon Rank Sum Test: (*) p-value ≤ 0.05; (**) p-value ≤ 0.01; (***) p-value ≤ 0.001; (n.s.) Not Significant]. For each boxplot the median (horizontal line), the upper quartile and the lower quartile (straight lines) outside the interquartile range are reported. Dots represent the expression distribution of the set of 100-genes. Sample size: naïve (n = 2), effector (n = 2), exhausted (n = 2). (b) Number (left panel) of top 100 genes from Cor93 T cells recovered from MUP-core mice reaching log2RPKM>1 in the indicated conditions in RNA-seq data from splenic LCMV-specific effector or exhausted CD8+ T cells (ref.). Box plot (right panel) showing the expression levels of top 100 genes from Cor93 T cells recovered from MUP-core mice in the indicated conditions in RNA-seq data from ref [two-tailed Wilcoxon Rank Sum Test: (*) p-value ≤ 0.05; (**) p-value ≤ 0.01; (***) p-value ≤ 0.001; (n.s.) Not Significant)]. For each boxplot the median (horizontal line), the upper quartile and the lower quartile (straight lines) outside the interquartile range are reported. Dots represent the expression distribution of the set of 100-genes. Sample size: naïve (n = 2), effector (n = 2), exhausted (n = 2). (c) Number (left panel) of top 100 genes in Cor93 T cells isolated from WT + rLCMV-core livers reaching log2RPKM>1 in the indicated conditions in RNA-seq data from splenic LCMV-specific exhausted CD8+ T cells from ref.. Box plot (right panel) showing the expression levels of top 100 genes in Cor93 T cells isolated from WT + rLCMV-core livers in the indicated conditions in RNA-seq data from splenic LCMV-specific exhausted CD8+ T cells from ref. [two-tailed Wilcoxon Rank Sum Test: (*) p-value ≤ 0.05; (**) p-value ≤ 0.01; (***) p-value ≤ 0.001; (n.s.) Not Significant)]. For each boxplot the median (horizontal line), the upper quartile and the lower quartile (straight lines) outside the interquartile range are reported. Dots represent the expression distribution of the set of 100-genes. Sample size: naïve (n = 2), exhausted (n = 3). (d) Number (left panel) of top 100 genes from Cor93 T cells recovered from MUP-core mice reaching log2RPKM>1 in the indicated conditions in RNA-seq data from splenic LCMV-specific exhausted CD8+ T cells from ref.. Box plot (right panel) showing the expression levels of top 100 genes from Cor93 T cells recovered from MUP-core mice in the indicated conditions in RNA-seq data from splenic LCMV-specific exhausted CD8+ T cells from ref. [two-tailed Wilcoxon Rank Sum Test: (*) p-value ≤ 0.05; (**) p-value ≤ 0.01; (***) p-value ≤ 0.001; (n.s.) Not Significant)]. For each boxplot the median (horizontal line), the upper quartile and the lower quartile (straight lines) outside the interquartile range are reported. Dots represent the expression distribution of the set of 100-genes. Sample size: naïve (n = 2), exhausted (n = 3). (e) Number (left panel) of top 100 genes in Cor93 T cells isolated from WT + rLCMV-core livers expressed (log2(normalized data) > 65th percentile of the full distribution) in the indicated conditions in microarray data from tolerant self-Ag-specific CD8+ T cells from ref.. Box plot (right panel) showing the expression levels of genes retrieved in the dataset among the top 100 genes in Cor93 T cells isolated from WT + rLCMV-core livers in the indicated conditions in microarray data from tolerant self-Ag-specific CD8+ T cells from ref.. Only genes for which microarray probes were retrieved were kept for these analyses. [two-tailed Wilcoxon Rank Sum Test: (*) p-value ≤ 0.05; (**) p-value ≤ 0.01; (***) p-value ≤ 0.001; (n.s.) Not Significant)]. For each boxplot the median (horizontal line), the upper quartile and the lower quartile (straight lines) outside the interquartile range are reported. Dots represent the expression distribution of the set of 100-genes. Sample size: naïve (n = 3), tolerant (n = 3). (f) Number (left panel) of top 100 genes from Cor93 T cells recovered from MUP-core mice expressed (log2(normalized data) > 65th percentile of the full distribution) in the indicated conditions in microarray data from tolerant self-Ag-specific CD8+ T cells from ref.. Box plot (right panel) showing the expression levels of genes retrieved in the dataset among the top 100 genes from Cor93 T cells recovered from MUP-core mice in the indicated conditions in microarray data from tolerant self-Ag-specific CD8+ T cells from ref.. Only genes for which microarray probes were retrieved were kept for these analyses. [two-tailed Wilcoxon Rank Sum Test: (*) p-value ≤ 0.05; (**) p-value ≤ 0.01; (***) p-value ≤ 0.001; (n.s.) Not Significant)]. For each boxplot the median (horizontal line), the upper quartile and the lower quartile (straight lines) outside the interquartile range are reported. Dots represent the expression distribution of the set of 100-genes. Sample size: naïve (n = 3), tolerant (n = 3). (g-i) Enrichment plot showing the results of a GSEAPreanked analysis (Kolmogorow-Smirnov statistics) performed on genes expressed in CD8+ T cells from WT + rLCMV-core or MUP-core mice (gene lists ranked by logFCRPKM) and using as gene set a curated list of genes induced in exhausted CD8+ T cells (n = 2) but not in effector CD8+ T cells (n = 2) as compared to naïve cells (n = 2) (ref.). NES and FDR values are reported for each time point.
Extended Data Fig. 8
Extended Data Fig. 8. IL-2c substantially rescues the transcriptional program of dysfunctional CD8+ T cells.
(a-b) Heatmap showing expression values (log2RPKM) of genes hypo-expressed (a) or hyper-expressed (b) in Cor93 CD8+ T cells from MUP-core livers at day 5, which are rescued by IL-2c.
Extended Data Fig. 9
Extended Data Fig. 9. Therapeutic restoration of intrahepatically-primed, dysfunctional CD8+ T cells by IL-2.
(a) Schematic representation of the experimental setup. 1 x 10⁶ Cor93 TN were transferred into HBV replication-competent transgenic (HBV Tg) mice. Indicated HBV Tg mice received IL-2c treatment one day after CD8+ T cell transfer. Livers were collected and analysed five days after Cor93 TN transfer. Sera were collected right before and five days after Cor93 TN transfer. (b) Absolute numbers of IFN-γ-producing Cor93 T cells in the livers of the indicated mice. n = 3 (Control), 4 (IL-2c). Results are expressed as mean ± SEM. Means among groups were compared with two-tailed t test. (c) ALT levels detected in the sera of the indicated mice. n = 3 (Control), 4 (IL-2c). Results are expressed as mean ± SEM. Means among groups were compared with two-tailed t test. (d) HBV DNA quantification (expressed as fold reduction over pre-treatment levels) in sera of the indicated mice prior to and five days after Cor93 TN transfer. n = 5. Results are expressed as mean ± SEM. Means among groups were compared with two-tailed t test. (e) HBV DNA quantification by Southern Blot analysis in the liver of the indicated mice. Bands corresponding to the expected size of the integrated transgene, relaxed circular (RC), double-stranded linear (DS), and single-stranded (SS) HBV DNAs are indicated. n = 5. (f) Representative immunohistochemical micrographs of liver sections from the indicated mice showing HBV core Ag expression (brown). Scale bars represent 100 μm. PV, portal vein; CV, central vein. n = 5 mice. Data are representative of at least 2 independent experiments. * p value < 0.05, *** p value < 0.001. Mouse drawings were adapted from reference .
Extended Data Fig. 10
Extended Data Fig. 10. Graphical abstract summarizing the paper’s main findings.
(Top panels) Priming by Kupffer cells – that are not natural targets of HBV – leads to differentiation into bona fide effector cells that form dense, extravascular clusters of rather immotile cells scattered throughout the liver. (Middle panels) Priming by hepatocytes – the natural targets of HBV - leads to local activation and proliferation but lack of differentiation into effector cells; these dysfunctional cells express a unique set of genes including some belonging to GO categories linked to tissue remodelling and they form loose, intravascular clusters of motile cells that coalesce around portal tracts. (Bottom panels) CD8+ T cells primed by hepatocytes can be rescued by IL-2 treatment.
Fig. 1
Fig. 1. Spatiotemporal dynamics of naïve CD8+ T cells undergoing intrahepatic priming.
(a) Schematic representation of the experimental setup. (b) Absolute numbers of Cor93 T cells in the livers of indicated mice at indicated time points. (c) Frequency of IFN-γ-producing Cor93 T cells in the livers of indicated mice at indicated time points. (d) MFI of PD-1 expression on Cor93 T cells in the livers of indicated mice. (e) (Left panels) Representative confocal immunofluorescence micrographs of liver sections from WT + rLCMV-core (upper panels) or from MUP-core mice (lower panels) three days after Cor93 TN transfer. Distribution of Cor93 T cells (green) relative to portal tracts (red). Sinusoids are in white. Scale bars represent 100 μm. (Middle panels) H&E staining of liver sections from the same mice, where dotted lines denote leukocyte clusters. Scale bars represent 300 μm. (Right panels) Snapshots from representative intravital multiphoton microscopy movies of the same mice. Cor93 T cells tracks are in yellow and blood vessels are in white. Scale bars represent 40 μm. (f) Mean speed of Cor93 T cells in the livers of indicated mice. (g) Cor93 and Env28 naïve CD8+ T cells were co-transferred into splenectomized and anti-CD62L-treated C57BL/6 x Balb/c F1 (WT) or MUP-core x Balb/c F1 (MUP-core) recipients. When indicated, mice were injected with rLCMV-env or rLCMV-core/env. Livers were collected and analysed five days after T cell transfer. Total numbers (left) and numbers of IFN-γ-producing (right) Cor93 and Env28 T cells in the livers of indicated mice.
Fig. 2
Fig. 2. Transcriptomic and chromatin accessibility analyses of CD8+ T cells undergoing intrahepatic priming.
(a) Scatter plot showing the level (y axis) and the difference in expression (x axis) of inducible genes in the dataset (versus Cor93 TN) in the indicated conditions. Genes expressed at higher levels in WT + rLCMV-core or MUP-core mice are shown in blue or red, respectively. (b) Integrative Genomics Viewer (IGV) snapshots showing RNA-seq and ATAC-seq data at Gzmk and Areg loci, selected as representative genes with differential expression in WT + rLCMV-core or MUP-core mice, respectively. (c) Left panels. Heatmap showing the enrichment of DNA motifs (HOMER) within the top 200 inducible (versus Cor93 TN) and differential ATAC-Seq peaks in WT + rLCMV-core (blue) or MUP-core mice (red). A set of 3899 non-inducible ATAC-seq peaks was used as background. Right panels. Selected enriched motifs and putative cognate transcription factors in ATAC-Seq peaks from WT + rLCMV-core (top) or MUP-core (bottom) mice. Values between brackets indicates p-value. (d) Schematic representation of the experimental setup. (e-f) Total numbers (e) and numbers of IFN-γ-producing (f) Cor93 T cells in the livers of the indicated mice.
Fig. 3
Fig. 3. Intrahepatically-primed, dysfunctional CD8+ T cells can be rescued by IL-2, but not by anti-PD-L1 Abs.
(a) Normalized enrichment score (NES) of selected GO categories enriched within genes expressed at higher levels in WT + rLCMV-core (blue) or from MUP-core (red) mice at the indicated time points. GO categories were identified by GSEA and grouped by similarity with REVIGO. (b) Schematic representation of the experimental setup. (c-d) Total numbers (c) and numbers of IFN-γ-producing (d) Cor93 T cells in the livers of the indicated mice. (e) ALT levels in the sera of the indicated mice. (f) Left panel. Stacked bar plot showing the effect of IL-2c on genes induced at day 5 (versus naïve) in Cor93 T cells from WT + rLCMV-core or MUP-core mice. Genes hypo-expressed or hyper-expressed in MUP-core mice as compared to WT + rLCMV-core mice are shown separately. Right panels. Box plots showing expression levels of hypo-expressed (left) or hyper-expressed (right) genes at day 5 in the indicated conditions. Genes the expression of which is rescued or not rescued in MUP-core+IL2c mice are shown in black or white, respectively.
Fig. 4
Fig. 4. Therapeutic potential of IL-2 treatment for T cell restoration during chronic HBV infection.
(a-d) HBV-specific T cell frequency from 13 Immune Tolerant (IT, a) and 16 Immune Active (IA, b) chronic HBV patients (Supplementary Table 10) cultured with or without IL-2. The percentage of IT (c) and IA patients (d) for which the HBV-specific T cell expansion increased by more than 2-fold with addition of IL-2 during the culture are shown in black. (e) Absolute numbers of IFN-γ-producing T cells in the livers of the indicated mice. (f) Serum ALT levels at day 0 and day 5 in the same mice.

References

    1. Sironi L, et al. In vivo flow mapping in complex vessel networks by single image correlation. Sci Rep. 2014;4:7341. - PMC - PubMed
    1. Warren A, et al. T lymphocytes interact with hepatocytes through fenestrations in murine liver sinusoidal endothelial cells. Hepatology. 2006;44:1182–1190. - PubMed
    1. Guidotti LG, et al. Immunosurveillance of the liver by intravascular effector CD8(+) T cells. Cell. 2015;161:486–500. - PMC - PubMed
    1. Wong YC, Tay SS, McCaughan GW, Bowen DG, Bertolino P. Immune outcomes in the liver: Is CD8 T cell fate determined by the environment? J Hepatol. 2015;63:1005–1014. - PubMed
    1. Holz LE, et al. Naïve CD8 T cell activation by liver bone marrow-derived cells leads to a ‘neglected’ IL-2low Bimhigh phenotype, poor CTL function and cell death. J Hepatol. 2012;57:830–836. - PubMed

MeSH terms