

Quantification of food waste per product group along the food supply chain in the European Union: a mass flow analysis
- PMID: 31582876
- PMCID: PMC6703187
- DOI: 10.1016/j.resconrec.2019.06.011
Quantification of food waste per product group along the food supply chain in the European Union: a mass flow analysis
Abstract
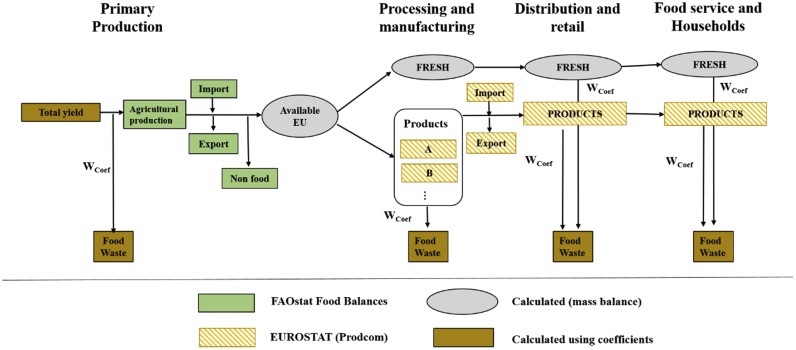
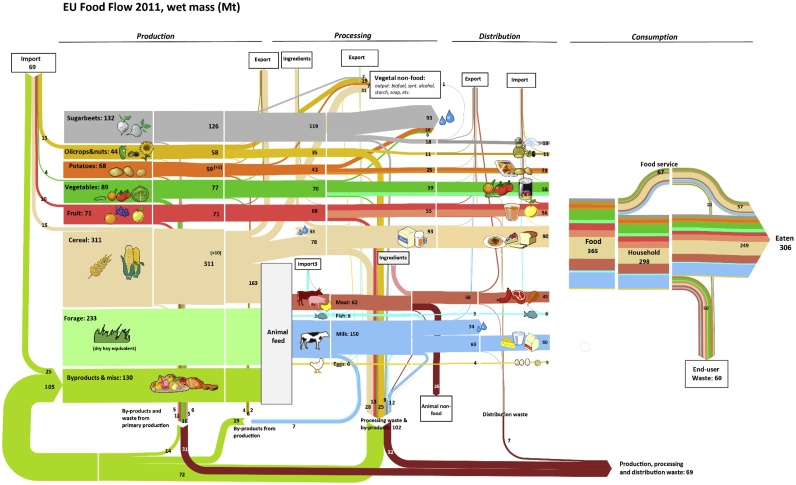
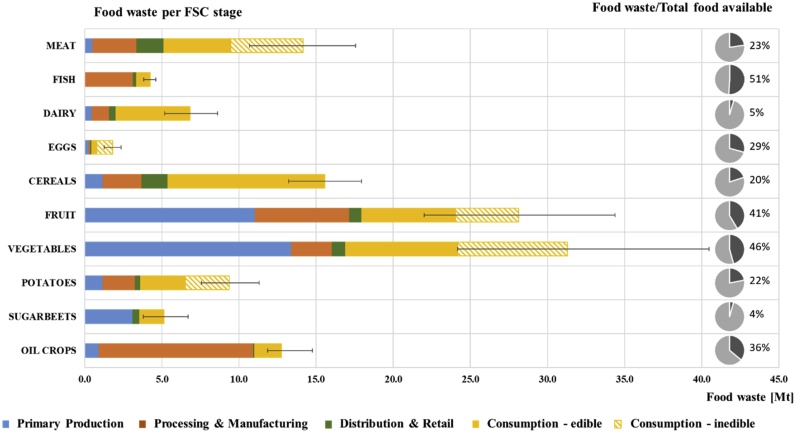
In 2015, the United Nations defined the Sustainable Development Goals (SDG), which include a target (12.3) on food waste. The target requires "by 2030, to halve per capita global food waste at the retail and consumer levels and to reduce food losses along production and supply chains, including post-harvest losses". The target has increased awareness about the food waste problem and boosted research in food waste quantification. Nevertheless, there is a lack of studies that adopt a systematic approach to account for food waste providing disaggregated values per food supply chain stage and per food groups. Such an approach could support policy makers in prioritizing interventions for food waste reduction. To fill this gap, this paper presents a high-level top-down approach to food waste accounting in the European Union. The study aims to support the understanding of the mass flows associated with food production, consumption, and waste, addressing different food groups along the food supply chain. The method for accountin is the mass flow analysis. According to the results, cereals, fruit, and vegetables as the food groups are responsible for the highest amount of food waste, and the consumption stage to be responsible for the largest share of food waste for most food groups. This work highlights the need for further primary research on food waste generation in the EU. Ultimately, this would allow to robustly estimate the food waste generated at EU level, and establishing a more accurate baseline to track the progress towards SDG target 12.3.
Keywords: By-products; Food groups; Food value chain; Food waste; Mass balance; Systematic accounting.
© 2019 The Authors.
Figures
References
-
- Allesch A., Brunner P.H. Material flow analysis as a decision support tool for waste management: a literature review. J. Ind. Ecol. 2015;19:753–764.
-
- Beausang C., Hall C., Toma L. Food waste and losses in primary production: qualitative insights from horticulture. Resour. Conserv. Recycl. 2017;126:177–185.
-
- Beretta C., Stoessel F., Baier U., Hellweg S. Quantifying food losses and the potential for reduction in Switzerland. Waste Manag. 2013;33:764–773. - PubMed
-
- Betz A., Buchli J., Göbel C., Müller C. Food waste in the Swiss food service industry - Magnitude and potential for reduction. Waste Manag. 2015;35:218–226. - PubMed
LinkOut - more resources
Full Text Sources
Miscellaneous