. 2019 Oct 3;179(2):459-469.e9.
doi: 10.1016/j.cell.2019.09.015.

Engineering Phage Host-Range and Suppressing Bacterial Resistance through Phage Tail Fiber Mutagenesis

Affiliations

Engineering Phage Host-Range and Suppressing Bacterial Resistance through Phage Tail Fiber Mutagenesis

Kevin Yehl et al. Cell. .

Abstract

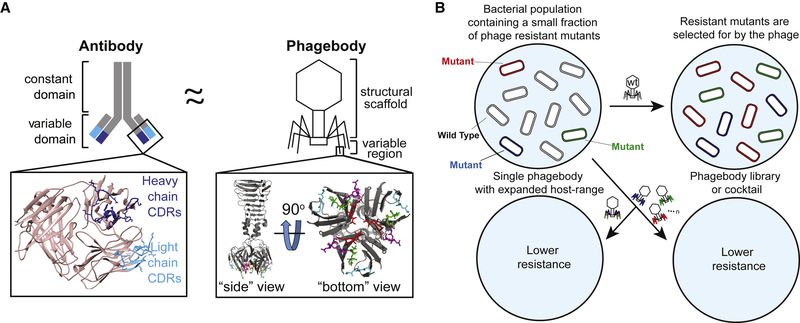
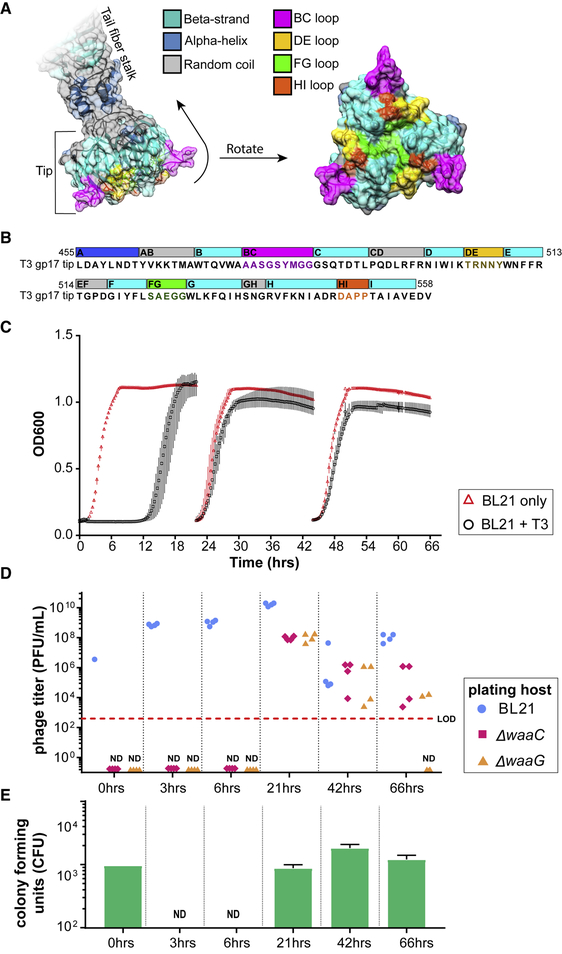
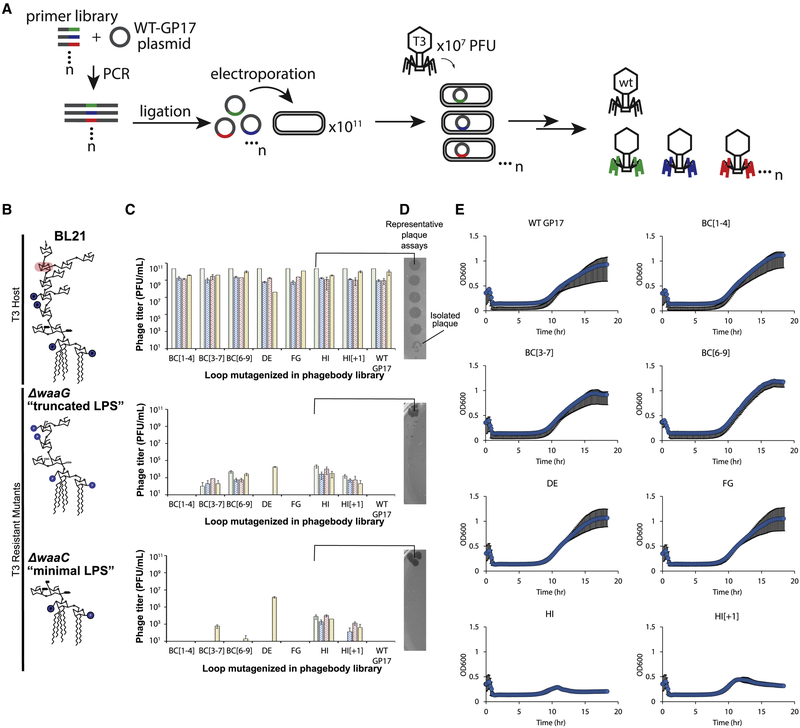
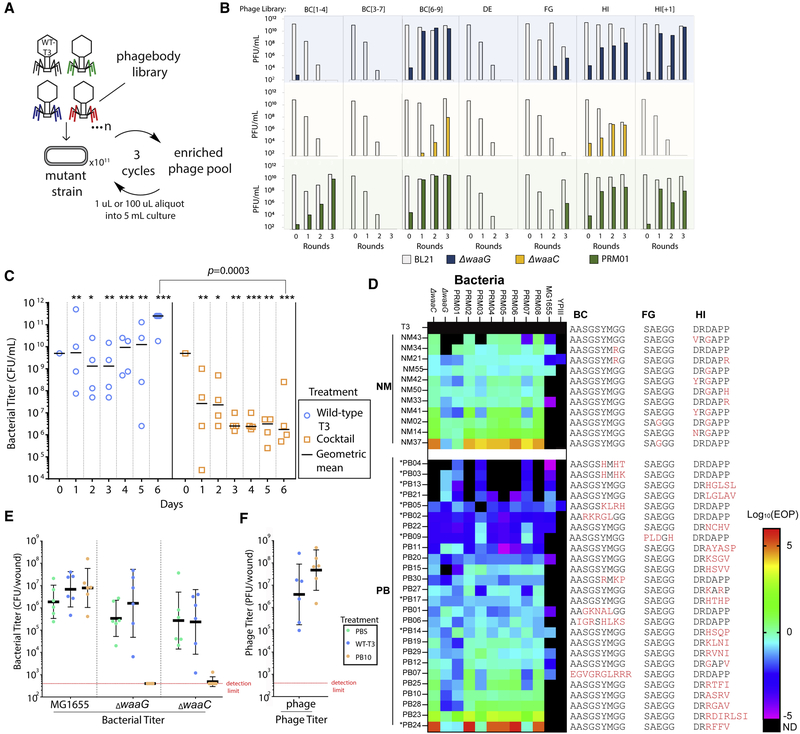
The rapid emergence of antibiotic-resistant infections is prompting increased interest in phage-based antimicrobials. However, acquisition of resistance by bacteria is a major issue in the successful development of phage therapies. Through natural evolution and structural modeling, we identified host-range-determining regions (HRDRs) in the T3 phage tail fiber protein and developed a high-throughput strategy to genetically engineer these regions through site-directed mutagenesis. Inspired by antibody specificity engineering, this approach generates deep functional diversity while minimizing disruptions to the overall tail fiber structure, resulting in synthetic "phagebodies." We showed that mutating HRDRs yields phagebodies with altered host-ranges, and select phagebodies enable long-term suppression of bacterial growth in vitro, by preventing resistance appearance, and are functional in vivo using a murine model. We anticipate that this approach may facilitate the creation of next-generation antimicrobials that slow resistance development and could be extended to other viral scaffolds for a broad range of applications.

Keywords: antibody; antimicrobial; bacteriophage; evolution; host-range; phage; resistance; synthetic biology; tail fiber; virus.


Conflict of interest statement

DECLARATION OF INTERESTS

T.K.L. is a co-founder of Senti Biosciences, Synlogic, Engine Biosciences, Tango Therapeutics, Corvium, BiomX, and Eligo Biosciences. T.K.L. also holds financial interests in nest.bio, Ampliphi, IndieBio, MedicusTek, Quark Biosciences, and Personal Genomics. T.K.L., K.Y., S.L., and H.A. have patents related to this work.

Figures

Figure 1.
Figure 1.. Phagebody Design and Proposed Ability to Target Bacterial Mutants
(A) Schematic illustrating the similarities between antibodies and the phagebody tail fiber. In an antibody, antigen recognition is primarily encoded by six hypervariable complementarity-determining regions (CDRs), three located on the heavy chain and three on the light chain. The inset (left) presents the three-dimensional structure of the variable domain of an antibody (PDB: 1IGT) (Harris et al., 1997). Heavy chain CDRs are colored dark blue and light chain CDRs are colored teal. In phage T7, host-range is largely determined by the C terminus of its tail fiber protein, gp17. The inset (right) shows the crystallographic structure of the C-terminal 182 amino acids of T7 gp17 (PDB: 4A0T). Outward loops (red, magenta, green, and light blue) are expected to participate in receptor recognition while tolerating mutations. Phagebodies are designed to carry mutations in these loops while leaving other structures of the tail fiber intact. (B) Schematic illustrating how resistance appears in bacterial cultures and how phagebody cocktails or individual phagebodies are proposed to suppress resistance.
Figure 2.
Figure 2.. Computational Structure of T3 gp17 and Emergence of Resistance to T3 Infection
(A) Three-dimensional structure of the tail fiber tip domain of phage T3 as modeled by SWISS-MODEL. The molecular surface that include residues belonging to the BC, DE, FG, and HI loops are highlighted in bright colors (magenta, green, gold, and orange, respectively) to illustrate their possible contribution to host binding. (B) Sequence of the T3 tail fiber tip (455–558 amino acids of the gp17 fragment) modeled in (A) with the same corresponding color scheme of structural features highlighted in the three-dimensional model. (C) Bacterial kinetic growth curves of BL21 on its own (red triangles) or BL21 infected with WT T3 (black circles). BL21 cultures were infected with WT T3 and reseeded every 24 h into fresh LB medium. Data shown as the mean ± SD from three experiments. (D) Phage titers of the evolved T3 lysates on the parental host (BL21, blue circles) as well as on ΔwaaG (orange triangles) and ΔwaaC (red diamonds) were measured at the indicated time points. (E) At the indicated time points, aliquots of the lysates were washed, serially diluted, and plated to quantify the number of viable bacteria (CFUs) (green bars; results presented as mean; error bars are ± SD from three experiments; LOD, limit of detection; ND, not detected). T3 mutants that infect ΔwaaG and ΔwaaC appear during co-evolution with WT BL21, but these mutants in the evolved lysates are not capable of preventing resistance in culture or colonies from appearing in the plate resistance assay. See also Table S1.
Figure 3.
Figure 3.. Phagebodies Display Broadened Host-Range toward LPS Mutants that Are Resistant to Wild-Type T3 and Can Suppress Bacterial Resistance in Culture
(A) Schematic showing the strategy to synthesize phagebody libraries. (B) LPS structures for WT BL21 and the T3-resistant BL21 mutants constructed for phagebody isolation. Highlighted in red is the sugar residue that is the T3 receptor. (C) Phage titers for 4 independent phagebody libraries (indicated by color) that had the indicated loop randomized. Titer was measured on WT BL21 (top row), ΔwaaG (middle row), and ΔwaaC (bottom row) in triplicate for each library and the data is plotted as mean ± SD. (D) Representative images of plaque assays from one of the HI loop phagebody libraries highlighting individual plaques. (E) Kinetic plots showing growth curves of WT BL21 bacterial cultures that were infected with phagebody libraries. As a control, WT T3 was grown on E. coli NEB5α carrying a WT T3 gene 17 plasmid (WT gene 17) to account for non-specific mutations during library synthesis. Bacterial growth was monitored by measuring optical density at 600 nm. Each plot consists of 10 replicates from three independent experiments and shown as the mean ± SD. Cultures were infected at an MOI of 0.01. See also Figures S1 and S2 and Tables S2, S3, and S5.
Figure 4.
Figure 4.. In Vitro and In Vivo Activity of Select Phagebodies
(A) Schematic showing the phage panning procedure to amplify functional phagebodies from libraries. (B) Plots summarizing phage titers showing the amplification of functional phages and dilution of WT T3 per round of passaging on mutant strain. Rows are organized by the strain the library was passaged on: blue, ΔwaaG; yellow, ΔwaaC; and green, T3-resistant mutant PRM01 isolated from a WT BL21 culture infected with WT T3. Columns are organized by the phagebody library being passaged. (C) Replicates of four 50 mL cultures were inoculated with WT T3 (blue circles) or a cocktail of 10 phagebodies (orange squares) obtained from the enrichment experiment. Each culture was serially passaged every day with a 2-fold dilution into 23-concentrated LB media for 6 consecutive days and the bacterial titer was measured each day. The day 0 titer corresponds to the starter culture before phage addition. All data points are represented with the geometric mean as a black horizontal bar. Each day shows statistically significant differences between the bacterial titers for cultures treated with the cocktail versus WT T3 (*p < 0.1, **p < 0.05, and ***p < 0.001; one-tailed t test on log-transformed data). The limit of detection is ~300 CFU/mL, which is below the lowest data point on the graph. (D) Heatmap summarizing the efficiency of plating (EOP; ratio of PFU on the bacterial mutant versus on WT BL21) for randomly isolated NMs and PBs on the two constructed isolation hosts, ΔwaaC and ΔwaaG, a panel of experimentally isolated WT-T3-resistant bacterial mutants PRM01–08, E. coli MG1655, and Yersinia pseudotuberculosis YPIII (ND, not detected; * indicates phagebodies used in the defined cocktail in C, which were isolated by enrichment on T3 resistant mutants). (E) Mice were infected with a consortia of bacteria that included equal amounts of MG1655, ΔwaaC, and ΔwaaG (~3 × 10⁹ CFU each) and were treated 1 h post-infection with PBS, T3 (~109 PFU) or PB10 (~109 PFU) (n = 6 mice per treatment). 24 h later, wounds were surgically removed and homogenized for colony counts. The horizontal bar represents geometric mean, and error bars show ± SD. (F) Plot summarizing the plaque counts on BL21 from the surgically removed wounds. The horizontal bar represents geometric mean and error bars show ± SD. See also Figures S3 and S4 and Table S4.

Comment in

References

    1. Alam KK, Chang JL, and Burke DH (2015). FASTAptamer: A Bioinformatic Toolkit for High-throughput Sequence Analysis of Combinatorial Selections. Mol. Ther. Nucleic Acids 4, e230. - PMC - PubMed
    1. Ando H, Lemire S, Pires DP, and Lu TK (2015). Engineering Modular Viral Scaffolds for Targeted Bacterial Population Editing. Cell Syst. 1, 187–196. - PMC - PubMed
    1. Arnold K, Bordoli L, Kopp J, and Schwede T (2006). The SWISS-MODEL workspace: a web-based environment for protein structure homology modelling. Bioinformatics 22, 195–201. - PubMed
    1. Beck A, Wurch T, Bailly C, and Corvaia N (2010). Strategies and challenges for the next generation of therapeutic antibodies. Nat. Rev. Immunol 10, 345–352. - PubMed
    1. Bertozzi Silva J, Storms Z, and Sauvageau D (2016). Host receptors for bacteriophage adsorption. FEMS Microbiol. Lett 363, fnw002. - PubMed

Publication types

Substances

LinkOut - more resources