. 2019 Oct 3;25(4):473-485.e8.
doi: 10.1016/j.stem.2019.08.015.

Metformin Restores CNS Remyelination Capacity by Rejuvenating Aged Stem Cells

Affiliations

Metformin Restores CNS Remyelination Capacity by Rejuvenating Aged Stem Cells

Björn Neumann et al. Cell Stem Cell. .

Abstract

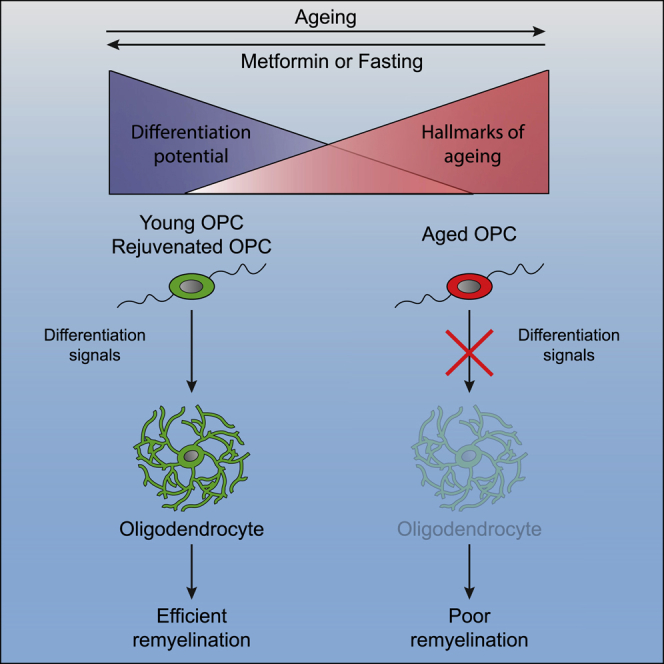
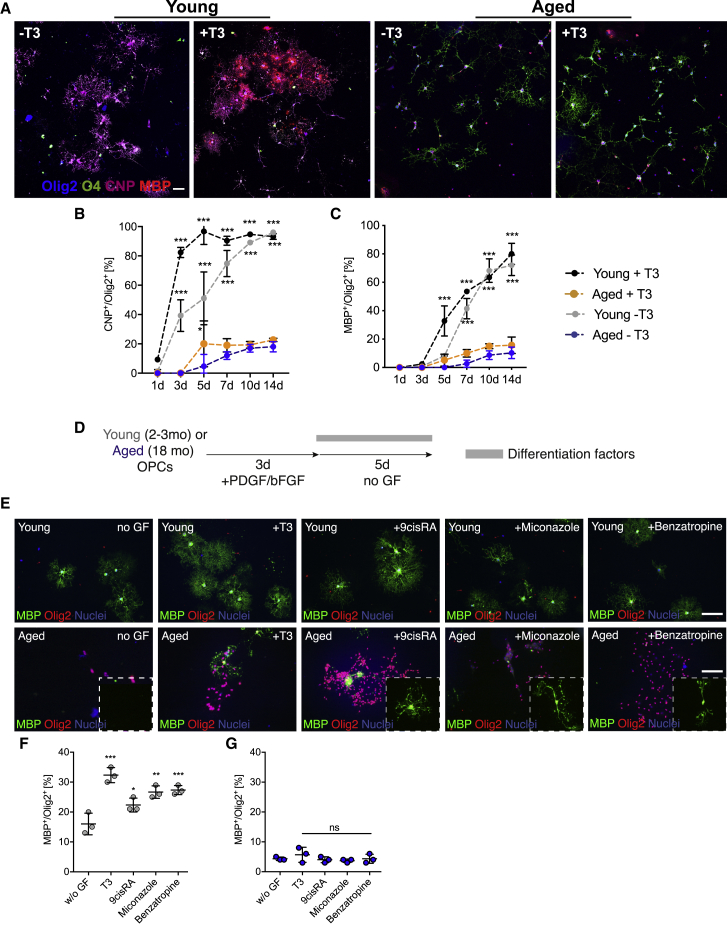
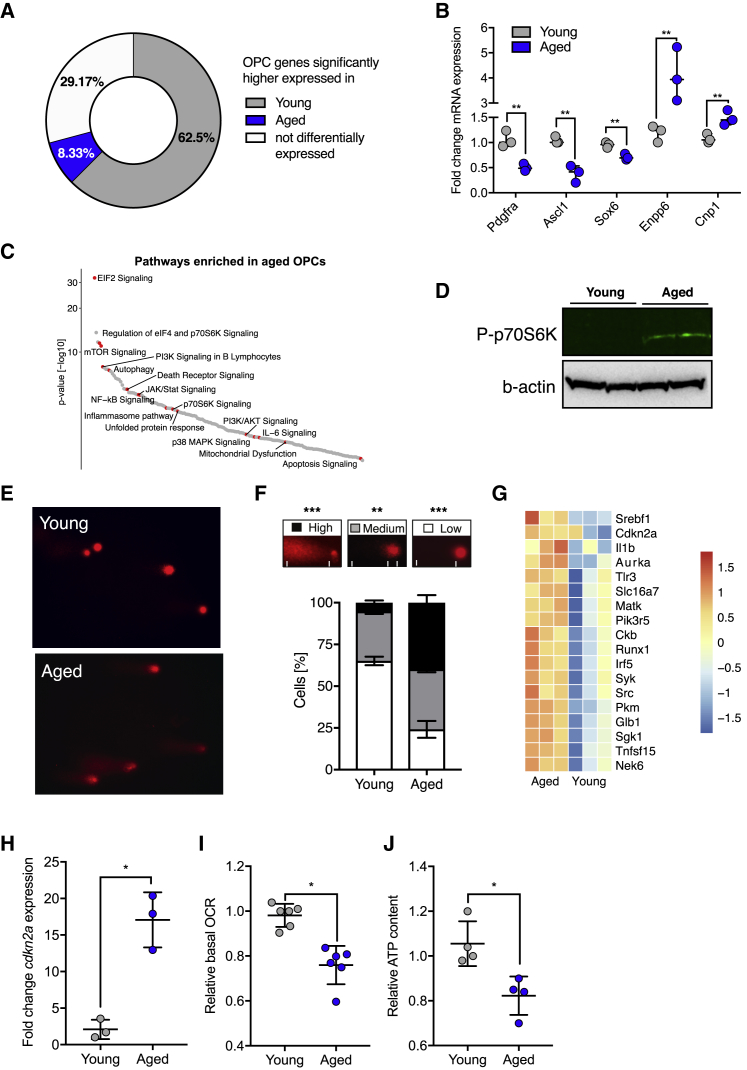
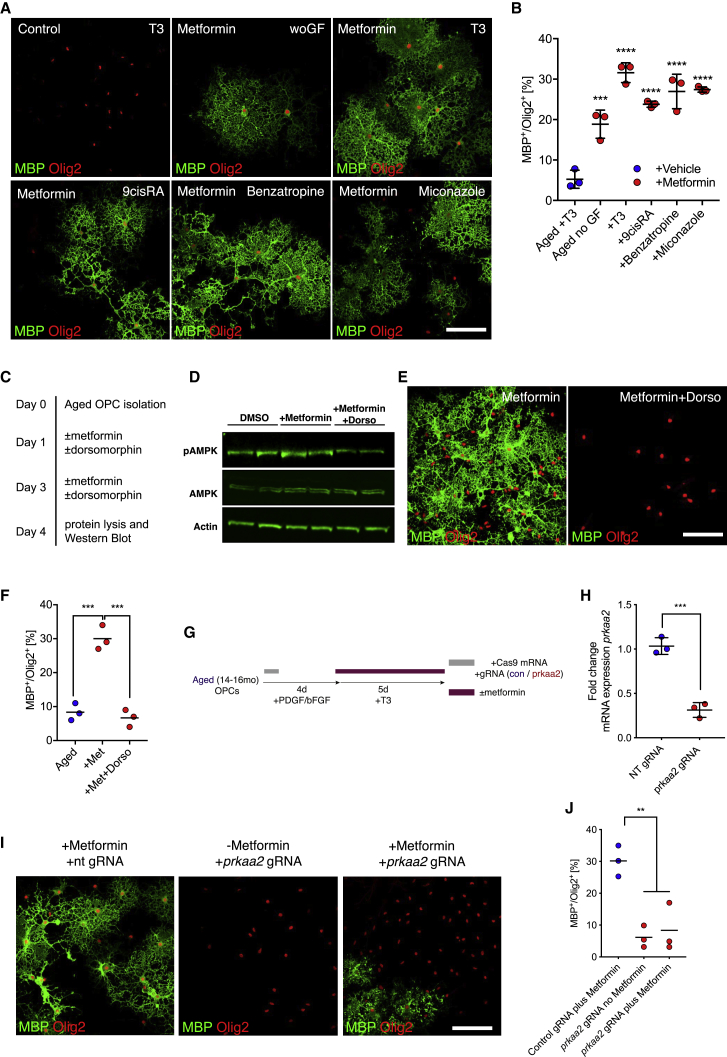
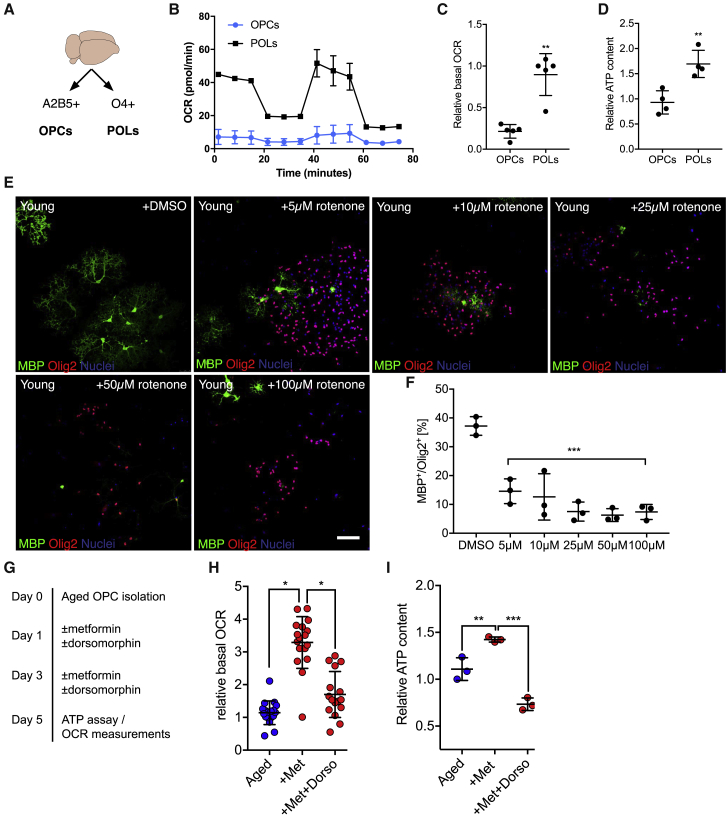
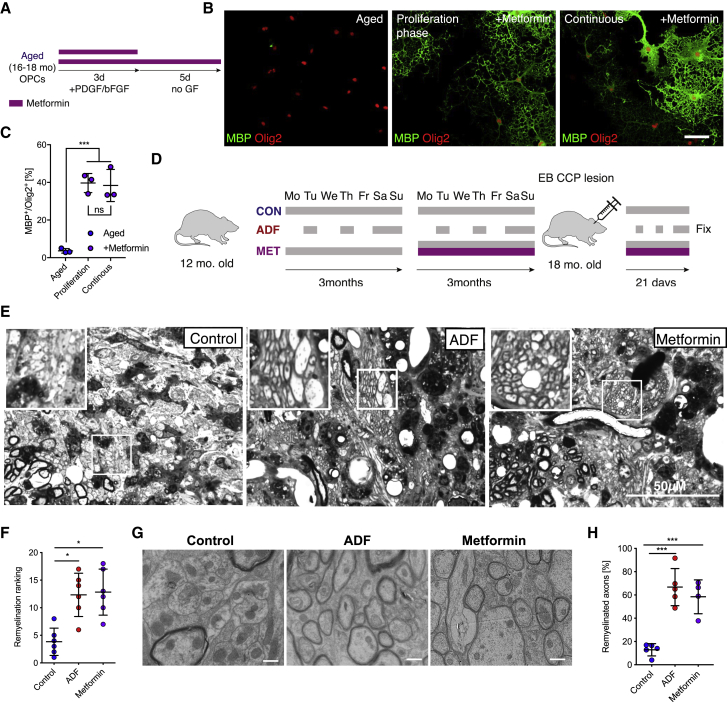
The age-related failure to produce oligodendrocytes from oligodendrocyte progenitor cells (OPCs) is associated with irreversible neurodegeneration in multiple sclerosis (MS). Consequently, regenerative approaches have significant potential for treating chronic demyelinating diseases. Here, we show that the differentiation potential of adult rodent OPCs decreases with age. Aged OPCs become unresponsive to pro-differentiation signals, suggesting intrinsic constraints on therapeutic approaches aimed at enhancing OPC differentiation. This decline in functional capacity is associated with hallmarks of cellular aging, including decreased metabolic function and increased DNA damage. Fasting or treatment with metformin can reverse these changes and restore the regenerative capacity of aged OPCs, improving remyelination in aged animals following focal demyelination. Aged OPCs treated with metformin regain responsiveness to pro-differentiation signals, suggesting synergistic effects of rejuvenation and pro-differentiation therapies. These findings provide insight into aging-associated remyelination failure and suggest therapeutic interventions for reversing such declines in chronic disease.

Keywords: CNS regeneration; adult stem cell; aging; dietary restriction; metformin; oligodendrocyte progenitor cell; rejuvenation; remyelination.


Conflict of interest statement

The authors declare that there are patent applications pending related to this work.

Figures

None
Graphical abstract
Figure 1
Figure 1
OPCs Lose Their Inherent Capacity for Differentiation and Their Responsiveness to Differentiation Factors with Aging (A) Representative images of young adult (2–3 months old) and aged OPCs (20–24 months old) differentiated in the absence of growth factor or in the presence of T3. Increasing maturity was visualized using O4 (early), CNPase (intermediate), and MBP (mature), immunocytochemical markers of the oligodendrocyte (OL) lineage. Scale bars, 50 μm. (B and C) Quantification of cells over time in culture: CNPase+/Olig2+ cells (B) and MBP+/Olig2+ cells (C). Statistical significance was determined using two-way ANOVA repeated measurements followed by Dunnett’s post test to compare each group against “aged T3.” All data are presented as mean ± SD (n = 3 biological repeats). (D) Schematic of the experimental design. (E) Representative images of the differentiation assay performed with young and aged OPCs. Newly formed oligodendrocytes were identified as MBP+/Olig2+ cells. Scale bars, 50 μm. (F and G) Quantification of the differentiation assay for young (F) and aged OPCs (G). n = 3 biological replicates for each group, one-way ANOVA with Dunnett’s multiple comparisons test for each group against the group differentiating in the absence of growth factors (“w/o GF”). Error bars represent SDs. p < 0.05, ∗∗p < 0.01, ∗∗∗p < 0.001. See also Figures S1–S3.
Figure 2
Figure 2
Aged OPCs Have Reduced Expression of OPC-Specific Genes and Acquire Hallmarks of Aging (A) Young and aged OPCs were tested for differential expression of OPC-specific genes. The pie chart summarizes the findings as the percentage of genes that were expressed at significantly higher levels in aged or young OPCs (p.adj < 0.05) or that were not differentially expressed (p.adj > 0.05). See also Table S1. (B) qRT-PCR validation of several genes identified in RNA-seq, comparing freshly isolated young and aged OPCs (n = 3 biological replicates for each age group, two-tailed t test). (C) Top 5 pathways identified by ingenuity pathway analysis (Z score > 2 and p.adj. < 0.05) for genes enriched in aged OPCs (p.adj < 0.05; see also Table S2). (D) Western blot for the downstream mTORC1 pathway target p70S6K and actin loading controls. P, phosphorylated; n = 2 biological samples for each age group. (E) Representative images for comet assays (alkaline conditions) of freshly isolated young and aged OPCs to visualize the degree of DNA damage. Presence of a tail indicates DNA damage. (F) Quantification of the comet assay. The categories used for scoring are depicted in the respective boxes. Statistical significance was determined using one-way ANOVA and Turkey’s post test. All data are presented as mean ± SD (n = 3 biological replicates for each age group). (G) Heatmap of genes from RNA-seq data whose expression is associated with cellular senescence. All depicted genes are differentially expressed (n = 3 biological repeats). (H) qRT-PCR results visualizing expression of the senescence marker Cdkn2a. Data are presented as mean ± SD (n = 3 biological replicates for each age group, two-tailed t test). (I) Fold change of the basal oxygen consumption rate (bOCR), measured after overnight culture in vitro (n = 3 biological repeats for each age group, two-tailed t test). (J) Normalized intracellular ATP content of freshly isolated OPCs (n = 5 biological repeats for each age group, two-tailed t test). Error bars represent SDs. p < 0.05, ∗∗p < 0.01, ∗∗∗p < 0.001.
Figure 3
Figure 3
ADF Enhances Remyelination in Aged Rats Partially through Restoration of the Differentiation Capacity of OPCs (A) Schematic of the fasting experiment. ADF animals had access to food on alternate days only. Control animals had free access to food (ad libitum). Fasting was initiated at 12 months of age for 6 months. White matter demyelination was induced by focal injection of ethidium bromide (EtBr) into the caudal cerebellar peduncle (CCP). (B) Remyelination was assessed 50 days post-lesion induction in semi-thin resin sections stained with toluidine blue. Remyelination is evident as dark circles surrounding a pale gray axon. Myelinated axons that have not undergone demyelination are surrounded by thick, dark myelin. Demyelinated axons have poorly discernible borders. Scale bars, 100 μm. (C) Electron micrographs from areas within the lesion center. Scale bars, 0.5 μm. (D) Quantification of the remyelination data. Each dot represents a single animal. The rank corresponds to the extent of remyelination; a higher rank indicates better remyelination (n ≥ 6 for each group, Mann-Whitney U test). (E) Percentage of remyelinated axons (n ≥ 4 for each group). (F) OPCs were identified as Nkx2.2+ cells within the lesion area (dashed line). Proliferating cells are labeled with Ki67. Scale bars, 100 μm. (G) Quantification of the number of Nkx2.2+ OPCs within the lesion at 7 days post lesion (dpl). (H) Quantification of the density Ki67+ OPCs at 7 dpl (n = 4 biological replicates). (I) Representative images of differentiating oligodendrocytes (Olig2+/CC1+ cells) within the lesion center at 50 dpl. (J) Quantification of the density of newly formed oligodendrocytes within the lesion at 7 dpl, 21 dpl. and 50 dpl. (K) Quantification of the proportion of newly formed oligodendrocytes among all lineage cells (Olig2+). (L) Differentiation assay of OPCs that were isolated from 18-month-old animals that had undergone dietary restriction or had free access to food as described in (A). Differentiated oligodendrocytes were visualized on day 10 of differentiation as MBP+/Olig2+ cells. Scale bars, 50 μm. (M) The proportion of all oligodendrocyte lineage cells (Olig2+) that are differentiated oligodendrocytes MBP+/Olig2+. n = 3 for ADF 21 dpl and n = 4 biological replicates for all other groups in (G), (H), (J), and (K), two-tailed t test; n = 3 biological replicates for each group for (I), two-tailed t test. Error bars represent SDs. p < 0.05; ∗∗p < 0.01; ∗∗∗p < 0.001; ns, p > 0.05. See also Figures S4 and S5.
Figure 4
Figure 4
Metformin Restores the Ability of Aged OPCs to Differentiate in an AMPK-Dependent Manner (A) Representative images of differentiation assays. Newly formed oligodendrocytes are identified as MBP+/Olig2+ cells. Scale bar, 50 μm for all images. Prior to differentiation, OPCs were isolated from aged animals (≥18 months) and cultured in the presence of growth factors for 5 days. Some cells were treated with 100 μM metformin with each medium change during the first 5 days (days 2 and 4). (B) Quantification of the differentiation assay as the proportion of MBP+ cells among all lineage cells (Olig2+). All data are presented as mean ± SD (n = 3 biological replicates, one-way ANOVA with Dunnett’s multiple comparisons test against aged OPCs culture in the absence of growth factors [aged no GF]). (C) Schematic illustration. (D) Western blots for AMPK pathway proteins from aged OPCs treated with DMSO, 100 μM metformin, or 100 μM metformin and 1 μM dorsomorphin (labeled Dorso) for 3 days in vitro. P, phosphorylated (n = 2 biological repeats for each group.) (E) Representative images of differentiation assay findings. Aged OPCs were treated with metformin alone or with metformin and dorsomorphin during the first 5 days of culture, similar as described in Figure S5G. Newly formed oligodendrocytes are identified as MBP+/Olig2+ cells. Scale bars, 50 μm. (F) Proportion of Olig2+ in the differentiation assay that are differentiated (MBP+/Olig2+). All data are presented as mean ± SD (n = 3 biological replicates, one-way ANOVA with Dunnett’s multiple comparisons test against “+met”). (G) Schematic for experiments to knock out Prkaa2 (AMPK) in aged OPCs using CRISPR/Cas9. (H) qPCR confirming knockout of prkaa2 mRNA after CRISPR with guide RNAs (gRNAs) targeting Prkaa2 (n = 3 biological repeats). (I) Representative images of differentiation assays after CRISPR-mediated knockout of Prkaa2. Newly formed oligodendrocytes are identified as MBP+/Olig2+ cells. Scale bars, 50 μm. (J) Quantification of the differentiation assay in (H) (n = 3 biological repeats, all data are mean ± SD, two-tailed t test). met, metformin; dorso, dorsomorphin. Error bars represent SDs. p < 0.05; ∗∗p < 0.01; ∗∗∗p < 0.001; ns, p > 0.05. See also Figures S4 and S6.
Figure 5
Figure 5
Mitochondrial ATP Production Is Required for OPC Differentiation (A) OPCs and differentiating pre-oligodendrocytes (POLs) were isolated from young rats (2–3 months) by MACS using A2B5 (OPCs) and O4 (pre-OL) antibodies. (B) Representative graph depicting the fold change of the bOCR of OPCs and POLs under basal conditions and sequential treatment with oligomycin, carbonyl cyanide-4-(trifluoromethoxy)phenylhydrazone (FCCP), and rotenone and antimycin A. (C) Quantification of the bOCR normalized to POL (n = 2 biological replicates for each group, two-tailed t test). (D) Quantification of normalized ATP measurements from freshly isolated OPCs and POLs. (n = 2 biological repeats for each group, circles depict technical repeats, two-tailed t test). (E) Representative images of differentiation cultures from young OPCs after treatment with DMSO or increasing concentrations of rotenone (a mitochondrial complex I blocker). Newly formed oligodendrocytes were identified as MBP+/Olig2+ cells. Scale bar, 50 μm. (F) Quantification of the differentiation assay (all data are presented as mean ± SD; statistical significance was determined using one-way ANOVA with Dunnett’s post test for each treatment group against DMSO; n = 3 biological replicates). (G) Schematic illustration of the experiments using metformin and dorsomorphin. (H) Relative change in the bOCR, measured after treatment of aged OPCs with metformin and/or dorsomorphin for 5 days in vitro. Dots represent technical replicates (n = 3 biological repeats for each age group, two-tailed t test). (I) Intracellular ATP content of aged OPCs, normalized to cell numbers in the respective control group, treated with metformin alone or metformin and dorsomorphin (n = 3 biological repeats for each age group, two-tailed t test). Error bars represent SDs. p < 0.05; ∗∗p < 0.01; ∗∗∗p < 0.001; ns, p > 0.05.
Figure 6
Figure 6
Metformin Treatment Enhances Remyelination in Aged Rats (A) Aged OPCs were treated with metformin either during the recovery period prior to differentiation or during the entire culture period. (B) Representative images of differentiation cultures at 5 days of differentiation. Newly formed oligodendrocytes were identified as MBP+/Olig2+ cells. Scale bar, 50 μm. (C) Quantification of the number of differentiated Olig2+ MBP+ cells after 5 days of differentiation (all data are presented as mean ± SD; statistical significance was determined using one-way ANOVA with Dunnett’s test for multiple comparisons against group “Aged”; n = 3 biological replicates). (D) 12-month-old-female SD rats were divided into three groups. The control and ADF groups were treated as described in Figure 3A. Metformin animals had ad libitum access to food but received metformin at dose of 300 mg/kg bodyweight in their drinking water from the age of 15 months. At 18 months of age, demyelinating lesions were induced by injection of EtBr into the CCP. (E) Remyelination is evident as dark circles surrounding a pale gray axon. Myelinated axons that have not undergone demyelination are surrounded by thick, dark myelin. Demyelinated axons have poorly discernible borders. Scale bar, 50 μm. (F) Ranking analysis of remyelination. Each dot represents a single animal. The rank corresponds to the degree of remyelination; a higher rank indicates better remyelination (n = 6 biological replicates for each group, Kruskal-Wallis test followed by Dunn’s post test). (G) Representative electron micrographs of lesions. Scale bars, 500 nm. (H) Quantification of the percentage of remyelinated axons (n ≥ 4 biological repeats for each group, one-way ANOVA with multiple comparisons between each group). Error bars represent SDs. p < 0.05; ∗∗p < 0.01; ∗∗∗p < 0.001; ns, p > 0.05.

Comment in

References

    1. Blakemore W.F. Pattern of remyelination in the CNS. Nature. 1974;249:577–578. - PubMed
    1. Boyd A., Zhang H., Williams A. Insufficient OPC migration into demyelinated lesions is a cause of poor remyelination in MS and mouse models. Acta Neuropathol. 2013;125:841–859. - PMC - PubMed
    1. Cantuti-Castelvetri L., Fitzner D., Bosch-Queralt M., Weil M.T., Su M., Sen P., Ruhwedel T., Mitkovski M., Trendelenburg G., Lütjohann D. Defective cholesterol clearance limits remyelination in the aged central nervous system. Science. 2018;359:684–688. - PubMed
    1. Castilho R.M., Squarize C.H., Chodosh L.A., Williams B.O., Gutkind J.S. mTOR mediates Wnt-induced epidermal stem cell exhaustion and aging. Cell Stem Cell. 2009;5:279–289. - PMC - PubMed
    1. Cerletti M., Jang Y.C., Finley L.W.S., Haigis M.C., Wagers A.J. Short-term calorie restriction enhances skeletal muscle stem cell function. Cell Stem Cell. 2012;10:515–519. - PMC - PubMed

Publication types

MeSH terms