. 2019 Dec;157(6):1599-1614.e2.
doi: 10.1053/j.gastro.2019.09.026. Epub 2019 Oct 1.

Mouse Models of Human Gastric Cancer Subtypes With Stomach-Specific CreERT2-Mediated Pathway Alterations

Affiliations

Mouse Models of Human Gastric Cancer Subtypes With Stomach-Specific CreERT2-Mediated Pathway Alterations

Therese Seidlitz et al. Gastroenterology. 2019 Dec.

Abstract

Background & aims: Patterns of genetic alterations characterize different molecular subtypes of human gastric cancer. We aimed to establish mouse models of these subtypes.

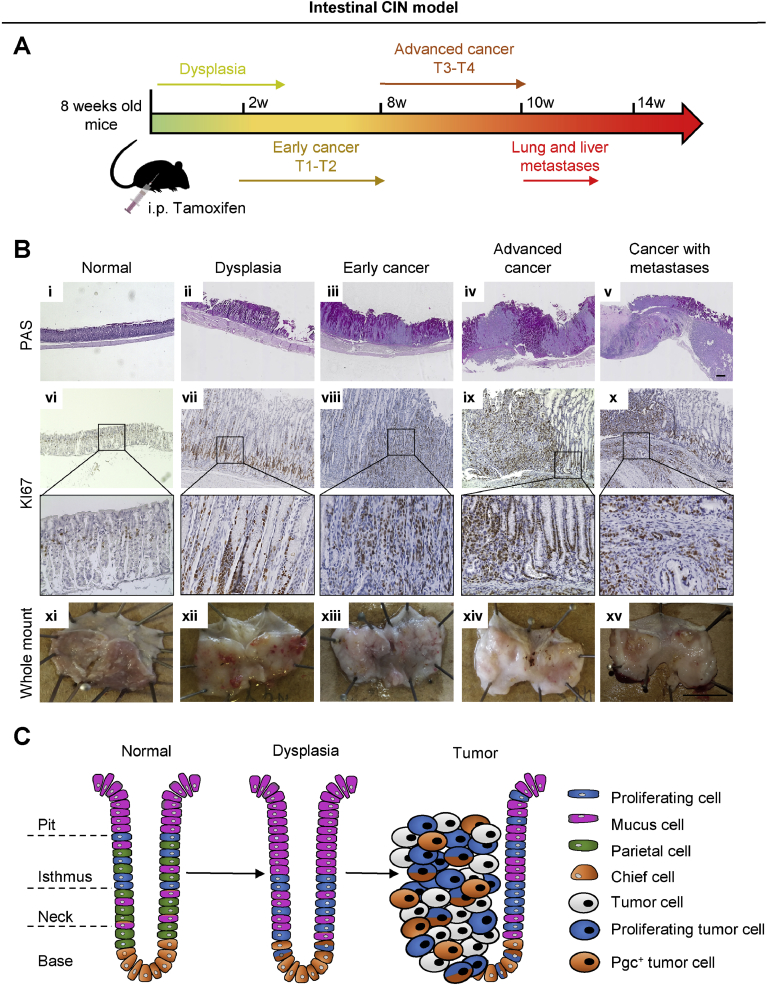
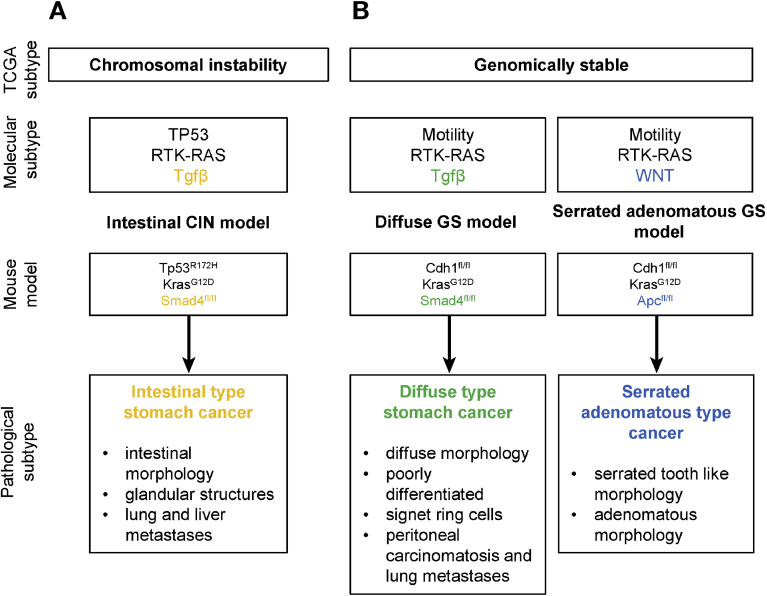
Methods: We searched databases to identify genes with unique expression in the stomach epithelium, resulting in the identification of Anxa10. We generated mice with tamoxifen-inducible Cre recombinase (CreERT2) in the Anxa10 gene locus. We created 3 mouse models with alterations in pathways that characterize the chromosomal instability (CIN) and the genomically stable (GS) subtypes of human gastric cancer: Anxa10-CreERT2;KrasG12D/+;Tp53R172H/+;Smad4fl/f (CIN mice), Anxa10-CreERT2;Cdh1fl/fl;KrasG12D/+;Smad4fl/fl (GS-TGBF mice), and Anxa10-CreERT2;Cdh1fl/fl;KrasG12D/+;Apcfl/fl (GS-Wnt mice). We analyzed tumors that developed in these mice by histology for cell types and metastatic potential. We derived organoids from the tumors and tested their response to chemotherapeutic agents and the epithelial growth factor receptor signaling pathway inhibitor trametinib.

Results: The gastric tumors from the CIN mice had an invasive phenotype and formed liver and lung metastases. The tumor cells had a glandular morphology, similar to human intestinal-type gastric cancer. The gastric tumors from the GS-TGFB mice were poorly differentiated with diffuse morphology and signet ring cells, resembling human diffuse-type gastric cancer. Cells from these tumors were invasive, and mice developed peritoneal carcinomatosis and lung metastases. GS-Wnt mice developed adenomatous tooth-like gastric cancer. Organoids derived from tumors of GS-TGBF and GS-Wnt mice were more resistant to docetaxel, whereas organoids from the CIN tumors were more resistant to trametinib.

Conclusions: Using a stomach-specific CreERT2 system, we created mice that develop tumors with morphologic similarities to subtypes of human gastric cancer. These tumors have different patterns of local growth, metastasis, and response to therapeutic agents. They can be used to study different subtypes of human gastric cancer.

Keywords: Carcinogenesis; Cre/loxP System; Stomach Cancer; Targeted Therapy.


Figures

None
Graphical abstract
Figure 1
Figure 1
Anxa10-CreERT2: a stomach-specific inducible Cre line. (A) IHC of ANXA10 on mouse stomach. Scale bar, 100 μm. (B) Knock-in strategy. An IRES-CreERT2 cassette including a Neo resistance was inserted after exon 12 via homologous recombination. (C) Expression of LacZ in Anxa10-CreERT2;Rosa26-LSL-LacZ mice in stomach epithelium 48 hours after Cre induction. Scale bar, 100 μm. (D) Immunofluorescence stainings for lineage markers on induced Anxa10-CreERT2;Rosa26-LSL-ZsGreen mice. Scale bar, 50 μm. E, exon; UTR, untranslated region.
Figure 2
Figure 2
Intestinal CIN model. (A) Timeline of the intestinal CIN gastric cancer model (Anxa10-CreERT2;KrasG12D;Tp53R172H;Smad4fl/fl). (B) PAS and KI67 staining and whole-mount pictures of mouse stomach at different stages of gastric cancer development. Scale bar i-v: 500 µm, vi-x: 50 µm, zoom in vi-x: 25 µm. (C) Sketch of the cell type distribution in tumors and surrounding dysplastic mucosa.
Figure 3
Figure 3
Diffuse GS model. (A) Timeline of the diffuse GS gastric cancer model (Anxa10-CreERT2;Cdh1fl/fl;KrasG12D;Smad4fl/fl). (B) PAS and KI67 staining and whole-mount pictures of mouse stomach at different stages of cancer development. Scale bar i-iv: 500 µm, v-viii: 50 µm, zoom in v-viii: 25 µm. (C) Sketch of the cell-type distribution in tumors and surrounding dysplastic mucosa.
Figure 4
Figure 4
Serrated adenomatous GS model. (A) Timeline of the serrated adenomatous GS gastric cancer model (Anxa10-CreERT2;Cdh1fl/f;KrasG12D;Apcfl/fl). (B) PAS and KI67 staining and whole-mount pictures of mouse stomach at different stages of cancer development. Scale bar i-iv: 500 µm, v-viii: 50 µm, zoom in v-viii: 25 µm. (C) Sketch of the cell-type distribution in tumors (no dysplastic mucosa left).
Figure 5
Figure 5
Divergent metastatic potential of the gastric cancer subtypes. (A) The intestinal CIN model showed metastatic spread to the liver and the lung. (B, C) H&E staining. (D, E) CK20 and (F, G) ANXA10 IHC. (H) In the GS model, metastases to the lung and peritoneum were observed. (I, J) H&E, (K, L) CK20, and (M, N) ANXA10 IHC. Scale bar, 50 μm.
Figure 6
Figure 6
Gastric cancer organoid models characterized by different morphology and drug response. (A1–3) Gastric cancer organoid morphology of 3 subtypes: intestinal CIN, diffuse GS, and serrated adenomatous GS organoid model. (A4–6) H&E staining of gastric cancer organoid lines. Scale bar, 100 μm. (B) Proliferation assay of established cancer organoid lines. Statistical analysis of the percentage of EdU+ cells by Student t test (*P < .05, **P < .01). (C) Dose-response curves of organoids treated with classical chemotherapy (5-FU, oxaliplatin, docetaxel). Statistical analysis of dose response curves by repeated measures analysis of variance (ANOVA). (D) Targeting of the EGFR signaling pathway with trametinib. Dose response curve after 72 hours of trametinib treatment. Statistical analysis by repeated-measures ANOVA (*P < .05). Western Blot of ERK1/2 and phosphorylated ERK1/2 levels of the 3 models after 10 nmol/L trametinib treatment for 72 hours. Amount of apoptotic cells (FITC-Annxein V+/PI+ and FITC-Annexin V+/PI cells) after 10 nmol/L and 72 hours trametinib treatment. Statistical analysis of the percentage of apoptotic cells by Student t test (*P < .05, **P < .01). M, mol/L.
Figure 7
Figure 7
Characteristic features of gastric cancer models. (A) Genotype and phenotype features of the intestinal CIN model. (B) Genotype and phenotype features of the diffuse and the serrated adenomatous GS model.

References

    1. Global Burden of Disease Cancer Collaboration The global burden of cancer 2013. JAMA Oncol. 2015;1:505–527. - PMC - PubMed
    1. Arnold M., Soerjomataram I., Ferlay J. Global incidence of oesophageal cancer by histological subtype in 2012. Gut. 2015;64:381–387. - PubMed
    1. McColl K.E.L., Going J.J. Aetiology and classification of adenocarcinoma of the gastro-oesophageal junction/cardia. Gut. 2010;59:282–284. - PubMed
    1. The Cancer Genome Atlas Research Network. Kim J., Bowlby R. Integrated genomic characterization of oesophageal carcinoma. Nature. 2017;541(7636):169–175. - PMC - PubMed
    1. Hunt R.H., Camilleri M., Crowe S.E. The stomach in health and disease. Gut. 2015;64:1650–1668. - PMC - PubMed

Publication types

MeSH terms