. 2019 Nov 15;294(46):17395-17408.
doi: 10.1074/jbc.RA119.009167. Epub 2019 Oct 4.

Mechanically activated Piezo1 channels of cardiac fibroblasts stimulate p38 mitogen-activated protein kinase activity and interleukin-6 secretion

Affiliations

Mechanically activated Piezo1 channels of cardiac fibroblasts stimulate p38 mitogen-activated protein kinase activity and interleukin-6 secretion

Nicola M Blythe et al. J Biol Chem. .

Abstract

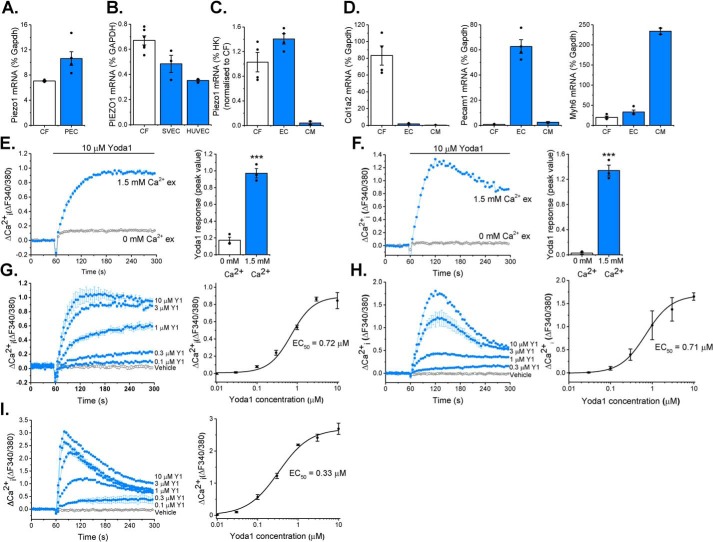
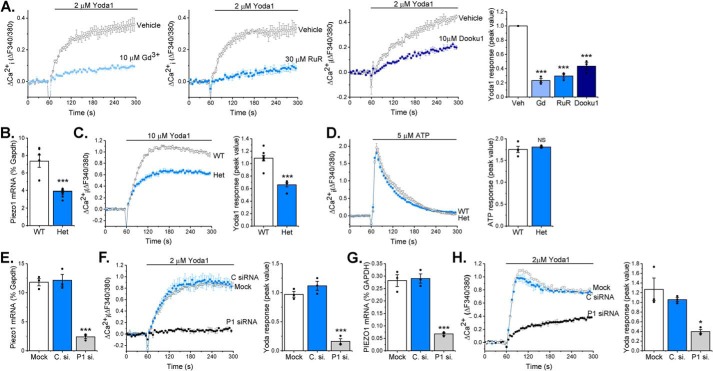
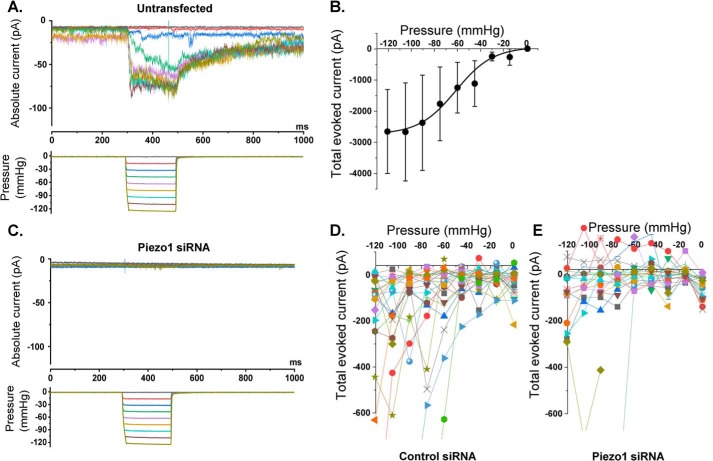
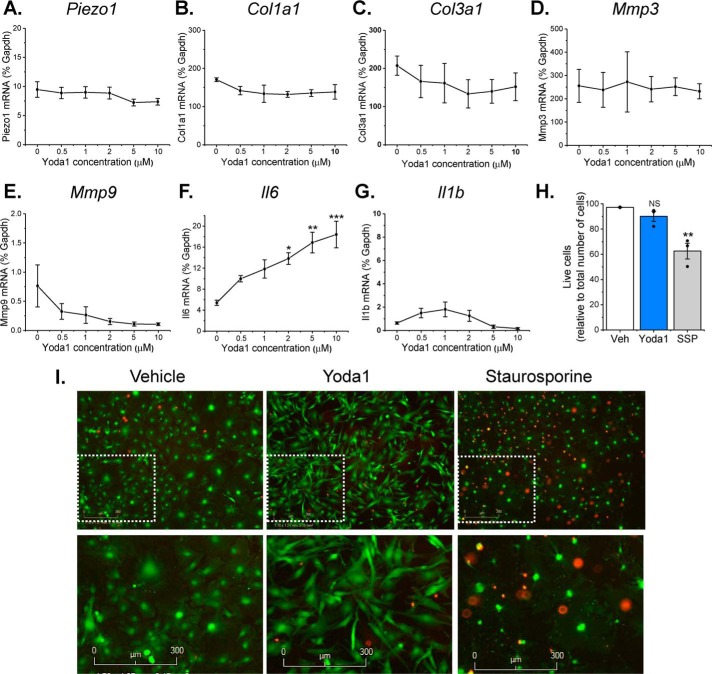
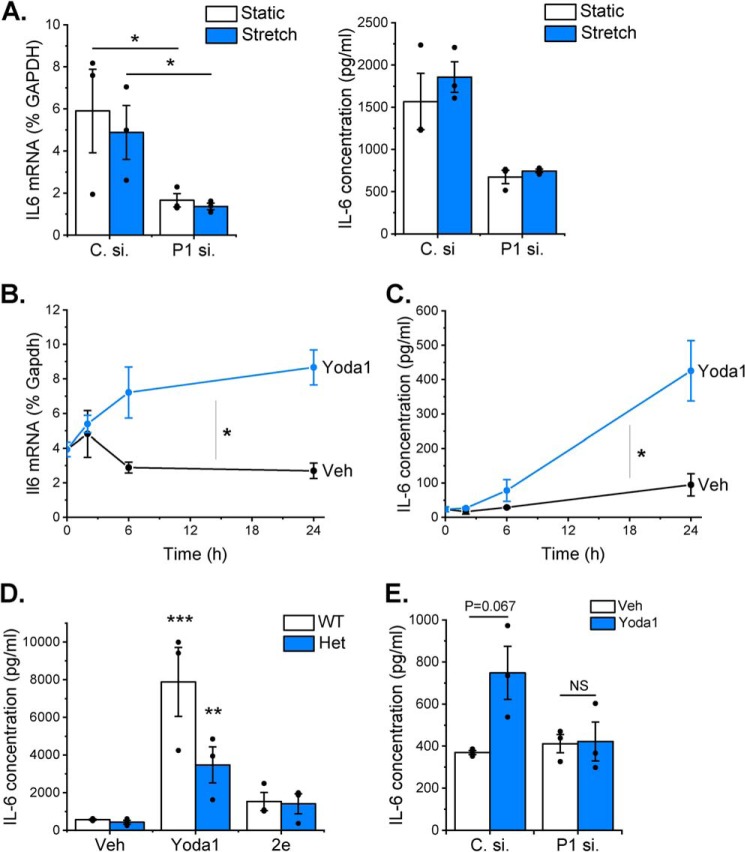
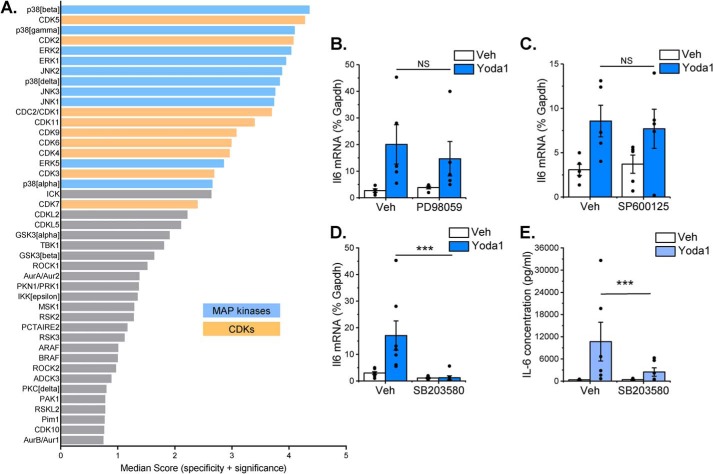
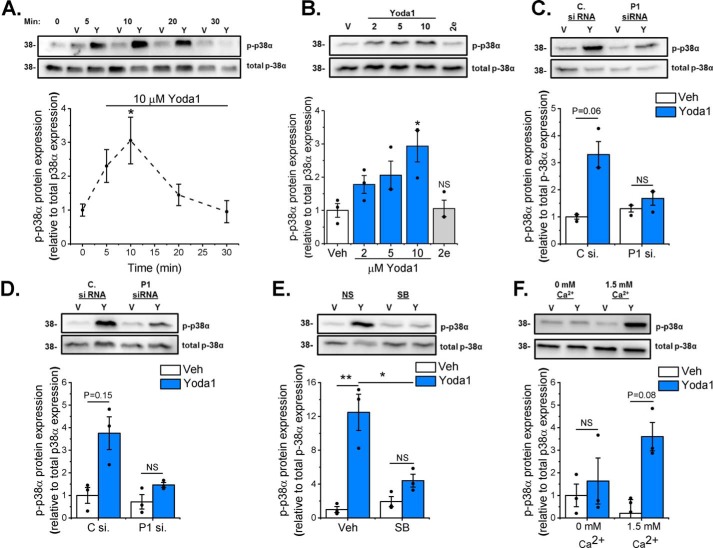
Piezo1 is a mechanosensitive cation channel with widespread physiological importance; however, its role in the heart is poorly understood. Cardiac fibroblasts help preserve myocardial integrity and play a key role in regulating its repair and remodeling following stress or injury. Here we investigated Piezo1 expression and function in cultured human and mouse cardiac fibroblasts. RT-PCR experiments confirmed that Piezo1 mRNA in cardiac fibroblasts is expressed at levels similar to those in endothelial cells. The results of a Fura-2 intracellular Ca2+ assay validated Piezo1 as a functional ion channel that is activated by its agonist, Yoda1. Yoda1-induced Ca2+ entry was inhibited by Piezo1 blockers (gadolinium and ruthenium red) and was reduced proportionally by siRNA-mediated Piezo1 knockdown or in murine Piezo1+/- cells. Results from cell-attached patch clamp recordings on human cardiac fibroblasts established that they contain mechanically activated ion channels and that their pressure responses are reduced by Piezo1 knockdown. Investigation of Yoda1 effects on selected remodeling genes indicated that Piezo1 activation increases both mRNA levels and protein secretion of IL-6, a pro-hypertrophic and profibrotic cytokine, in a Piezo1-dependent manner. Moreover, Piezo1 knockdown reduced basal IL-6 expression from cells cultured on softer collagen-coated substrates. Multiplex kinase activity profiling combined with kinase inhibitor experiments and phosphospecific immunoblotting established that Piezo1 activation stimulates IL-6 secretion via the p38 mitogen-activated protein kinase downstream of Ca2+ entry. In summary, cardiac fibroblasts express mechanically activated Piezo1 channels coupled to secretion of the paracrine signaling molecule IL-6. Piezo1 may therefore be important in regulating cardiac remodeling.

Keywords: IL-6; calcium; cardiac fibroblast; fibroblast; heart; ion channel; mechanotransduction; mitogen-activated protein kinase (MAPK); p38 MAPK; patch clamp; signal transduction.


Conflict of interest statement

The authors declare that they have no conflicts of interest with the contents of this article

Figures

Figure 1.
Figure 1.
Piezo1 is expressed by cardiac fibroblasts and forms a functional ion channel. A and B, RT-PCR analysis of Piezo1 mRNA expression in murine cardiac fibroblasts (CF, n = 3) compared with murine pulmonary endothelial cells (PEC, n = 5) (A) and human CF (n = 6) compared with human saphenous vein endothelial cells (SVEC, n = 3) and HUVECs (n = 3) (B). Expression was measured as percent of the housekeeping control (Gapdh/GAPDH). C, RT-PCR analysis of Piezo1 mRNA expression in fibroblast-enriched fraction 2 (CF) and endothelial cell–enriched fraction 1 (EC) isolated from murine heart using the MACS technique (n = 4). Cardiomyocytes (CM) were isolated from separate hearts (n = 2). Expression was measured relative to three housekeeping genes (Gapdh, Actb, and Hprt) and normalized to the CF sample. D, RT-PCR analysis of cell type-specific marker genes for CF (Col1a2), endothelial cells (Pecam1), and cardiomyocytes (Myh6) in MACS fractions as for C. E and F, representative Ca2+ traces and mean ± S.E. are shown. Ca2+ entry was evoked by 10 μm Yoda1 in murine (E) and human (F) cardiac fibroblasts in the presence or absence of extracellular Ca2+. ***, p < 0.001 (paired t test; n/N = 3/9). G–I, Ca2+ entry evoked by varying concentrations of Yoda1 application at 60 s, ranging from 0.1–10 μm in murine (G) and human (H) cardiac fibroblasts and HEK T-Rex-293 cells heterologously expressing mouse Piezo1 (I). Vehicle control is illustrated by the black trace. Mean ± S.E. are displayed as concentration–response curves, and fitted curves are plotted using a Hill equation, indicating the EC50 of Yoda1 (n/N = 3/9).
Figure 2.
Figure 2.
Yoda1-evoked Ca2+ entry depends on Piezo1 expression. A, representative intracellular Ca2+ traces and mean data after murine cardiac fibroblasts were exposed to 10 μm Gd3+, 30 μm ruthenium red (RuR), 10 μm Dooku1, or vehicle (Veh) for 30 min before activation of Piezo1 by application of 2 μm Yoda1. Data were normalized to vehicle-treated cells. Repeated measures one-way ANOVA: p < 0.0001, F = 114.1 (n/N = 3/9). Post hoc test: ***, p < 0.001 versus vehicle-treated cells. B, RT-PCR analysis of Piezo1 mRNA expression in cultured murine cardiac fibroblasts isolated from WT and Piezo1+/− (Het) mice. Expression is measured as percent of the housekeeping control Gapdh. ***, p < 0.001 (unpaired t test, n = 8). C, representative Ca2+ trace and mean data illustrating Ca2+ entry elicited by 10 μm Yoda in cardiac fibroblasts from WT (n/N = 8/24) and Piezo1+/− Het (n/N = 5/15) mice. ***, p < 0.001 (unpaired t test). D, representative Ca2+ trace and mean data illustrating Ca2+ entry evoked by 5 μm ATP in cardiac fibroblasts from WT (n/N = 4/12) and Piezo1+/− (Het, n/N = 3/9) mice. Unpaired t test: not significant (NS). E, RT-PCR analysis of Piezo1 mRNA expression following transfection of murine cardiac fibroblasts with Piezo1 siRNA, mock-transfected cells, and cells transfected with control siRNA. Expression is measured as percent of the housekeeping control Gapdh. Repeated measures one-way ANOVA: p = 0.0001, F = 61.1 (n = 3). Post hoc test: ***, p < 0.001 versus mock-transfected cells. F, representative Ca2+ trace and mean data showing the response to 2 μm Yoda1 in murine cardiac fibroblasts transfected with Piezo1-specific siRNA (P1 si.) compared with mock-transfected cells and cells transfected with control siRNA (C. si.). Repeated measures one-way ANOVA: p < 0.0001, F = 72.6 (n/N = 3/9). Post hoc test: ***, p < 0.001 versus mock-transfected cells. G, as for E but in human cardiac fibroblasts. Repeated measures one-way ANOVA: p = 0.0002, F = 50.8 (n/N = 3/9). Post hoc test: ***, p < 0.001 versus mock-transfected cells. H, as for F but in human cardiac fibroblasts. Repeated measures one-way ANOVA: p = 0.0108, F = 10.6 (n/N = 3/9). Post hoc test: *, p < 0.05 versus mock-transfected cells.
Figure 3.
Figure 3.
Cardiac fibroblasts express mechanically activated ionic currents that depend on Piezo1. Recordings were made from cell-attached patches on human cardiac fibroblasts. A constant holding voltage of +80 mV was applied to the patch pipette to ensure a negative membrane potential across the patch (inside relative to outside). A rapid pressure clamp system applied 200-ms negative pressure (suction) steps of increasing magnitude to the patch pipette. A, example data from an untransfected cell. The color code of the pressure steps (bottom panel) matches the color code of the current traces in the top panel. B, mean ± S.E. data for experiments of the type shown in A, in which the total current during 180 ms of each pressure pulse was summed for n = 7–8 patches/data point. The fitted curve is the Boltzmann function, which gave a midpoint for 50% activation of −61.3 mm Hg. C, as for A but from a cell that was transfected with Piezo1 siRNA. D and E, each color shows the individual data for all recordings from cells transfected with control siRNA (D, n = 24 recordings) or Piezo1 siRNA (E, n = 21 recordings). As for B, the total current during 180 ms of each pressure pulse was summed. Two-way ANOVA: p = 0.0475, F = 3.95 (siRNA); p < 0.0001, F = 4.15 (pressure); p < 0.0001, F = 4.16 (interaction). In D and E, data values exceeding approximately −600 pA are clipped to maximize visibility of the majority of the data, but all data values were included in the statistical analysis. The two large current values in the Piezo1 siRNA group may have been from nontransfected cells because the transfection efficiency was estimated to be 90%.
Figure 4.
Figure 4.
Effect of Yoda1 on gene expression and cell survival in cardiac fibroblasts. A–G, RT-PCR analysis of murine cardiac fibroblasts treated with concentrations of Yoda1 ranging from 0.5–10 μm or DMSO vehicle for 24 h (n = 3). All mRNA expression levels were normalized to those of the housekeeping gene Gapdh. Repeated measures one-way ANOVA: p = 0.0010, F = 8.9. Post hoc test: *, p < 0.05; **, p < 0.01; ***, p < 0.001 versus vehicle-treated cells. H, live/dead cell assay performed on cultured murine cardiac fibroblasts treated with either vehicle (Veh), 10 μm Yoda1, or 1 μm staurosporine (SSP) for 24 h. The bar chart shows mean data for viable cells as a percentage of total cells. Repeated measures one-way ANOVA: p = 0.0028, F = 10.6 (n = 3). Post hoc test: **, p < 0.01; NS, not significant versus vehicle-treated cells. I, representative images from the live/dead cell assay. Green indicates live cells; red indicates dead cells. Bottom panels are magnified images of the indicated regions in the top panels.
Figure 5.
Figure 5.
Activation of Piezo1 is coupled to IL-6 expression. A, RT-PCR analysis of IL6 mRNA expression (left panel) and ELISA analysis of IL-6 protein secretion (right panel) after exposure of human cardiac fibroblasts to 24-h cyclical stretch (1 Hz, 10% stretch) on collagen-coated BioFlex plates compared with fibroblasts maintained in parallel under static conditions. Cardiac fibroblasts were transfected previously with either control siRNA (C. si.) or Piezo1-specific siRNA (P1 si.). RT-PCR data are expressed as percent of the housekeeping control GAPDH. Repeated measures two-way ANOVA for RT-PCR (n = 3): p = 0.0704, F = 12.7 (siRNA); p = 0.403, F = 1.1 (stretch); p = 0.754, F = 0.13 (interaction). Post hoc test: *, p < 0.05. Repeated measures two-way ANOVA for ELISA (n = 3): p = 0.0268, F = 35.8 (siRNA); p = 0.1545, F = 5.0 (stretch); p = 0.838, F = 0.05 (interaction). Post hoc test: not statistically significant. B and C, murine cardiac fibroblasts were exposed to vehicle (Veh) or 10 μm Yoda1 for 2–24 h before measuring Il6 mRNA levels by RT-PCR, where expression is measured as percent of the housekeeping control Gapdh (B) or analyzing conditioned medium for IL-6 levels by ELISA (C) (both n = 3). Comparison of the area under the curve by paired t test: *, p < 0.05 for the effect of Yoda1 on IL-6 expression at both mRNA and protein levels. D, cardiac fibroblasts from WT (n = 4) and Piezo1+/− (Het, n = 3) mice were treated with vehicle, 10 μm Yoda1, or compound 2e for 24 h before measuring IL-6 levels in conditioned medium using ELISA. Two-way ANOVA: p < 0.0001, F = 24.9 (compound); p = 0.1041, F = 3.1 (genotype); p = 0.615, F = 0.51 (interaction). Post hoc test: ***, p < 0.001; **, p < 0.01 for the effect of Yoda1 versus vehicle. All other changes were not statistically significant. E, mouse cardiac fibroblasts were transfected with control or Piezo1-specific siRNA and treated with either vehicle or 10 μm Yoda1 for 24 h before collecting conditioned media and measuring IL-6 levels by ELISA (n = 3). Repeated measures two-way ANOVA: p = 0.2349, F = 2.82 (siRNA); p = 0.2187, F = 3.13 (Yoda1); p = 0.064, F = 14.2 (interaction). Post hoc test: NS, not significant versus vehicle-treated cells.
Figure 6.
Figure 6.
Piezo1 activation induces MAP kinase signaling, with p38 MAPK being coupled to IL-6 expression. A, mouse cardiac fibroblasts were stimulated with 10 μm Yoda1 for 10 min before analyzing Ser/Thr protein kinase activity with PamChip multiplex kinase activity profiling (n = 6). Kinases were identified based on peptide substrate phosphorylation and ranked by specificity and statistical significance (only the top 40 are shown). See Table S1 for the full dataset. The top kinase families predicted to be activated by Yoda1 were the MAPKs ERK1/2/5, JNK1/2/3, and p38α/β/γ/δ (blue) and CDKs 1–7, 9, and 11 (orange). B–D, RT-PCR analysis of Il6 mRNA expression after exposure of murine cardiac fibroblasts to 30 μm PD98059 (B, an ERK pathway inhibitor), 10 μm SP600125 (C, a JNK inhibitor), or 10 μm SB203580 (D, a p38 MAPK inhibitor) for 1 h, followed by treatment with vehicle (Veh) or 10 μm Yoda1 for a further 24 h. Expression is measured as percent of the housekeeping control Gapdh (n = 7 for SB203580, n = 5 for PD98059, and SP600125). Repeated measures two-way ANOVA for B: p = 0.7738, F = 0.133 (PD98059); p = 0.0529, F = 7.41 (Yoda1); p = 0.069, F = 6.08 (interaction). For C: p = 0.6133, F = 0.299 (SP600125); p = 0.0020, F = 51.9 (Yoda1); p = 0.475, F = 0.62 (interaction). For D: p = 0.0004, F = 52.1 (SB203580); p = 0.2942, F = 1.32 (Yoda1); p = 0.0028, F = 23.8 (interaction). Post hoc test: ***, p < 0.001; NS, not significant for the effect of inhibitor. E, murine cardiac fibroblasts were treated with vehicle or 10 μm SB203580 for 1 h and then treated with either vehicle or 10 μm Yoda1 for 24 h before collecting conditioned media and measuring IL-6 levels by ELISA (n = 6). Repeated measures two-way ANOVA: p = 0.0217, F = 10.8 (SB203580); p = 0.0283, F = 9.3 (Yoda1); p = 0.0002, F = 98.1 (interaction). Post hoc test: ***, p < 0.001 for the effect of SB203580.
Figure 7.
Figure 7.
Yoda1-induced p38 MAPK phosphorylation depends on Piezo1. Cellular protein samples were immunoblotted for p-p38α and reprobed with antibody for total p38α to confirm equal protein loading. The bar charts show mean densitometric data of p-p38α normalized to p38α expression. A, murine cardiac fibroblasts (n = 6) treated with DMSO vehicle (V) or 10 μm Yoda1 (Y) for 5–30 min. *, p < 0.05 versus vehicle-treated cells (repeated measures one-way ANOVA, p = 0.0085). B, murine cardiac fibroblasts (n = 3) treated for 10 min with varying concentrations of Yoda1 (2–10 μm) or 10 μm compound 2e. *, p < 0.05; NS, not significant versus vehicle-treated cells (repeated measures one-way ANOVA, p = 0.0122). C and D, murine (C) or human (D) cardiac fibroblasts (n = 3) transfected with either scrambled or Piezo1-specific siRNA before treatment with vehicle or 10 μm Yoda1 for 10 min. Repeated measures two-way ANOVA for C: p = 0.0202, F = 48.0 (Yoda1); p = 0.3045, F = 1.87 (siRNA); p = 0.0903, F = 9.6 (interaction). Repeated measures two-way ANOVA for D: p = 0.0282, F = 34.0 (Yoda1); p = 0.2669, F = 2.32 (siRNA); p = 0.478, F = 0.75 (interaction). Post hoc test: not significant. E, murine cardiac fibroblasts (n = 3) exposed to 10 μm SB203580 for 1 h before treatment with vehicle or 10 μm Yoda1 for 10 min. Repeated measures two-way ANOVA: p = 0.0312, F = 30.6 (Yoda1); p = 0.5898, F = 0.40 (SB203580); p = 0.0148, F = 65.9 (interaction). Post hoc test: **, p < 0.01; *, p < 0.05. F, murine cardiac fibroblasts (n = 3) treated for 10 min with vehicle or 10 μm Yoda1 in either standard DMEM or DMEM containing 1.75 mm EGTA to chelate free Ca2+. Repeated measures two-way ANOVA: p = 0.0123, F = 79.5 (Yoda1); p = 0.5739, F = 0.44 (Ca2+); p = 0.128, F = 6.34 (interaction). Post hoc test: not significant.

References

    1. Deb A., and Ubil E. (2014) Cardiac fibroblast in development and wound healing. J. Mol. Cell. Cardiol. 70, 47–55 10.1016/j.yjmcc.2014.02.017 - DOI - PMC - PubMed
    1. Turner N. A., and Porter K. E. (2013) Function and fate of myofibroblasts after myocardial infarction. Fibrogenesis Tissue Repair 6, 5 10.1186/1755-1536-6-5 - DOI - PMC - PubMed
    1. Herum K. M., Lunde I. G., McCulloch A. D., and Christensen G. (2017) The soft- and hard-heartedness of cardiac fibroblasts: mechanotransduction signaling pathways in fibrosis of the heart. J. Clin. Med. 6, E53 - PMC - PubMed
    1. Fan D., Takawale A., Lee J., and Kassiri Z. (2012) Cardiac fibroblasts, fibrosis and extracellular matrix remodeling in heart disease. Fibrogenesis Tissue Repair 5, 15 10.1186/1755-1536-5-15 - DOI - PMC - PubMed
    1. Saucerman J. J., Tan P. M., Buchholz K. S., McCulloch A. D., and Omens J. H. (2019) Mechanical regulation of gene expression in cardiac myocytes and fibroblasts. Nat. Rev. Cardiol. 16, 361–378 10.1038/s41569-019-0155-8 - DOI - PMC - PubMed

Publication types

MeSH terms