. 2019 Oct 4;10(1):4538.
doi: 10.1038/s41467-019-12364-6.

Integrated evolutionary analysis reveals antimicrobial peptides with limited resistance

Affiliations

Integrated evolutionary analysis reveals antimicrobial peptides with limited resistance

Réka Spohn et al. Nat Commun. .

Abstract

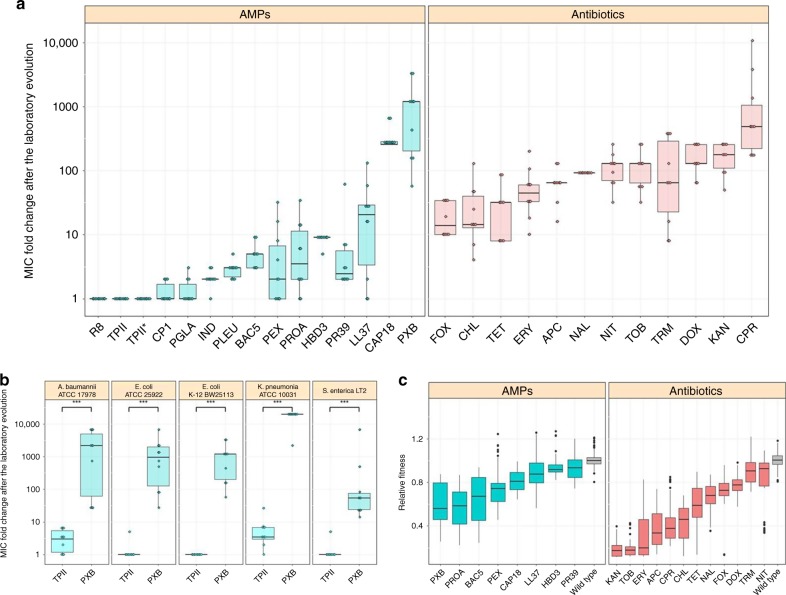
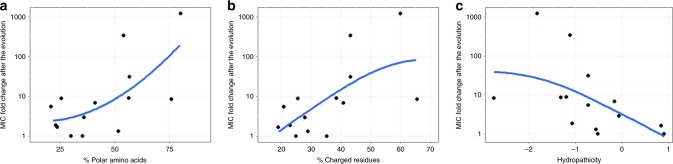
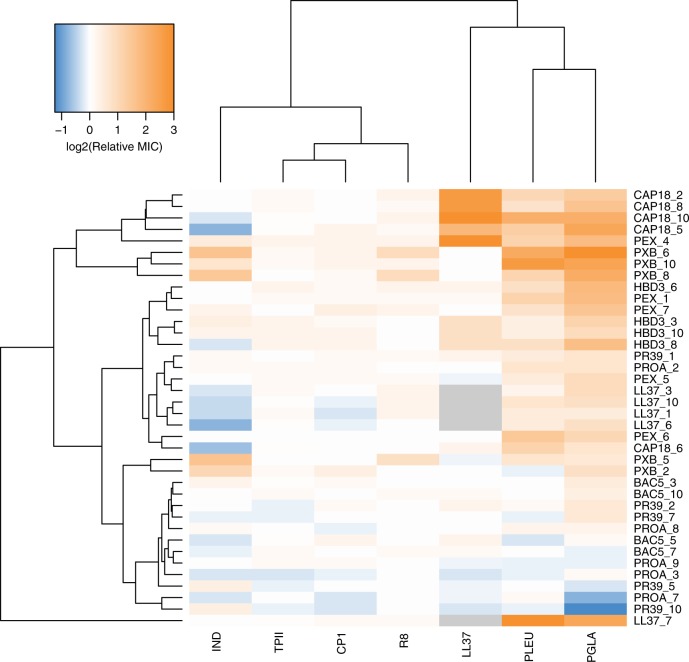
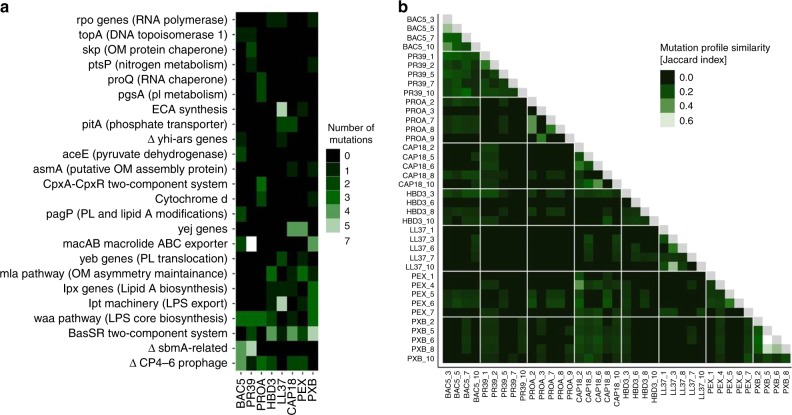
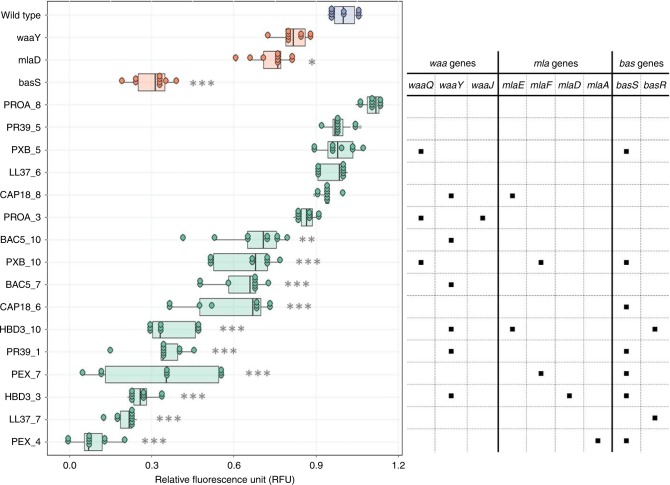
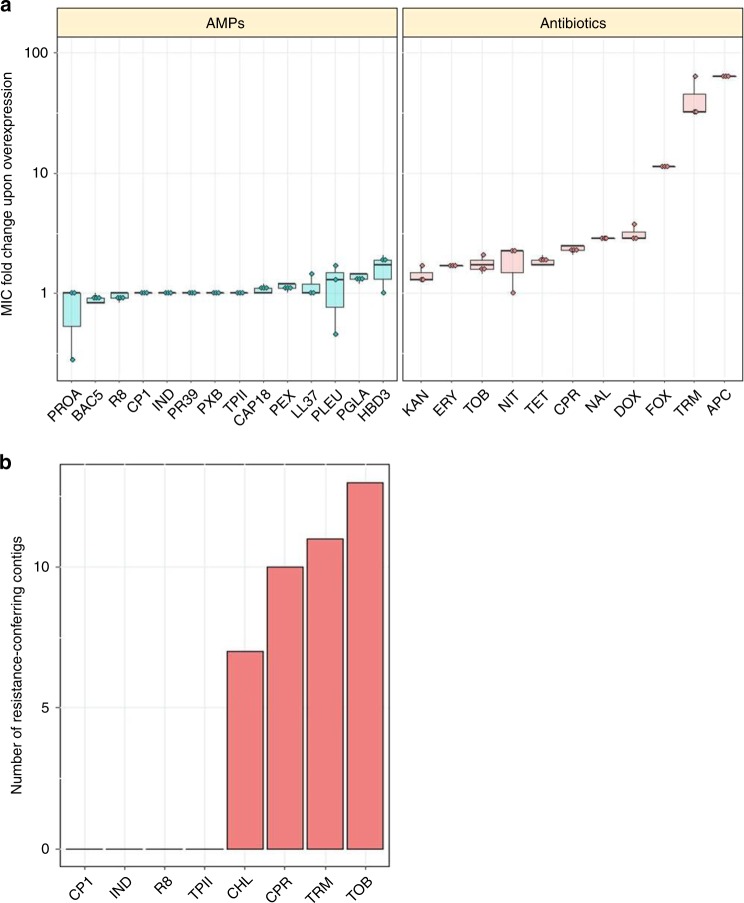
Antimicrobial peptides (AMPs) are promising antimicrobials, however, the potential of bacterial resistance is a major concern. Here we systematically study the evolution of resistance to 14 chemically diverse AMPs and 12 antibiotics in Escherichia coli. Our work indicates that evolution of resistance against certain AMPs, such as tachyplesin II and cecropin P1, is limited. Resistance level provided by point mutations and gene amplification is very low and antibiotic-resistant bacteria display no cross-resistance to these AMPs. Moreover, genomic fragments derived from a wide range of soil bacteria confer no detectable resistance against these AMPs when introduced into native host bacteria on plasmids. We have found that simple physicochemical features dictate bacterial propensity to evolve resistance against AMPs. Our work could serve as a promising source for the development of new AMP-based therapeutics less prone to resistance, a feature necessary to avoid any possible interference with our innate immune system.


Conflict of interest statement

The authors declare no competing interests.

Figures

Fig. 1
Fig. 1
MIC and relative fitness of adapted lines after the laboratory evolution. a Relative resistance level in laboratory evolved E. coli K-12 BW2511 lines exposed to one of each 14 AMPs (blue) or 12 antibiotics (red), respectively (at least 9 parallel-evolved lines per drug). Altogether, lines exposed to AMPs (N = 138) developed significantly lower resistance, than lines exposed to antibiotics (N = 120) (P < 0.0001, one-sided permutation test). The resistance levels reached were more heterogeneous across AMP treatments (N = 14) than across antibiotic treatments (N = 12) (P = 0.03478 F-test). Each data point represents the MIC fold change of one of each parallel-evolved line. The mutD5 mutator strain exposed to TPII is marked by an asterisk (*). b Relative resistance level after laboratory evolution in clinical isolates under TPII or PXB stresses, respectively. Evolved lines exposed to TPII reached significantly lower resistance level than lines exposed to PXB (*** indicate the significant difference at least P-value = 1.65 × 10–4, two-sided Mann–Whitney test, N = 10 each group). Each data point represents the MIC fold change of one of each parallel-evolved line. c Relative fitness of 60 antibiotic-resistant and 38 AMP-resistant lines displaying at least twofold increments in resistance level to the drug indicated. Fitness was measured as the area under the growth curve in an antibacterial agent-free medium and was normalized to that of the wild-type (gray color). Throughout Fig. 1, boxplots show the median, first and third quartiles, with whiskers showing the 5th and 95th percentile. For AMP and antibiotic abbreviations, see Supplementary Tables 1–2. Data in this figure are representative of at least two biological replicates. Source data are provided as a Source Data file
Fig. 2
Fig. 2
Resistance level correlate with AMPs’ physicochemical features. Each datapoint shows the average MIC-fold change in laboratory evolved E. coli K-12 BW2511 lines exposed to one of each 14 AMPs. a Fraction of polar amino acids and relative resistance level (Spearman’s rho = 0.58; p = 0.03, N = 14). b Fraction of positively charged and relative resistance level (Spearman’s rho = 0.62; p = 0.02, N = 14). c AMP hydropathicity and relative resistance level (Spearman’s rho = −0.73; p = 0.002, N = 14). For AMP properties, see Supplementary Data 3. Blue lines indicate the curve fitted using LOESS smoothing method in R. Source data are provided as a Source Data file
Fig. 3
Fig. 3
Cross-resistance of AMP-resistant lines towards a set of 7 AMPs. Relative minimum inhibitory concentration (MIC) was calculated as the ratio of the MIC of the resistant line and the sensitive wild-type strain. Hierarchical clustering was performed separately on rows and columns, using complete linkage method with Euclidean distance measure on the raw MIC data. Throughout the figure, blue coloring refers to collateral-sensitivity (MIC at least two-fold lower than the wild-type), orange coloring refers to cross-resistance (MIC at least two-fold higher than the wild-type), white coloring refers to no or minimal change in susceptibility (MIC in between). Gray coloring refers to not applicable. AMP-resistant lines (rows) are named after the AMP it has been exposed to during the evolutionary experiment, and the serial number of the corresponding population. For relative MICs, see Supplementary Data 4 and for AMP abbreviations, see Supplementary Table 1. Data in this figure are representative of at least two biological replicates
Fig. 4
Fig. 4
Mutational profiles of 38 AMP-resistant lines. a The figure shows cellular complexes and pathways mutated independently in multiple lines as a function of AMPs used during laboratory evolution. The color code indicates the number of individual mutations affecting a given cellular subsystem in lines evolved to a given AMP. OM outer membrane, PL phospholipid, LPS lipopolysaccharide, Δ gene deletion. b Heatmap shows mutation profile similarity of AMP-resistant lines. Mutation profile similarity between each pair of AMP-resistant lines was estimated by the Jaccard’s coefficient between their set of mutated genes. Large deletions were counted as one gene. AMP-resistant lines are named after the AMP it has been exposed to during the evolutionary experiment, and the serial number of the corresponding population. For AMP abbreviations, see Supplementary Table 1
Fig. 5
Fig. 5
Surface charge measurement. Relative surface charge was measured as the relative change in the binding of the positively charged FITC-PLL compared to the wild-type (see Methods). The table on the right side shows whether the adapted line carries a mutation in the waa or mla pathway genes or in the BasSR two-component system. AMP-resistant lines are named after the AMP it has been exposed to during the evolutionary experiment, and the serial number of the corresponding population. Each data point represents the relative fluorescence unit of one of 9 biological replicate. Boxplots show the median, first and third quartiles, with whiskers showing the 5th and 95th percentile. Significant differences compared to the wild type are marked with gray asterisks (*P < 0.05, **P < 0.01, ***P < 0.001, two-sided Dunnett’s test, N = 9 each group). Source data are provided as a Source Data file
Fig. 6
Fig. 6
Impact of gene amplification and foreign genes on resistance. a The impact of gene overexpression on resistance level. Dots represent show the MIC provided by the ASKA plasmid library relative to the MIC of the wild type carrying the empty ASKA plasmid (three biological replicates each). Altogether, the overexpression of the ASKA plasmid library resulted in significantly higher resistance to antibiotics (N = 11) than for AMPs (N = 14) (P < 0.0001, one-sided permutation test). Each data point represents the MIC fold change of one of three biological replicate. Boxplots show the median, first and third quartiles, with whiskers showing the 5th and 95th percentile. b Functional metagenomics of a soil library. Functional selection has revealed 41 distinct antibiotic resistance-conferring DNA contigs (red bars), while no AMP resistance-conferring contigs were identified (P = 2 × 10−16 from two-sided negative binomial regression). For AMP and antibiotic abbreviations, see Supplementary Tables 1–2. Source data are provided as a Source Data file

References

    1. Zasloff M. Antimicrobial peptides of multicellular organisms. Nature. 2002;415:389–395. doi: 10.1038/415389a. - DOI - PubMed
    1. Hancock REW, Sahl HG. Antimicrobial and host-defense peptides as new anti-infective therapeutic strategies. Nat. Biotechnol. 2006;24:1551–1557. doi: 10.1038/nbt1267. - DOI - PubMed
    1. Mahlapuu M, Håkansson J, Ringstad L, Björn C. Antimicrobial Peptides: An Emerging Category of Therapeutic Agents. Front. Cell. Infect. Microbiol. 2016;6:1–12. doi: 10.3389/fcimb.2016.00194. - DOI - PMC - PubMed
    1. Yeaman, M. R. & Yount, N. Y. Mechanisms of antimicrobial peptide action and resistance. 57, 1–24 (2003). - PubMed
    1. Brogden KA. Antimicrobial peptides: pore formers or metabolic inhibitors in bacteria? Nat. Rev. Microbiol. 2005;3:238–250. doi: 10.1038/nrmicro1098. - DOI - PubMed

Publication types

MeSH terms

Substances