. 2019 Oct 4;10(1):4513.
doi: 10.1038/s41467-019-12507-9.

The midbody interactome reveals unexpected roles for PP1 phosphatases in cytokinesis

Affiliations

The midbody interactome reveals unexpected roles for PP1 phosphatases in cytokinesis

Luisa Capalbo et al. Nat Commun. .

Abstract

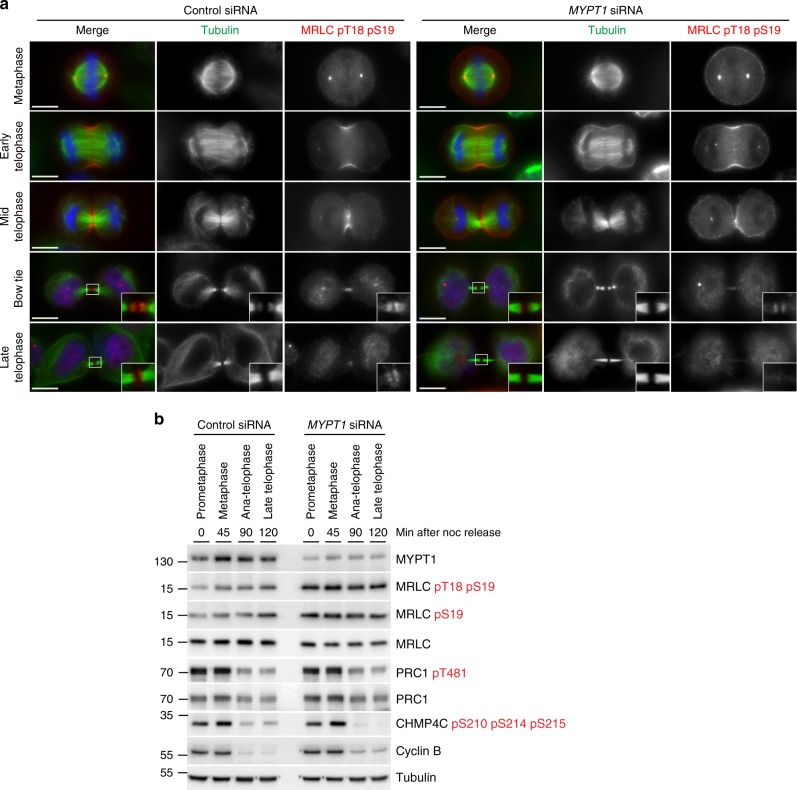
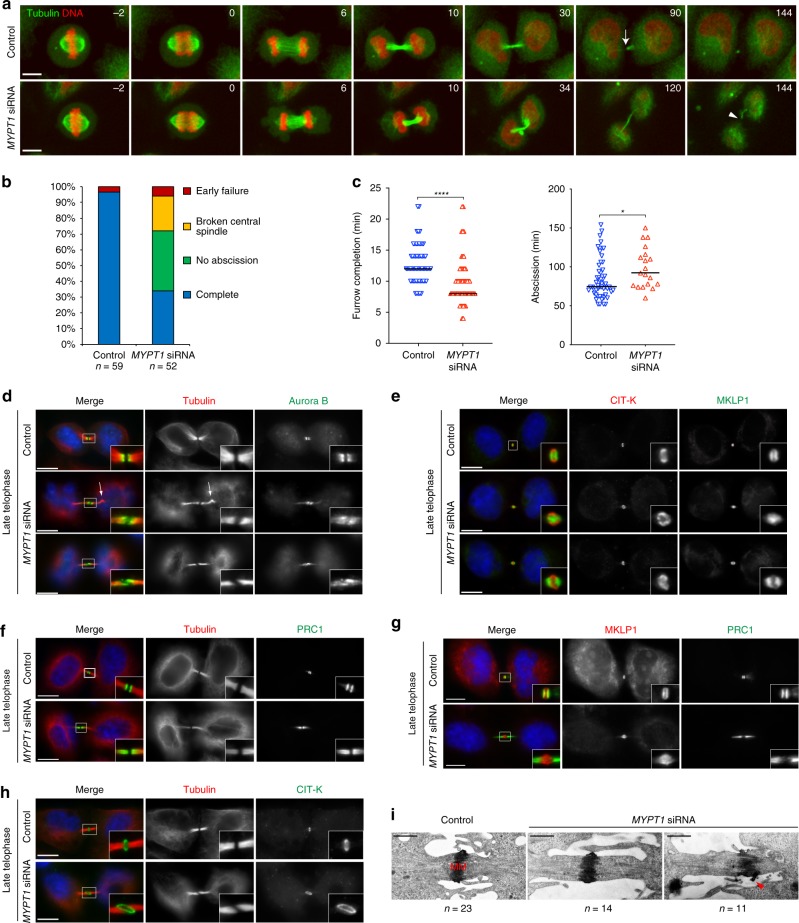
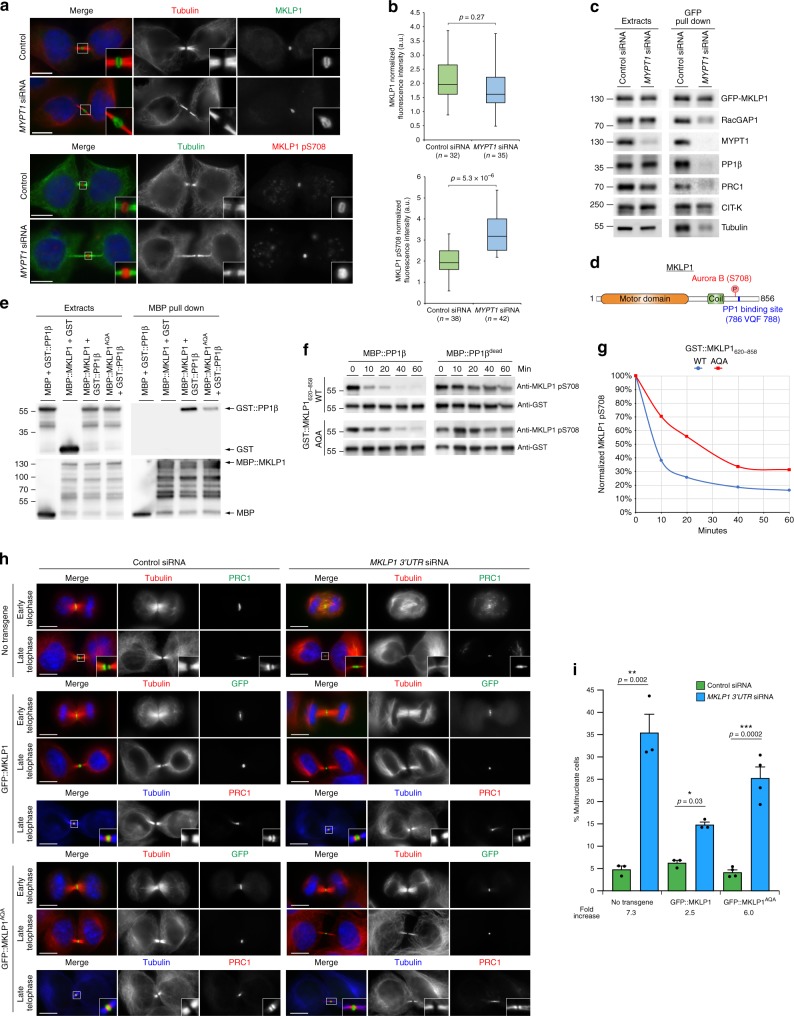
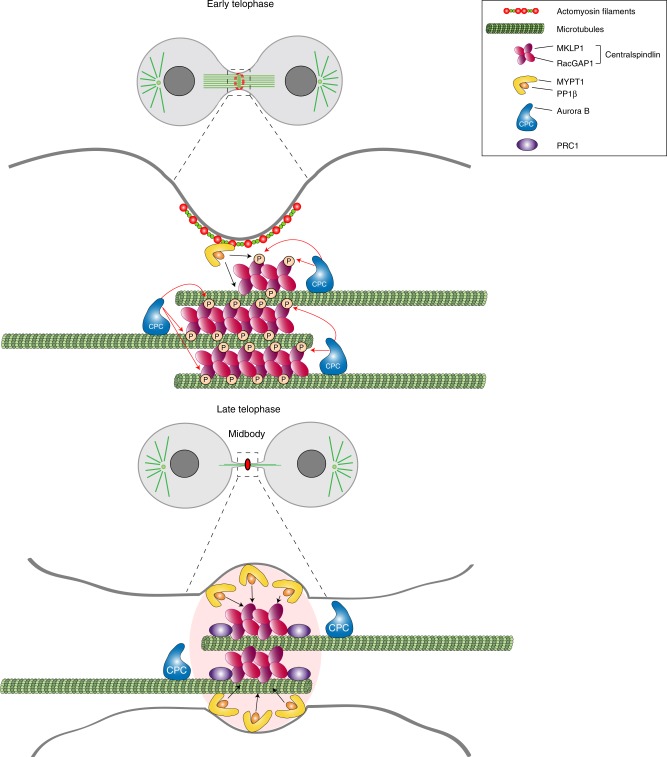
The midbody is an organelle assembled at the intercellular bridge between the two daughter cells at the end of mitosis. It controls the final separation of the daughter cells and has been involved in cell fate, polarity, tissue organization, and cilium and lumen formation. Here, we report the characterization of the intricate midbody protein-protein interaction network (interactome), which identifies many previously unknown interactions and provides an extremely valuable resource for dissecting the multiple roles of the midbody. Initial analysis of this interactome revealed that PP1β-MYPT1 phosphatase regulates microtubule dynamics in late cytokinesis and de-phosphorylates the kinesin component MKLP1/KIF23 of the centralspindlin complex. This de-phosphorylation antagonizes Aurora B kinase to modify the functions and interactions of centralspindlin in late cytokinesis. Our findings expand the repertoire of PP1 functions during mitosis and indicate that spatiotemporal changes in the distribution of kinases and counteracting phosphatases finely tune the activity of cytokinesis proteins.


Conflict of interest statement

The authors declare no competing interests.

Figures

Fig. 1
Fig. 1
CIT-K specifically interacts with a multitude of proteins in cytokinesis. a Western blot analysis of protein extracts from HeLa cells stably expressing a CIT-K::AcGFP transgene synchronized at different stages of the cell cycle. The blots were probed with antibodies against the proteins indicated to the right. Numbers on the left indicate the size, in kDa, of the protein ladder. b Proportional Venn diagram showing the number of proteins identified at each cell cycle stage by AP-MS using CIT-K::AcGFP as bait. c Midbodies purified from HeLa S3 cells treated with siRNAs directed against either a random sequence (control) or CIT-K were fixed and stained to detect tubulin, CIT-K, and MKLP1. Scale bars, 5 µm. d Logarithmic normalized protein ratios from two independent SILAC experiments were plotted against each other. Each point represents a single protein identified. Gray dots correspond to proteins that did not show any significant difference in abundance between control and CIT-K siRNA midbodies. Red and blue dots represent proteins that were either significantly enriched or less abundant after CIT-K depletion in both biological replicates (p value < 0.01; significance B test corrected by Benjamini-Hochberg method). e Western blot analysis of total protein extracts and midbodies purified from telophase HeLa S3 cells treated with siRNAs directed against either a random sequence (control) or CIT-K. The blots were probed with antibodies against the proteins indicated to the right. Numbers on the left indicate the size, in kDa, of the protein ladder. Source data for Fig. 1a and e are provided as a Source Data file
Fig. 2
Fig. 2
The midbody proteome and interactome share many proteins and have similar GO enrichment profiles. a Proportional Venn diagram showing the number of proteins identified in the midbody proteome and interactome. The majority of midbody proteome proteins (62.9%) are contained in the midbody interactome. b Heat map showing the GO annotation enrichment profiles of the midbody proteome and of the midbody interactome. GO enrichment profiles were analyzed using PANTHER under the category GO-slim biological process. Overrepresented GO terms are shown in shades of red while underrepresented GO terms are shown in shades of blue, according to their fold enrichment as indicated in the color scale bar at the right. Only Bonferroni-corrected results for p < 0.05 were considered (see Supplementary Data 5)
Fig. 3
Fig. 3
The midbody interactome comprises common and specific networks. a Diagram illustrating the entire midbody interactome. Baits are indicated with blue hexagons, while preys are represented as ovals, either in green, if they were also found in the midbody proteome, or in orange. The edges connecting the network nodes are colored according to their Mascot scores as indicated in the color scale bar at the top left. Preys shared by multiple baits are clustered in the center. b Enlargement of the Anillin-specific sub-network shown in the corresponding inset in a. c Enlargement of the baits shared specifically by CIT-K and KIF4 shown in the corresponding inset in a. d Diagram representing the phosphorylation sub-network. All nodes are labeled with their primary gene names according to the UniProt database (https://www.uniprot.org)
Fig. 4
Fig. 4
PP1 phosphatases localize to the midbody and depletion of PP1β and MYPT1 causes cytokinesis failure. ad HeLa cells were fixed and stained to detect to detect DNA (blue in the merged panels), tubulin, and PP1α (a), PP1β (b), PP1γ (c), and MYPT1 (d). For RNAi depletions, HeLa cells were treated with siRNAs directed against each of the three PP1 catalytic subunits or MYPT1 and after 48 h were fixed and stained to detect the same epitopes as described above. DNA condensation and shape and thickness of microtubule bundles at the intercellular bridge were used as criteria to stage telophase cells. Insets show a 3× magnification of the midbody. Scale bars, 10 µm. e HeLa Kyoto cells were treated with siRNAs directed against either a random sequence (control) or each of the three PP1 catalytic subunits (left) or MYPT1 (right) and after 48 h proteins were extracted and analyzed by western blot to detect the indicated proteins. The numbers on the left indicate the sizes in kDa of the molecular mass marker. f HeLa cells were treated with siRNAs directed against either a random sequence (control) or MYPT1 and after 48 h were fixed and stained to detect DNA, tubulin, and di-phosphorylated MRLC. Note that MYPT1 siRNA cells show abnormal cell and nuclear shape, cortical blebs (arrowheads) and disorganized microtubule and actomyosin cytoskeletal filaments. Scale bars, 10 µm. g HeLa cells were treated with siRNAs directed against either a random sequence (control) or MYPT1 and after 48 h were fixed and stained to detect DNA and tubulin. The arrows indicate multinucleate cells. Scale bars, 10 µm. h Quantification of multinucleate cells obtained after siRNA of the three PP1 catalytic subunits or MYPT1. More than 500 cells were counted in n ≥ 3 independent experiments. Bars indicate standard errors. *p < 0.05, **p < 0.01 (Mann–Whitney U test). Source data for Fig. 4e and h are provided as a Source Data file
Fig. 5
Fig. 5
MYPT1 siRNA increases the levels of phosphorylated MRLC, but does not impair furrowing and dephosphorylation during mitotic exit. a HeLa cells were treated with siRNAs directed against either a random sequence (control) or MYPT1 and after 48 h were fixed and stained to detect DNA (blue in the merged panels), tubulin, and di-phosphorylated MRLC pT18 pS19. DNA condensation and the shape and thickness of microtubule bundles at the intercellular bridge were used as criteria to stage telophase cells. Insets show a 3× magnification of the midbody. Scale bars, 10 µm. b Time course analysis of protein expression and phosphorylation during mitotic exit after MYPT1 depletion. HeLa cells were treated with siRNAs directed against either a random sequence (control) or MYPT1 and after 24 h synchronized by thymidine/nocodazole block. Cells were collected at the indicate time points after nocodazole (noc) release and proteins extracted and used in western blot analysis to identify the proteins and phospho-epitopes indicated to the right. The numbers on the left indicate the sizes of the molecular mass marker. Source data for Fig. 5b are provided as a Source Data file
Fig. 6
Fig. 6
MYPT1 is required for central spindle stability and midbody architecture. a Images from time-lapse recordings of HeLa Kyoto cells expressing GFP::tubulin and H2B::mCherry treated with control siRNAs or MYPT1 siRNA for 30 h before filming. Time is in min relative to anaphase onset. The arrow in the 90 min control cell marks the abscission site, while the arrowhead in the 144 min MYPT1 siRNA cell marks the rupture of the central spindle. Scale bar, 10 µm. b Graph showing the frequency of phenotypes observed in the time-lapse recordings described in a. Categories: no abscission indicates cells that either failed abscission or failed to fully separate during filming (Supplementary Movie 7); early failure indicates cells that failed to form a midbody and cleavage furrows collapsed (Supplementary Movie 8); broken central spindles indicates cells in which the central spindle broke before abscission occurred, like in the cell shown in a and in Supplementary Movie 6; n = 59 independent control cells and n = 52 MYPT1 siRNA independent cells were counted. c Scatter plots showing quantification of furrow ingression (from anaphase onset to furrow completion); n = 57 independent control cells and n = 46 MYPT1 siRNA independent cells were counted. Abscission (from furrow completion to abscission) times measured in the time-lapse recordings described in a. n = 57 independent control cells and n = 19 MYPT1 siRNA independent cells that successfully completed abscission were counted. Horizontal bars indicate medians; ****p < 0.0001 (student’s T-test); *p < 0.05 (Mann–Whitney U test). dh HeLa Kyoto cells (control) or MYPT1 siRNA were stained to detect the indicated epitopes and DNA. DNA condensation and the size of microtubule bundles at the intercellular bridge were used to stage telophase cells. Insets show a 3× magnification of the midbody. The arrow in d marks a bend in the central spindle. Scale bars, 10 µm. i Electron micrographs of midbodies in HeLa cells control or MYPT1 siRNA for 48 h. n = 23 independent control cells and n = 25 MYPT1 siRNA independent cells. The arrowhead marks an abnormal protrusion of the midbody matrix (MM). Scale bars, 1 µm. Source data for Fig. 6b, c are provided as a Source Data file
Fig. 7
Fig. 7
PP1β dephosphorylates MKLP1 at S708 in cytokinesis. a HeLa Kyoto cells were treated with control or MYPT1siRNA for 48 h and stained to detect the indicated epitopes. Cells were staged as in Fig. 4. Insets indicate 3× magnification of the midbody. Scale bars, 10 µm. b Quantification of total and pS708 MKLP1 in control and MYPT1siRNA cells. The boxes indicate the first quartile to the third quartile, the horizontal lines the median and the whiskers the minimum or maximum. AU, arbitrary unit; n = 32 independent control cells and n = 35 MYPT1 siRNA independent cells for MKLP1 stained cells; n = 38 independent control cells and n = 42 MYPT1 siRNA independent cells for MKLP1-pS708 stained cells; p values from student’s T-test. c HeLa stably expressing GFP-MKLP1 were treated with control or MYPT1 siRNA, synchronized in telophase and GFP pull-down protein extracts analyzed by western blot. The numbers indicate the sizes of the molecular mass marker. d Schematic diagram of MKLP1 protein. The Aurora B phosphorylation site and the VQF PP1-binding site are indicated. e MBP-tagged MKLP1, MKLP1AQA or MBP alone were co-expressed in yeast and used for MBP pull-down assay. Extracts and pull downs were analyzed by western blot to detect GST and MBP. Numbers indicate the size of the protein ladder. f In vitro phosphatase assay of GST-tagged WT and AQA MKLP1. The reactions were incubated with either MBP-tagged PP1β or a catalytically dead version for the times indicated at the top and analyzed by western blot using antibodies against MKLP1 pS708 and GST. g Graph showing the normalization of MKLP1 pS708 values against the amounts of GST-MKLP1620–858. h HeLa Kyoto cells stably expressing GFP-MKLP1, GFP-MKLP1AQA or no transgene were treated with either control or MKLP1 3′UTR siRNA were stained to detect the indicated epitopes. Scale bars, 10 µm. i Quantification of multinucleate cells from the experiments shown in h. More than 500 independent cells were counted in n ≥ 3 independent experiments. Bars indicate standard errors. *p < 0.05, **p < 0.01, ***p < 0.001 (Mann–Whitney U test). Source data for Fig. 1b-c, e–g and i are provided as a Source Data file
Fig. 8
Fig. 8
Model of regulation of centralspindlin by Aurora B and MYPT1-PP1β during cytokinesis. During furrowing (top panel) MYPT1-PP1β accumulates at the cortex with no or very limited access to the centralspindlin pool that localizes to the central spindle midzone, which is highly phosphorylated by Aurora B and therefore can form clusters. After completion of furrow ingression, MYPT1/PP1β accumulates at the midbody ring whereas Aurora B localizes to the midbody arms (bottom panel). This allows PP1β to de-phosphorylate MKLP1 at S708, which could strengthen the association of centralspindlin with PRC1. See text for more details

References

    1. D’Avino PP, Giansanti MG, Petronczki M. Cytokinesis in animal cells. Cold Spring Harb. Perspect. Biol. 2015;7:a015834. doi: 10.1101/cshperspect.a015834. - DOI - PMC - PubMed
    1. Douglas ME, Mishima M. Still entangled: assembly of the central spindle by multiple microtubule modulators. Semin Cell Dev. Biol. 2010;21:899–908. doi: 10.1016/j.semcdb.2010.08.005. - DOI - PubMed
    1. Nasa I, Kettenbach AN. Coordination of protein kinase and phosphoprotein phosphatase activities in mitosis. Front Cell Dev. Biol. 2018;6:30. doi: 10.3389/fcell.2018.00030. - DOI - PMC - PubMed
    1. D’Avino PP, Capalbo L. Regulation of midbody formation and function by mitotic kinases. Semin Cell Dev. Biol. 2016;53:57–63. doi: 10.1016/j.semcdb.2016.01.018. - DOI - PubMed
    1. Mierzwa B, Gerlich DW. Cytokinetic abscission: molecular mechanisms and temporal control. Dev. Cell. 2014;31:525–538. doi: 10.1016/j.devcel.2014.11.006. - DOI - PubMed

Publication types

MeSH terms