

A Phospholipid Profile at 4 Months Predicts the Onset of Celiac Disease in at-Risk Infants
- PMID: 31586100
- PMCID: PMC6778072
- DOI: 10.1038/s41598-019-50735-7
A Phospholipid Profile at 4 Months Predicts the Onset of Celiac Disease in at-Risk Infants
Abstract
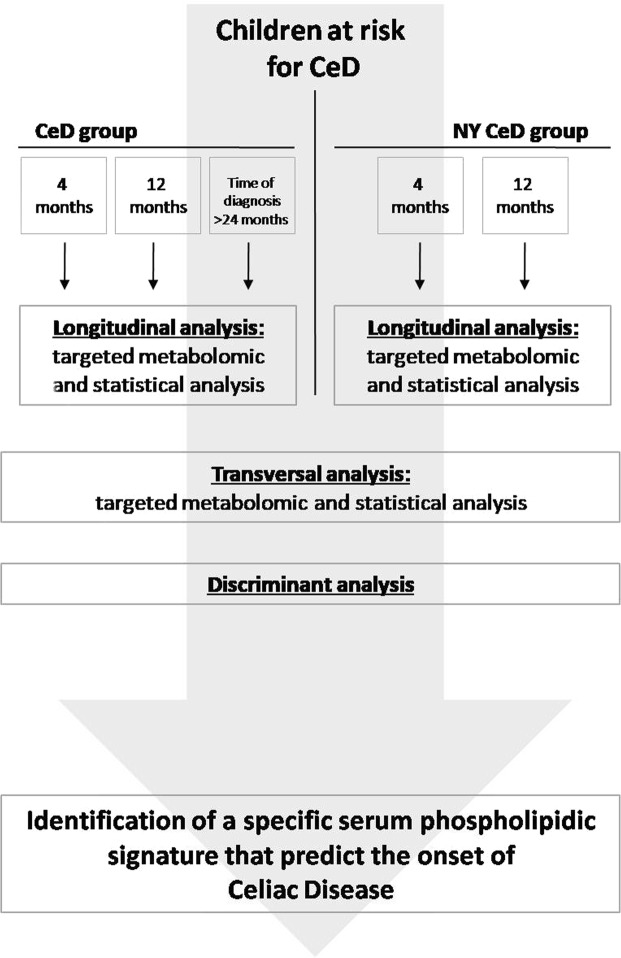
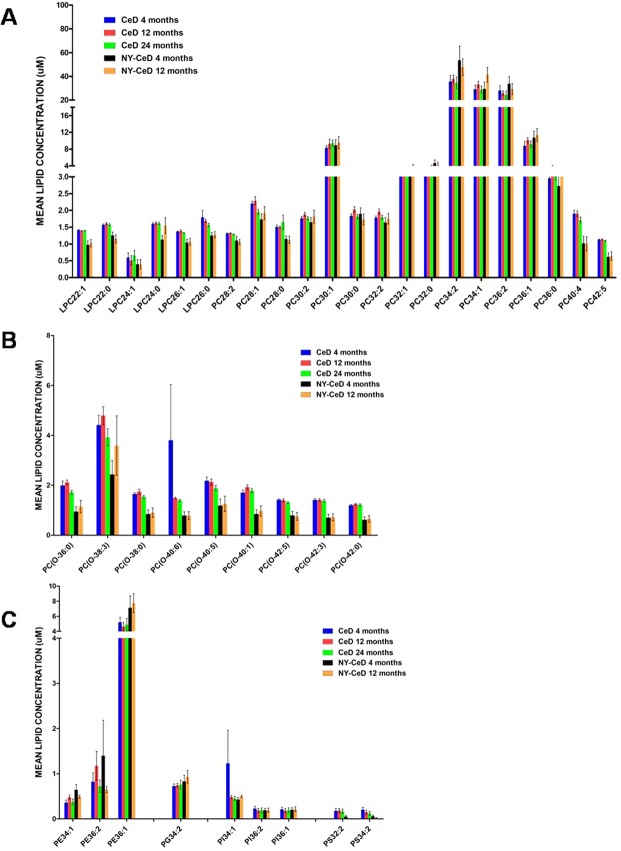
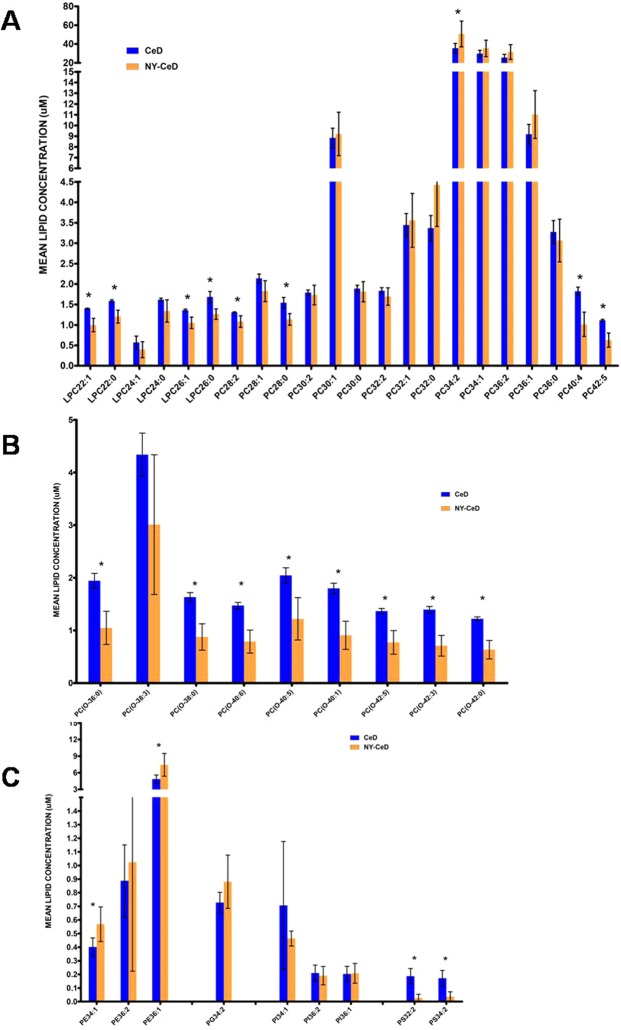
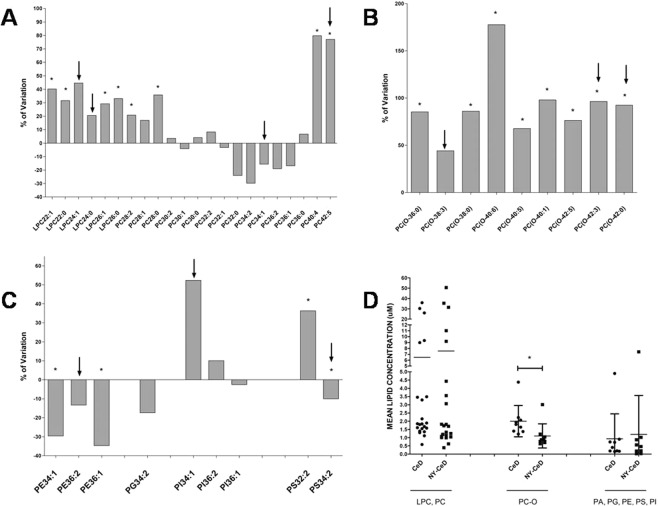
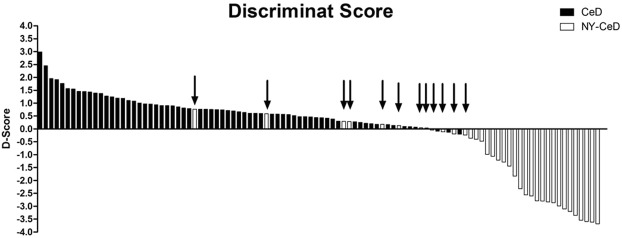
Celiac disease (CeD) is a multifactorial disease influenced by both genetic and environmental risk factors. CeD genetic components are mainly due to HLA class II genes, which account for approximately 40% of the disease heritability. The environmental factor is linked to gliadin ingestion. Despite genetic and epigenetic studies, the pathological molecular mechanism remains unclarified. The strong genetic component does not explain more than half of the hereditability; we identified several epigenetic features that contribute to the understanding of the missing hereditability. The lipid profile of infants has been proposed as a potential biomarker of CeD metabolism that can be measured before they exhibit developmental disorders and clinical symptoms. We suggest that the state of the host is a main factor for the abnormal immune response to gluten. Long before any exposure to the offending agent or any production of specific antibodies, several molecular mechanisms are differentially expressed in infants who will develop CeD compared to their peers matched for the same genetic profile. The present study explored the serum phospholipid profile of a group of infants at risk for celiac disease, followed up to 8 years to monitor the onset of CeD. We compared 30 patients who developed the disease with 20 age- and sex-matched peers with similar genetic profiles who did not develop the disease within 8 years. Serum phospholipids were analysed at 4 months, before exposure to gluten, and at 12 months of age, when none showed any marker of disease. In the 30 CeD patients, we also analysed the serum at the time of diagnosis (>24 months). The serum phospholipid profile was fairly constant across 4 and 12 months of age and, in CeD, up to 24-36 months. The phospholipid signature was dramatically different in infants who developed CeD when compared to that of control NY-CeD (Not Yet developing Celiac Disease) peers. We identified a specific serum phospholipid signature that predicts the onset of celiac disease in HLA at-risk infants years before the appearance of antibodies specific for CeD in the serum and before any clinical symptoms, even before gluten introduction into the diet at 4 months. Specifically, lysophosphatidylcholine, phosphatidylcholine, alkylacyl-phosphatidylcholine, phosphoethanolamines, phosphatidylserines, phosphatidylglycerol and phosphatidylinositol were found to be differentially represented in CeD versus NY-CeD. A set constituted by a limited number of alkylacyl-phosphatidylcholine and lyso-phosphatidylcholine, together with the duration of breast-feeding, allows the discrimination of infants who develop celiac disease before 8 years of age from those at a similar genetic risk who do not develop the disease. In addition to recent discovery, our paper unveiled a specifc phopholipid profile, able to discriminate infants who eventually develop celiac disease years before antibodies or clinical symptoms ensue.
Conflict of interest statement
The authors have no competing interests as defined by Nature Publishing Group, or other interests that might be perceived to influence the results and/or discussion reported in this paper.
Figures
References
Publication types
MeSH terms
Substances
LinkOut - more resources
Full Text Sources
Other Literature Sources
Medical
Research Materials
