. 2019 Oct 4;10(1):4529.
doi: 10.1038/s41467-019-12420-1.

3D extracellular matrix microenvironment in bioengineered tissue models of primary pediatric and adult brain tumors

Affiliations

3D extracellular matrix microenvironment in bioengineered tissue models of primary pediatric and adult brain tumors

Disha Sood et al. Nat Commun. .

Abstract

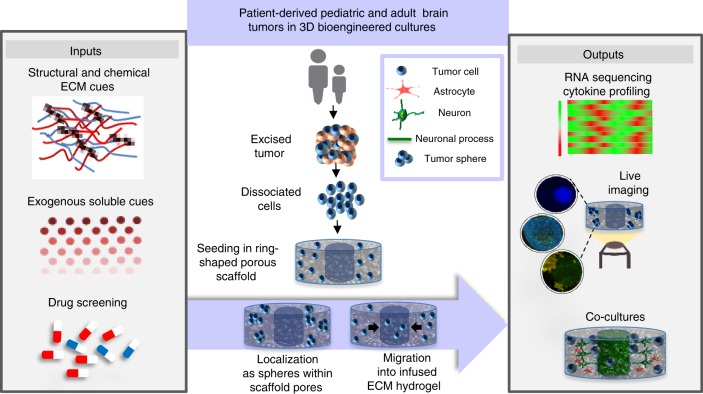
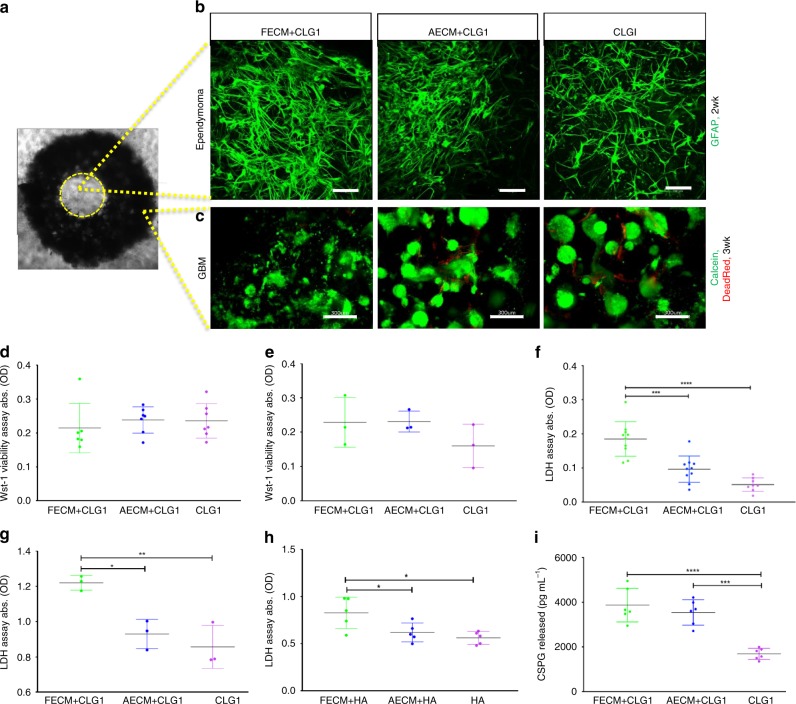
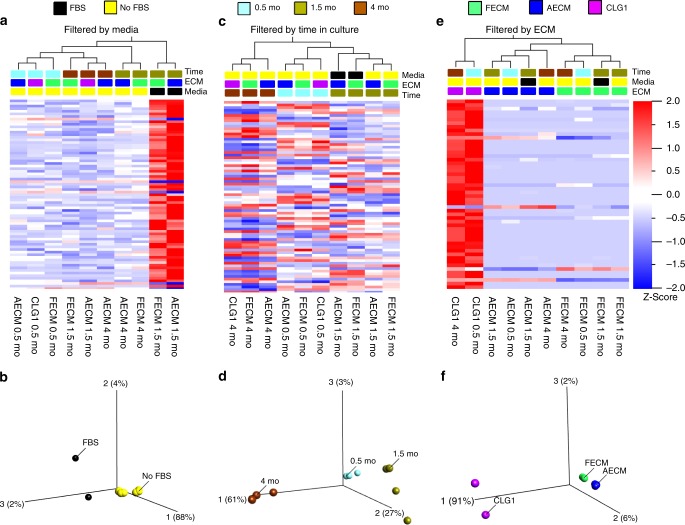
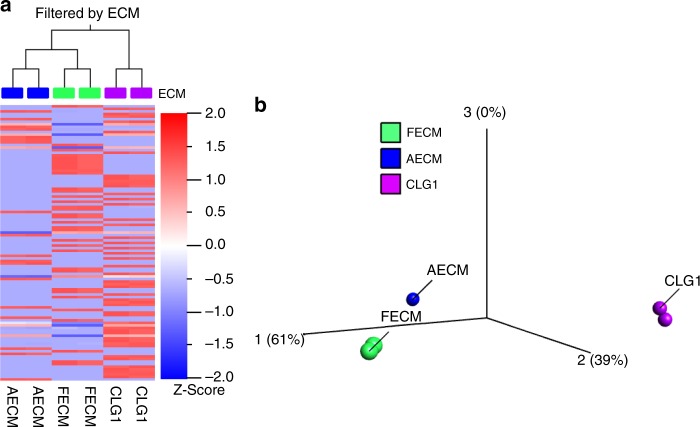
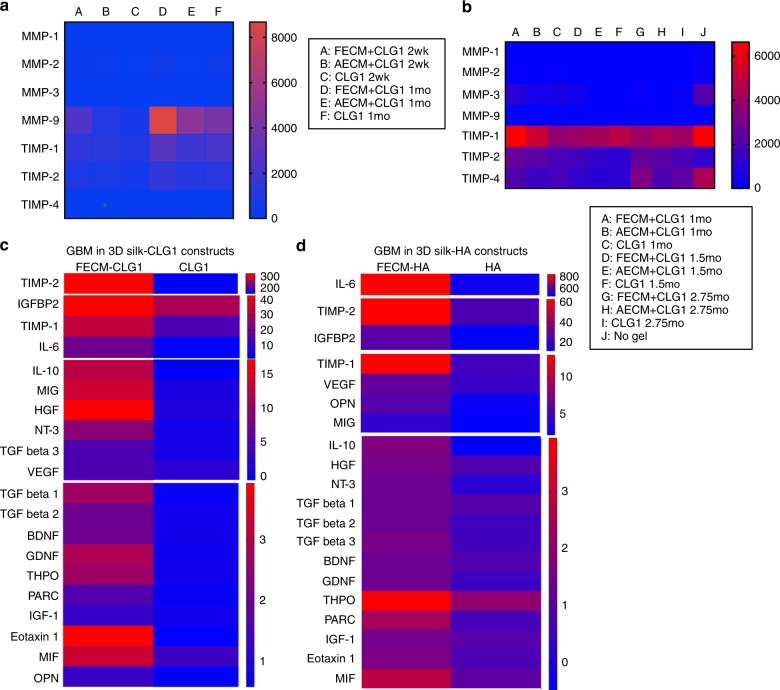
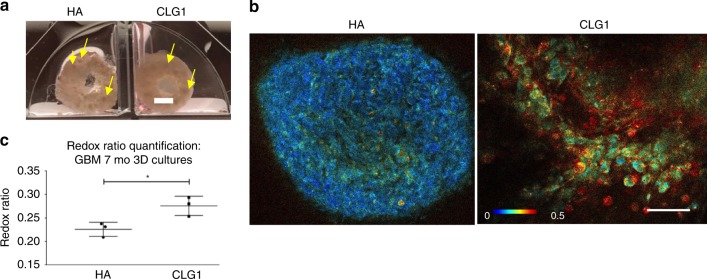
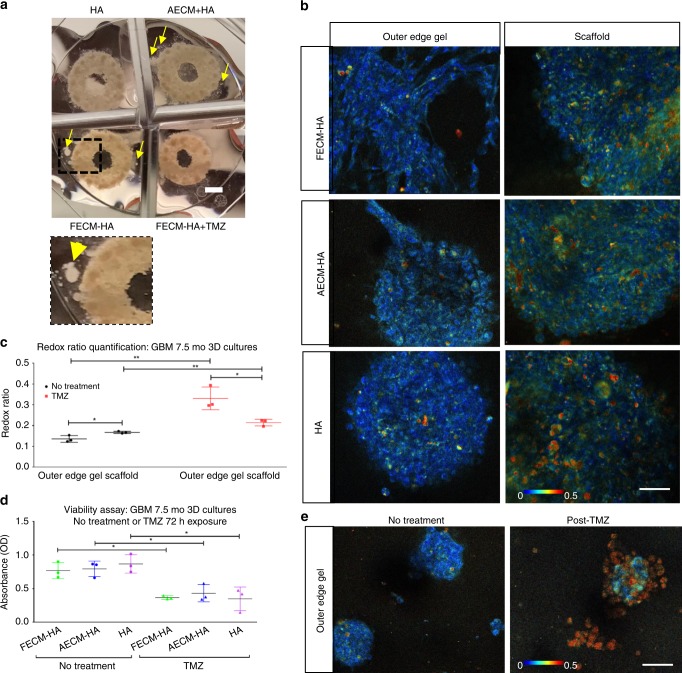
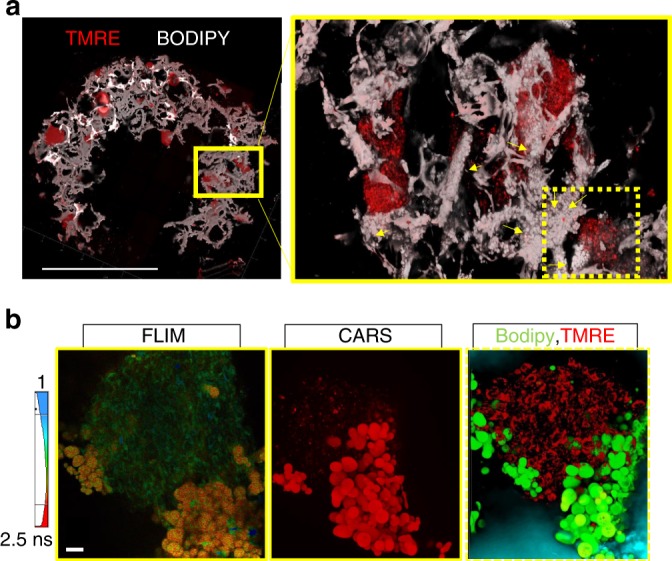
Dynamic alterations in the unique brain extracellular matrix (ECM) are involved in malignant brain tumors. Yet studies of brain ECM roles in tumor cell behavior have been difficult due to lack of access to the human brain. We present a tunable 3D bioengineered brain tissue platform by integrating microenvironmental cues of native brain-derived ECMs and live imaging to systematically evaluate patient-derived brain tumor responses. Using pediatric ependymoma and adult glioblastoma as examples, the 3D brain ECM-containing microenvironment with a balance of cell-cell and cell-matrix interactions supports distinctive phenotypes associated with tumor type-specific and ECM-dependent patterns in the tumor cells' transcriptomic and release profiles. Label-free metabolic imaging of the composite model structure identifies metabolically distinct sub-populations within a tumor type and captures extracellular lipid-containing droplets with potential implications in drug response. The versatile bioengineered 3D tumor tissue system sets the stage for mechanistic studies deciphering microenvironmental role in brain tumor progression.


Conflict of interest statement

The authors declare no competing interests.

Figures

Fig. 1
Fig. 1
Versatile 3D bioengineered brain tumor tissue model. Multi-level interrogation into the role of extracellular matrix and microenvironment on tumor growth. Middle panel—Tumor cells seeded as single cells post dissociation from the excised tumor, migrate as single cells towards the central hydrogel window or revert back to sphere-like morphology within the scaffold depending on original tumor characteristics. Left panel—Introduction of suitable ECM and soluble cues to maintain tumor characteristics and drug screening. Right panel—Multiscale interrogation of the culture system via transcriptomic and genomic profiling, and live metabolic imaging. Co-culture of tumor cells with healthy differentiated human neural stem cells (hNSCs)
Fig. 2
Fig. 2
Patient-derived anaplastic ependymoma and glioblastoma in silk scaffold-based 3D constructs. a Brightfield image of donut-shaped silk scaffold seeded with tumor cells and infused with hydrogel. Systems infused with either collagen I (CLG1) or hyaluronic acid (HA) hydrogels supplemented with porcine brain-derived ECM (Fetal ECM: FECM, Adult ECM: AECM), cultured in chemically defined media lacking FBS. The middle circular window indicated by the yellow outline demarcates a distinct region within the construct that is exclusively hydrogel filled and not initially seeded with cells but where tumor cells can migrate. b Migration of anaplastic ependymoma cells at 2 week shown by GFAP staining within the middle hydrogel window of the 3D donut-shaped constructs. Presence of GFAP-positive glial cells matched histopathology reports. Scale bar, 100 μm, Max projection of z-stack imaged in Leica SP8 confocal. c Growth of glioblastoma (GBM) at 3 week shown by live calcein and dead red staining within the ring portion of the 3D donut-shaped constructs. GBM grew more as spheres and did not infiltrate the middle window at earlier time points in CLG1-based hydrogels. Scale bar, 300 μm, Max projection of z-stack imaged in Leica SP8 confocal. Wst-1 viability assay at 2 week in 3D ependymoma d and 1.5 mo GBM e silk-CLG1 cultures, respectively indicating similar viability across all ECM conditions. f Lactate dehydrogenase (LDH) release assay at 2 week in 3D ependymoma cultures. Statistically significant difference in the LDH release in FECM condition in comparison to AECM or CLG1 alone. g LDH release assay at 1.5 mo in 3D GBM silk-CLG1 cultures, showing statistically significant (higher) LDH release in FECM condition assuming a Gaussian distribution. h LDH release assay in 3D GBM silk-HA cultures, showing statistically significant (higher) LDH release in FECM condition at 1 mo. i Chondroitin sulfate proteoglycan (CSPG) release observed to be statistically significant (higher) in the FECM and AECM containing constructs at 3 week in 3D ependymoma cultures. Ordinary one-way ANOVA with Tukey’s post-hoc, F > 6.958, *p < 0.0412, **p = 0.0056, ***p = 0.0001, ****p < 0.0001. Error bars indicate mean ± s.d, Source data are provided as a Source Data file
Fig. 3
Fig. 3
RNA-sequencing data for anaplastic ependymoma 3D bioengineered cultures. ac Heatmap along with cluster dendrograms focusing on time in culture, media type and extracellular matrix categories, respectively, generated using FPKM (Reads Per Kilobase of transcript per Million mapped reads) values with a false discovery rate q < 0.2 or p-values < or = 0.005. df Principal component analysis (PCA) plots corresponding to a, b and c clustering, respectively. FECM- Fetal ECM + collagen I, AECM- Adult ECM + Collagen I, CLG1-Collagen I. ab: False discovery rate (q) = 0.04, p-value = 0.001; c/d: q = 0.04, p = 0.005; ef: q = 0.2, p = 0.0002; n = 1 per condition. Source data are provided as Supplementary Data 1
Fig. 4
Fig. 4
RNA-sequencing data for glioblastoma 3D bioengineered cultures. a Heatmap along with clustering based on extracellular matrix generated using FPKM (Reads Per Kilobase of transcript per Million mapped reads) values. b Principal component analysis (PCA) plot. FECM- Fetal ECM + collagen I, AECM- Adult ECM + Collagen I, CLG1-Collagen I. False discovery rate (q) = 0.04, p-value = 0.00008; n = 2 per condition Source data are provided as Supplementary Data 1
Fig. 5
Fig. 5
Cytokine and MMP/TIMP media profiling from 3D bioengineered cultures. a MMP/TIMP release profile (reported in pg mL−1) of 3D ependymoma cultures infused with CLG1-based hydrogels. n = 5 pooled samples per condition. b MMP/TIMP release profile (reported in pg mL−1) of 3D GBM cultures infused with CLG1-based hydrogels alongside 3D GBM constructs with no hydrogel added. n = 5 pooled samples per condition. c Cytokine release profile at 1 mo of 3D GBM cultures infused with CLG1-based hydrogels (reported as fold change over control media). n = 7 pooled samples per condition. d Cytokine release profile at 6.5 mo of 3D GBM cultures infused with HA-based hydrogels at 5.5 mo time point (reported as fold change over control media). n = 5 pooled samples per condition. Supplementary Table 1 lists the full forms of the cytokine abbreviations. Source data are provided as a Source Data file
Fig. 6
Fig. 6
Live metabolic imaging of glioblastoma cultured in 3D silk-CLG1 or silk-HA constructs. a Macroscopic views of the GBM spheres within silk-CLG1 or silk-HA constructs. Scale bar, 2 mm. The yellow arrows point at spontaneously forming sphere-like structures from the seeded tumor cells post dissociation. b Representative redox ratio images from endogenous metabolic co-factors FAD and NADH within GBM cells in 3D constructs at 1.5 mo post-gel addition and 7 mo post cell seeding. Scale bar, 50 µm. Image heatmap reflects varying redox ratio intensities. c Quantitative intracellular signal evaluation validated the existence of metabolic differences between HA and CLG1 conditions, with a statistically significantly higher redox ratio (FAD/FAD + NADH) in CLG1 cultures. Unpaired two-tailed t-test, p = 0.0271, df = 4, t = 3.406, n = 3 per condition (Multiple areas imaged per condition = 3–8; total imaged in CLG1 = 13, HA = 19). Error bars indicate mean ± s.d, Source data are provided as a Source Data file
Fig. 7
Fig. 7
Live metabolic imaging of glioblastoma cultured in 3D silk-HA-ECM constructs. a Macroscopic views of the GBM spheres within silk-HA-ECM constructs, post- DMSO (no treatment control) or temozolomide (TMZ) exposure. Scale bar, 2 mm. b Representative redox ratio images from endogenous metabolic co-factors FAD and NADH within GBM cells in 3D silk-HA constructs at 2 mo post-gel addition and 7.5 mo post cell seeding, with right panel showing images taken within the scaffold portion and left panel with images taken in the outer edge gel of the construct, respectively. Scale bar, 50 µm. Image heatmap is the same for panel images and reflects varying redox ratio intensities. c Redox ratio quantification corresponding to outer edge gel areas and within scaffold areas, post-DMSO or TMZ exposure. Unpaired two-tailed t-tests between separate pairs; n = 3 per condition (multiple areas imaged per condition),**p < 0.0081, *p < 0.0321, df = 4, t > 3.228. d Wst-1 bulk viability assay at 7.5 mo in 3D GBM silk-HA cultures post- DMSO and TMZ exposure. Unpaired two-tailed t-test between separate pairs, *p < 0.0221, df = 4, t > 3.635. e Representative redox ratio images within GBM cells in 3D silk-HA constructs at 2 mo post-gel addition and 7.5 mo post cell seeding. 2-photon signals were obtained post- 72 h exposure to either DMSO or TMZ. Scale bar, 50 µm. Error bars indicate mean ± s.d, Source data are provided as a Source Data file
Fig. 8
Fig. 8
Lipid droplets in glioblastoma cultured in 3D silk-HA-ECM constructs. a Spread of individual GBM spheres of varying sizes as indicated by TMRE staining, within the silk-HA constructs and a zoomed in area in the right panel, where droplets are visible as indicated by the yellow arrows. The droplets are white spherical structures against silk scaffold, which is also seen in white corresponding to the fluorescence signal. Stitching and 3D rendering done to obtain the images. Scale bar, 2 mm. b Confirmation of the droplets visible within the silk-HA constructs to be lipid-containing, as indicated by an increased fluorescence lifetime in comparison to GBM cells captured by 2-photon lifetime imaging (leftmost panel, one plane), by CARS signal targeting the C–H stretch shown for droplets (bright red) and cells (faint red) (middle panel), and by BODIPY staining of lipid droplets (green) against GBM cells stained by TMRE (red) captured by confocal imaging. CARS and confocal images are presented as maximal projections of 3D z-stacks to optimize visual contrast. Scale bar, 20 µm

References

    1. Jones C, et al. Pediatric high-grade glioma: biologically and clinically in need of new thinking. Neuro Oncol. 2017;19:153–161. - PMC - PubMed
    1. Qazi MA, et al. Intratumoral heterogeneity: pathways to treatment resistance and relapse in human glioblastoma. Ann. Oncol. 2017;28:1448–1456. doi: 10.1093/annonc/mdx169. - DOI - PubMed
    1. Merchant TE, Pollack IF, Loeffler JS. Brain tumors across the age spectrum: biology, therapy, and late effects. Semin Radiat. Oncol. 2010;20:58–66. doi: 10.1016/j.semradonc.2009.09.005. - DOI - PMC - PubMed
    1. Yu L, et al. A clinically relevant orthotopic xenograft model of ependymoma that maintains the genomic signature of the primary tumor and preserves cancer stem cells in vivo. Neuro Oncol. 2010;12:580–594. doi: 10.1093/neuonc/nop056. - DOI - PMC - PubMed
    1. Phillips JJ. Novel therapeutic targets in the brain tumor microenvironment. Oncotarget. 2012;3:568–575. doi: 10.18632/oncotarget.526. - DOI - PMC - PubMed

Publication types

MeSH terms