. 2020 Feb;26(2):230-241.
doi: 10.1016/j.bbmt.2019.09.030. Epub 2019 Oct 2.

Optimized Timing of Post-Transplantation Cyclophosphamide in MHC-Haploidentical Murine Hematopoietic Cell Transplantation

Affiliations

Optimized Timing of Post-Transplantation Cyclophosphamide in MHC-Haploidentical Murine Hematopoietic Cell Transplantation

Lucas P Wachsmuth et al. Biol Blood Marrow Transplant. 2020 Feb.

Abstract

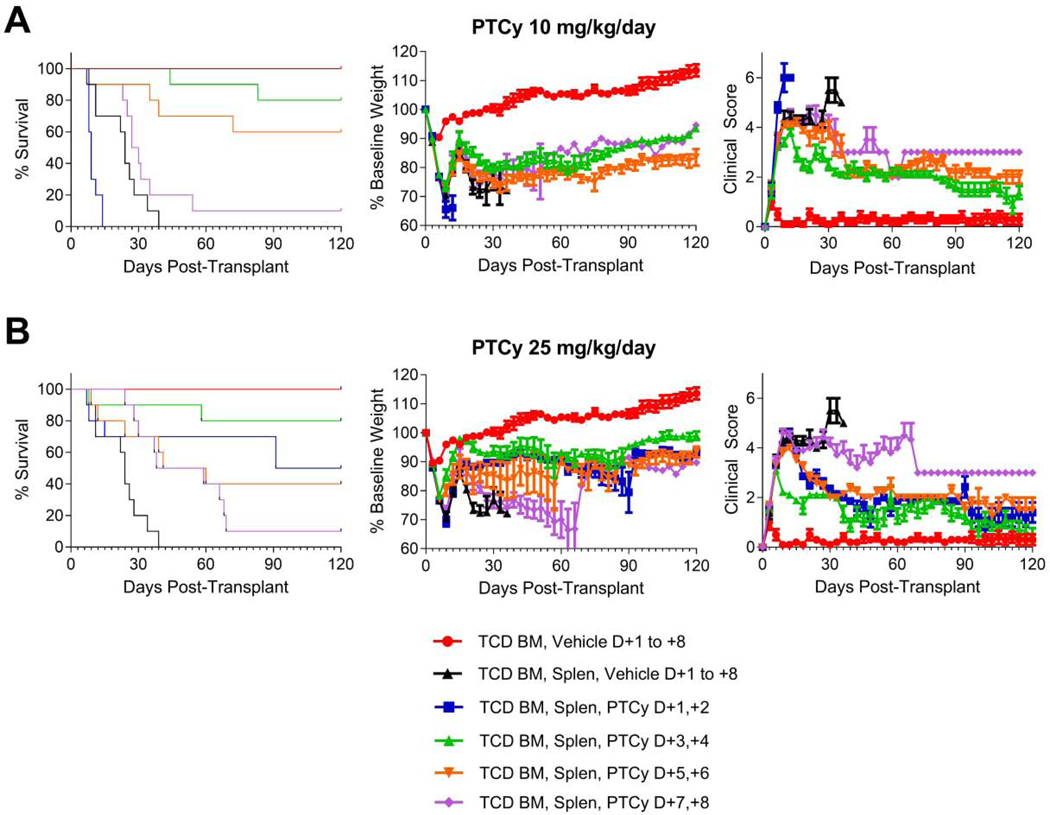
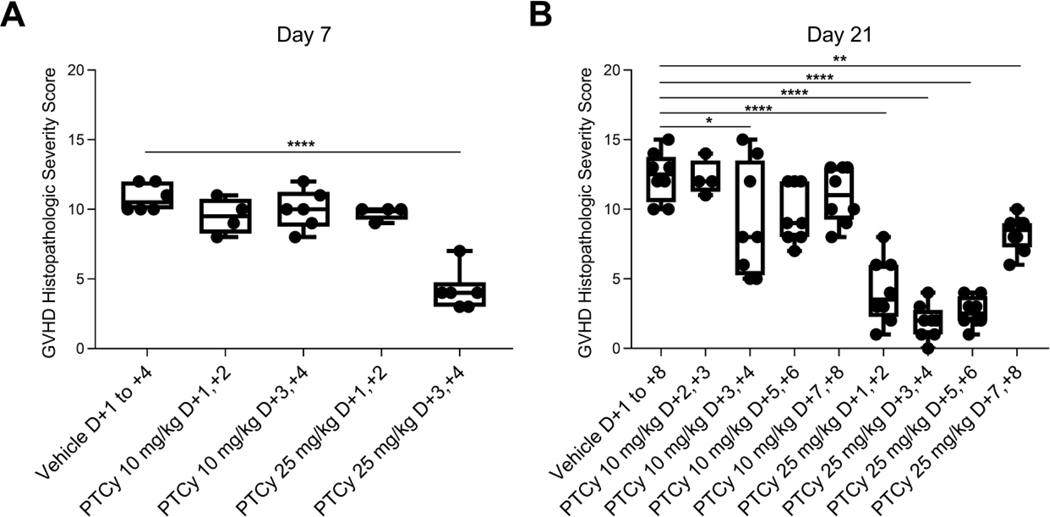
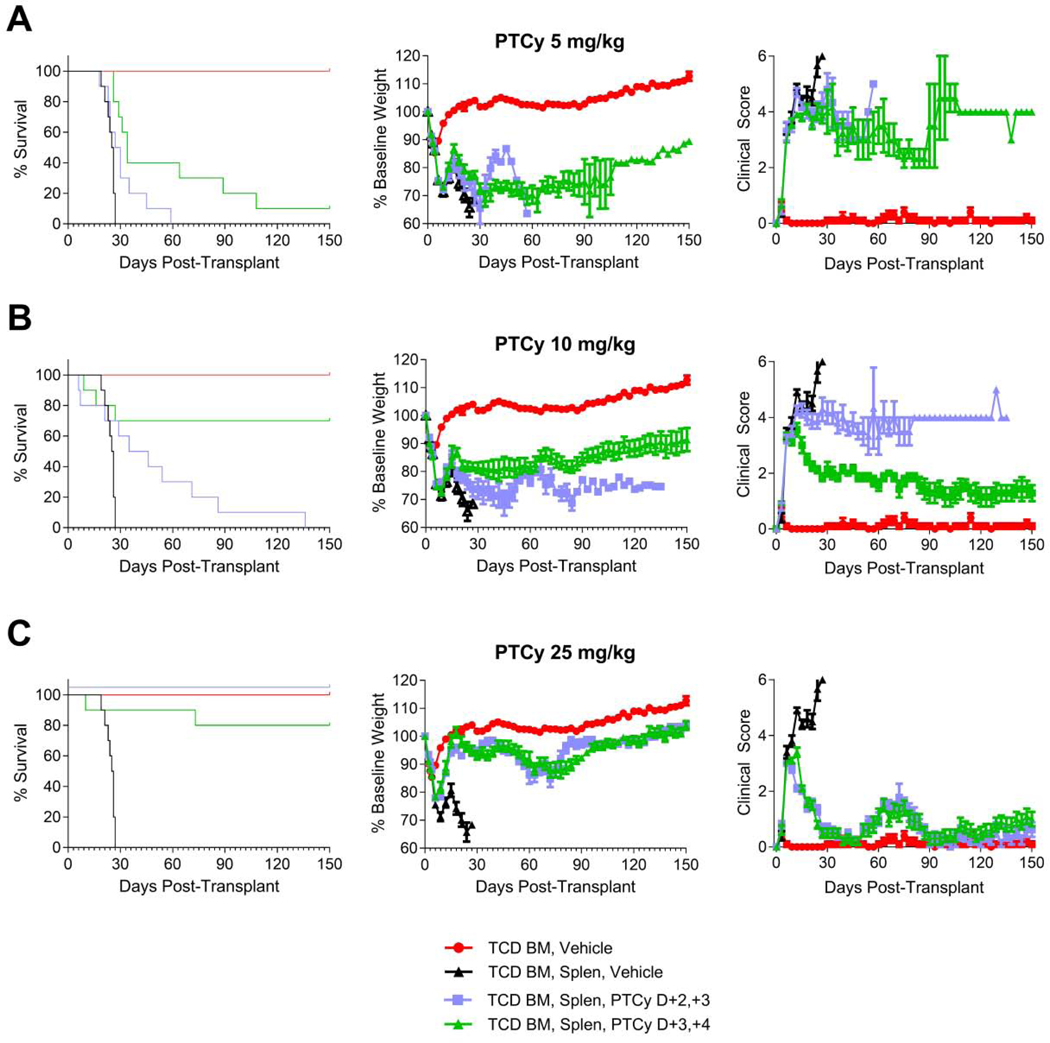
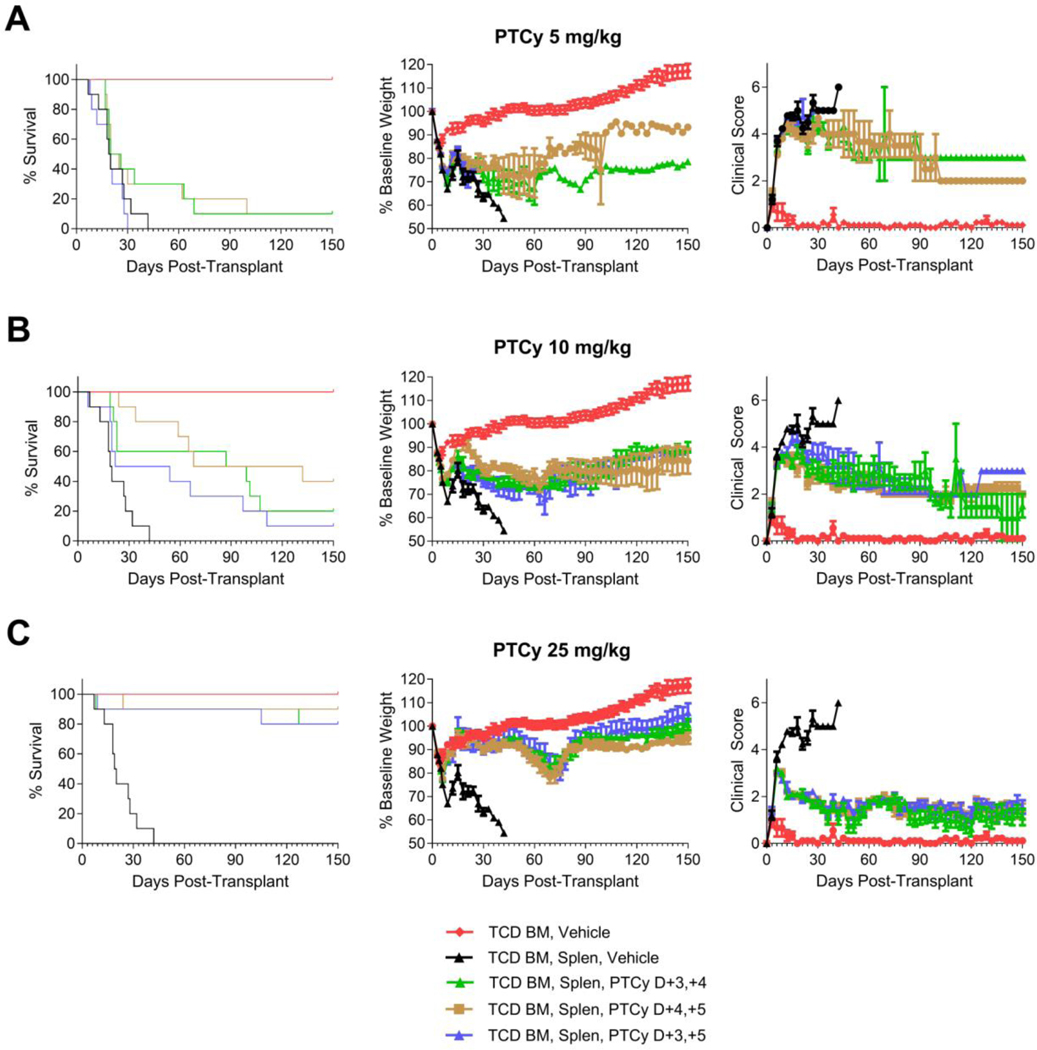
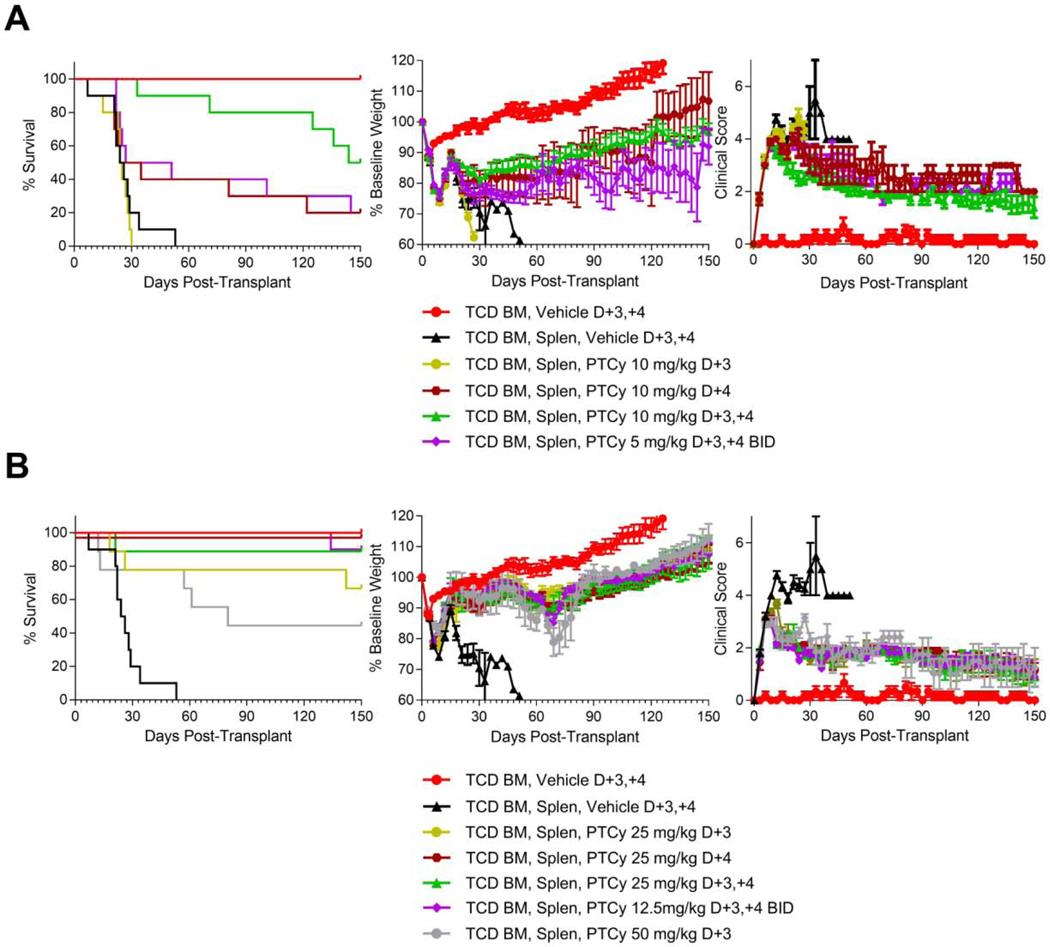
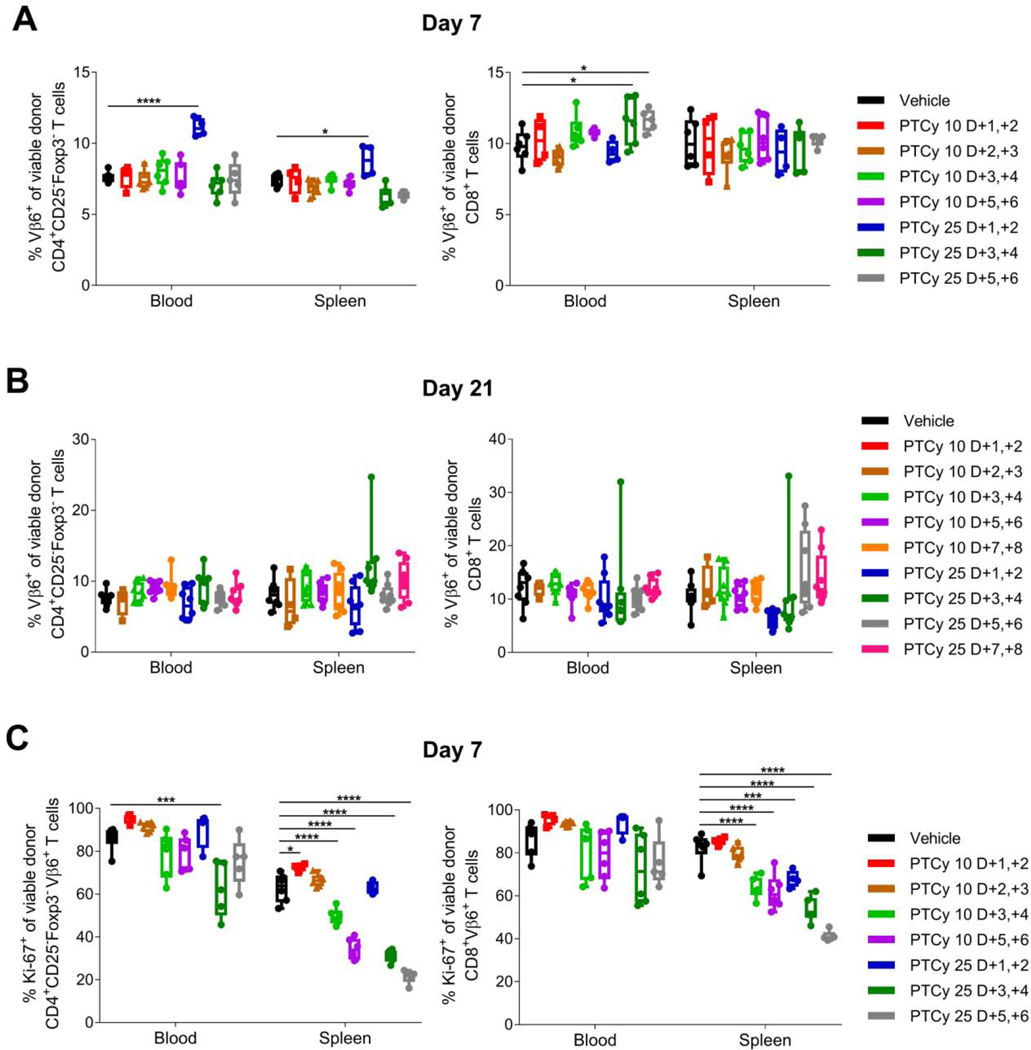
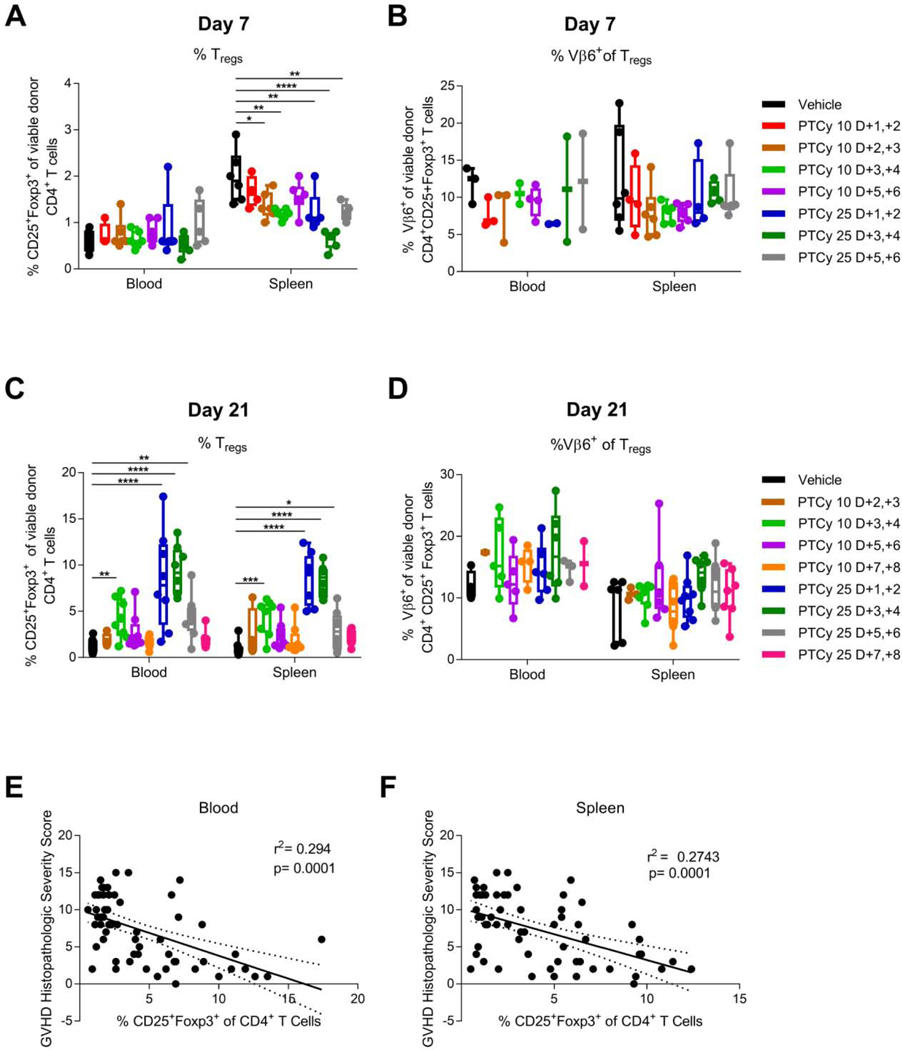
Post-transplantation cyclophosphamide (PTCy) reduces the risks of severe acute and chronic graft-versus-host disease (GVHD) after allogeneic hematopoietic cell transplantation (HCT). Yet, the standard clinical dose and timing of PTCy were partly extrapolated from MHC-matched skin allografting models and were partly empirical. Here we investigated the impact of differential dosing and timing of PTCy on its efficacy in preventing GVHD in a murine MHC-haploidentical HCT model. Administration of PTCy on days +3/+4 was superior to administration on days +1/+2, +5/+6, or +7/+8, whereas low-dose (10 mg/kg/day) PTCy on days +1/+2 actually led to accelerated death. Although the optimal timing of PTCy dosing was day +2 or +3 in the skin allografting models, in our MHC-haploidentical HCT model, PTCy on days +2/+3 was inferior to PTCy on days +3/+4 at lower doses. PTCy administered on days +3/+4, +4/+5, or +3/+5 were similarly efficacious. Single-day versus 2-day dosing schedules demonstrated that PTCy is maximally effective when given on day +4. Flow cytometric analysis showed that optimal PTCy dosing schedules both decreased alloreactive CD4+CD25-Foxp3- T cell proliferation at day +7 and allowed preferential CD4+CD25+Foxp3+ T cell reconstitution at day +21, suggesting that this combination may be a potential predictive biomarker of successful GVHD prevention by PTCy. These results show that the dose, timing, and cumulative exposure of PTCy all are critical for its efficacy in preventing GVHD. We are currently investigating the clinical relevance of these findings in a protocol seeking to optimize PTCy dose and timing and test these T cell endpoints as candidate biomarkers of successful GVHD prevention by PTCy.

Keywords: Alloreactive; Graft-versus-host disease; Haploidentical; Murine; Post-transplantation cyclophosphamide; Regulatory T cell.


Conflict of interest statement

Conflict of interest disclosures: The authors have declared that no conflict of interest exists.

Figures

Figure 1.
Figure 1.. PTCy given on days +3/+4 is superior to days +1/+2, +5/+6, or +7/+8 in preventing GVHD.
B6D2F1 female recipient mice were irradiated to 10.5 Gy in a single fraction and 6–8 hours later received intravenous transplantation of 10 × 106 B6C3F1 T-cell-depleted bone marrow (TCD BM) cells +/− 40 × 106 B6C3F1 splenocytes (Splen). Mice were given PTCy at 10 mg/kg/day or 25 mg/kg/day intraperitoneally on designated days; mice not receiving PTCy received PBS vehicle intraperitoneally on the same days. Mice were followed daily for survival and every 3 days for clinical scores and weights. Statistical comparisons were performed between PTCy treatment groups and the TCD BM, Splen, Vehicle control group and between different PTCy treatment groups. Clinical score and weight comparisons were performed using area under the curve (AUC) comparisons of values from days 0 through +21, after which there were less than 7 mice in the vehicle-treated group. A group of mice receiving TCD BM, Vehicle was included in the experiments as a control, but this group was not included in the statistical analyses. The same TCD BM, Vehicle and TCD BM, Splen, Vehicle control groups are shown in all parts. (A) PTCy given at 10 mg/kg/day on days +3/+4 (HR=0.034, p<0.0001) or days +5/+6 (HR=0.083, p=0.0005) significantly prolonged survival compared with vehicle-treated mice, while 10 mg/kg/day PTCy on days +7/+8 did not significantly prolong survival (HR=0.44, p=0.16) and 10 mg/kg/day PTCy on days +1/+2 actually led to accelerated death (HR=6.3, p=0.0019). Mice receiving 10 mg/kg/day PTCy on days +3/+4 had significantly better weights (p=0.023) and clinical scores (p<0.0001) than vehicle-treated mice and were superior to mice treated with other 10 mg/kg/day PTCy dosing schedules including days +5/+6 (weights, p=0.043; clinical scores, p=0.0003, respectively). (B) 25 mg/kg/day PTCy given over any of the four dosing schedules significantly prolonged survival compared with vehicle (days +1/+2, HR=0.13, p=0.0039; days +3/+4, HR=0.042, p=0.0001; days +5/+6, HR=0.19, p=0.0084; days +7/+8, HR=0.31, p=0.0021). 25 mg/kg/day PTCy on days +3/+4 resulted in significantly better weights and clinical scores than vehicle treatment (p=0.0007 and p<0.0001, respectively). 25 mg/kg/day PTCy on days +1/+2 or +5/+6 did not result in significantly better weights than vehicle-treated mice, but both resulted in significantly better clinical scores (p=0.0018 and p=0.0011, respectively). 25 mg/kg/day PTCy on days +3/+4 had significantly superior clinical scores than all other dosing schedules (p<0.0001 for all three comparisons) and significantly superior weights compared with the days +1/+2 and days +7/+8 groups (p=0.052 against days +5/+6). Combined results are shown for two independent experiments of 5 mice/group/experiment
Figure 2.
Figure 2.. 25 mg/kg/day PTCy on days +3/+4 minimizes histopathologic evidence of GVHD at days +7 and +21.
Mice were transplanted as in Figure 1 with 10 × 106 TCD BM and 40 × 106 splenocytes on day 0 and were given PTCy at various dosing schedules. Mice not receiving PTCy on a given day received PBS vehicle. At day (A) +7 or (B) +21, histopathologic assessment of GVHD was performed. Combined results from two independent experiments are shown. N=6 for all groups in A except for the 10 mg/kg/day PTCy on days +1/+2 and 25 mg/kg/day PTCy on days +1/+2 groups (n=4 each) due to some deaths occurring prior to day +7. N=8 for all groups in B except for the 10 mg/kg PTCy days +2/+3 group (n=4). *p≤0.05, **p≤0.01, ****p≤0.0001 on one-way ANOVA followed by the Holm-Sidak post hoc test using the vehicle-treated group as the control. Only significant results are shown; all other comparisons between treatment groups and the vehicle treatment group are non-significant.
Figure 3.
Figure 3.. PTCy given on days +3/+4 is superior to days +2/+3 for suboptimal doses.
Mice were transplanted as in Figure 1 and were given PTCy on days +2/+3 or +3/+4 at (A) 5 mg/kg/day, (B) 10 mg/kg/day, or (C) 25 mg/kg/day. Mice were given PBS vehicle on days not receiving PTCy. The same TCD BM, Vehicle and TCD BM, Splen, Vehicle control groups are shown in all parts for comparison purposes. Statistical comparisons are between PTCy on days +2/+3 and on days +3/+4. (A) Survival was better for the 5 mg/kg/day PTCy dosing on days +3/+4, although the difference was not statistically significant (HR=2.7, p=0.061). Weight and clinical score AUCs were compared through day +21 and were not significantly different. (B) For the 10 mg/kg/day dosing, the survival of mice treated with PTCy on days +3/+4 was significantly superior compared with days +2/+3 (HR=5.6, p=0.0075). Although the weight AUCs through day +27 were not significantly different, the clinical score AUCs over that time interval were significantly better for 10 mg/kg/day PTCy on days +3/+4 (p=0.011). (C) There were no differences in survival or AUCs of weights or clinical scores between dosing schedules for mice receiving 25 mg/kg/day PTCy. For all parts, combined results are shown for two independent experiments of 5 mice/group/experiment.
Figure 4.
Figure 4.. PTCy has similar efficacy when given on days +3/+4, +4/+5, or +3/+5.
Mice were transplanted as in Figure 1 and received PTCy at (A) 5 mg/kg/day, (B) 10 mg/kg/day, or (C) 25 mg/kg/day on designated days. Mice not receiving PTCy on a given day received PBS vehicle. The same TCD BM, vehicle and TCD BM, Splen, Vehicle control groups are shown in all parts for comparison purposes. Statistical comparisons were performed between PTCy treatment groups and the TCD BM, Splen, Vehicle control group and between different PTCy treatment groups. (A) There were no significant differences in survival, weight AUCs (days 0–15), or clinical score AUCs (days 0–15) between the different 5 mg/kg/day PTCy dosing schedules, and none significantly prolonged survival compared with vehicle-treated mice. (B) 10 mg/kg/day PTCy on either days +3/+4 (HR=0.2, p=0.0054) or days +4/+5 (HR=0.1, p=0.0001) significantly prolonged survival compared with vehicle-treated mice, whereas the impact on survival of PTCy on days +3/+5 was less (HR=0.3, p=0.06). Although the survival after 10 mg/kg/day PTCy on days +4/+5 was the highest, there were no significant differences between treatment groups (days +4/+5 compared with days +3/+5, p=0.07). Weight AUCs (days 0–18) were similar between treatment groups, and all treatment groups were significantly better than vehicle-treated mice. On pointwise comparison, days +4/+5 had higher weights compared with days +3/+4 on day +18 (p=0.02) and compared with days +3/+5 on days +15 and +18 (p<0.003 for both days). Clinical score AUCs were similar between 10 mg/kg/day PTCy treatment groups, and all three treatment groups were significantly better than vehicle-treated mice (days +3/+4, p=0.0002; days +4/+5, p=0.0001; days +3/+5, p=0.0052). (C) At the 25 mg/kg/day dosing, there were no differences in survival between treatment groups, but all three treatment groups significantly prolonged survival compared with the vehicle-treated group (days +3/+4, HR=0.06, p=0.0002; day +4/+5, HR=0.03, p=0.0001; days +3/+5, HR=0.06, p=0.0002). Weight and clinical score AUCs over the entire period were similar between the three 25 mg/kg/day PTCy dosing schedules. Combined results are shown for two independent experiments of 5 mice/group/experiment.
Figure 5.
Figure 5.. The efficacy of PTCy peaks at day +4, and both the dose and cumulative exposure are critical.
Mice were transplanted as in Figure 1 and received PTCy at various dosing schedules. Mice not receiving PTCy on a given day received PBS vehicle. The same TCD BM, Vehicle and TCD BM, Splen, Vehicle control groups are shown in all parts for comparison purposes. Statistical comparisons were performed between PTCy treatment groups and the TCD BM, Splen, Vehicle control group and between different PTCy treatment groups. (A) Administration of 10mg/kg/day PTCy on days +3/+4 significantly prolonged survival compared with vehicle treatment (HR 0.035, p<0.0001), while 10 mg/kg PTCy on day +4 only and 5 mg/kg/dose PTCy BID on days +3/+4 each were only partially effective in a subset of mice (HR 0.45, p=0.14; HR=0.38, p=0.058; respectively). 10 mg/kg/day PTCy on day +3 only was completely ineffective at preventing lethal GVHD (p=0.64 compared with vehicle-treated mice). Weight AUCs (days 0–21) were not significantly different between treatment groups. Clinical score AUCs were significantly better for all PTCy groups compared with the vehicle-treated group (10 mg/kg on day +3, p=0.035; all others, p<0.0001). Furthermore, clinical score AUCs were significantly worse in mice treated with PTCy on day +3 only compared with the other three PTCy treatment groups (10 mg/kg on day +4 only, p=0.024; 10 mg/kg/day on days +3/+4, p=0.0005; 5 mg/kg/dose BID on days +3/+4, p=0.017). (B) Although all PTCy treatment groups significantly prolonged survival compared with the vehicle-treated group, mice treated with 50 mg/kg PTCy on day +3 only had significantly worse survival than mice treated with 25 mg/kg PTCy on day +4 only (HR=0, p=0.029) or 12.5 mg/kg/dose PTCy BID on days +3/+4 (HR=0.12, p=0.019), but not significantly worse than 25 mg/kg/day PTCy on days +3/+4 (HR=0.15, p=0.081) or 25 mg/kg PTCy on day +3 only (HR=0.49, p=0.38). None of the other PTCy treatment groups had significant survival differences from each other (all p values ≥0.21). Weight and clinical score AUCs (days 0–21) were significantly better in all PTCy dosing schedules compared with vehicle-treated mice. There were no differences in weight AUCs between PTCy dosing schedules, and no differences in clinical score AUCs between the PTCy groups other than 50 mg/kg PTCy on day +3 only. The 50 mg/kg PTCy group had worse clinical score AUCs than the 12.5 mg/kg/dose PTCy BID on days +3/+4 group (p=0.014). AUC comparisons between PTCy treatment groups were over the intervals of days 0–54 for comparisons including 50 mg/kg PTCy and days 0–141 for all other comparisons between PTCy treatment groups. Combined results are shown for two independent experiments of 5 mice/group/experiment except for the TCD BM group which had n=3/group/experiment (total n=6) and the 25 mg/kg PTCy on day +3 only, 25 mg/kg PTCy on day +4 only, and 50 mg/kg PTCy on day +3 only groups, which had n=4 in one of the two experiments (total n=9/group).
Figure 6.
Figure 6.. Effective dosing schedules of PTCy do not eliminate alloreactive (Vβ6+) T cells but do result in decreased proliferation (Ki-67+) of Vβ6+ CD4+ conventional T cells at day +7.
Mice were transplanted as in Figure 1 and received PTCy at various dosing schedules. Mice not receiving PTCy on a given day received PBS vehicle. At designated time points, mice were euthanized, and their spleens and blood were assessed by flow cytometry. (A-B) Percentages of CD4+CD25Foxp3 or CD8+ T cells that were Vβ6+ were not reduced at day (A) +7 or (B) +21 after any of the PTCy dosing schedules; in fact, some percentages actually were increased at day +7 after PTCy. (C) Vβ6+ CD4+CD25Foxp3 T-cell proliferation (Ki-67+) was significantly reduced in the spleen after several of the more effective PTCy dosing schedules, but was only significantly reduced in the blood by the optimal dosing (25 mg/kg/day PTCy on days +3/+4). Combined results from two independent experiments are shown. N=6/group for A and C except for the 10 mg/kg/day or 25 mg/kg/day PTCy on days +1/+2 group (n=4 each) and the 25 mg/kg/day PTCy on days +5/+6 group (n=5) due to some deaths occurring prior to day +7. N=8/group for B except 10 mg/kg/day PTCy on days +2/+3 (n=4). *p≤0.05, **p≤0.01, ***p≤0.001, ****p≤0.0001 on one-way ANOVA followed by the Holm-Sidak post hoc test using the vehicle-treated group as the control. Only significant results are shown; all other comparisons between treatment groups and the vehicle treatment group are non-significant.
Figure 7.
Figure 7.. Effective dosing schedules of PTCy result in preferential recovery of CD4+CD25+Foxp3+ Tregs at day +21.
Mice were transplanted as in Figure 1 and received PTCy at various dosing schedules. Mice not receiving PTCy on a given day received PBS vehicle. At designated time points, mice were euthanized, and their spleens and blood were assessed by flow cytometry. (A) At day +7, the percentages of CD4+ T cells that were CD25+Foxp3+ were similar or reduced by various PTCy dosing schedules compared with vehicle treatment. (B) The percentages of CD4+CD25+Foxp3+ Tregs that were Vβ6+ were not significantly different between groups at day +7. (C) At day +21, the most effective doses of PTCy (10 mg/kg/day on days +3/+4 or 25 mg/kg/day on days +1/+2, +3/+4, or +5/+6) all were associated with significantly increased percentages of CD4+CD25+Foxp3+ Tregs in both blood and spleen. (D) The percentages of Vβ6+ Tregs were not significantly different at day +21 between treatment groups, although the more effective dosing schedules tended to have higher percentages. (E-F) Pooling across all treatment groups, the percentages of CD4+CD25+Foxp3+ Tregs in either (E) blood or (F) spleen were significantly negatively associated with the histopathologic severity score in the same mice, suggesting that the percentage of Tregs at day +21 in this model may be a biomarker of effective GVHD prevention. Combined results from two independent experiments are shown. N=6/group for A-B except for the 10 mg/kg/day or 25 mg/kg/day PTCy on days +1/+2 group (n=4 each) and the 25 mg/kg/day PTCy on days +5/+6 group (n=5) due to some deaths occurring prior to day +7. N=8/group for C-F except 10 mg/kg/day PTCy on days +2/+3 (n=4). *p≤0.05, **p≤0.01, ***p≤0.001, ****p≤0.0001 on one-way ANOVA followed by the Holm-Sidak post hoc test using the vehicle-treated group as the control. Only significant results are shown; all other comparisons between treatment groups and the vehicle treatment group are non-significant.

References

    1. Kanakry CG, Fuchs EJ, Luznik L. Modern approaches to HLA-haploidentical blood or marrow transplantation. Nat Rev Clin Oncol. 2016;13(1):10–24. - PMC - PubMed
    1. Mayumi H, Himeno K, Tokuda N, Nomoto K. Drug-induced tolerance to allografts in mice. VII. Optimal protocol and mechanism of cyclophosphamide-induced tolerance in an H-2 haplotype-identical strain combination. Transplant Proc. 1986;18(2):363–369. - PubMed
    1. Luznik L, Jalla S, Engstrom LW, Iannone R, Fuchs EJ. Durable engraftment of major histocompatibility complex-incompatible cells after nonmyeloablative conditioning with fludarabine, low-dose total body irradiation, and posttransplantation cyclophosphamide. Blood. 2001;98(12):3456–3464. - PubMed
    1. Colson YL, Wren SM, Schuchert MJ, et al. A nonlethal conditioning approach to achieve durable multilineage mixed chimerism and tolerance across major, minor, and hematopoietic histocompatibility barriers. J Immunol. 1995;155(9):4179–4188. - PubMed
    1. Anasetti C, Amos D, Beatty PG, et al. Effect of HLA compatibility on engraftment of bone marrow transplants in patients with leukemia or lymphoma. N Engl J Med. 1989;320(4):197–204. - PubMed

Publication types

Substances