. 2020 Jan 1:101:469-483.
doi: 10.1016/j.actbio.2019.10.003. Epub 2019 Oct 4.

Effects of cartilage-targeting moieties on nanoparticle biodistribution in healthy and osteoarthritic joints

Affiliations

Effects of cartilage-targeting moieties on nanoparticle biodistribution in healthy and osteoarthritic joints

Shannon B Brown et al. Acta Biomater. .

Abstract

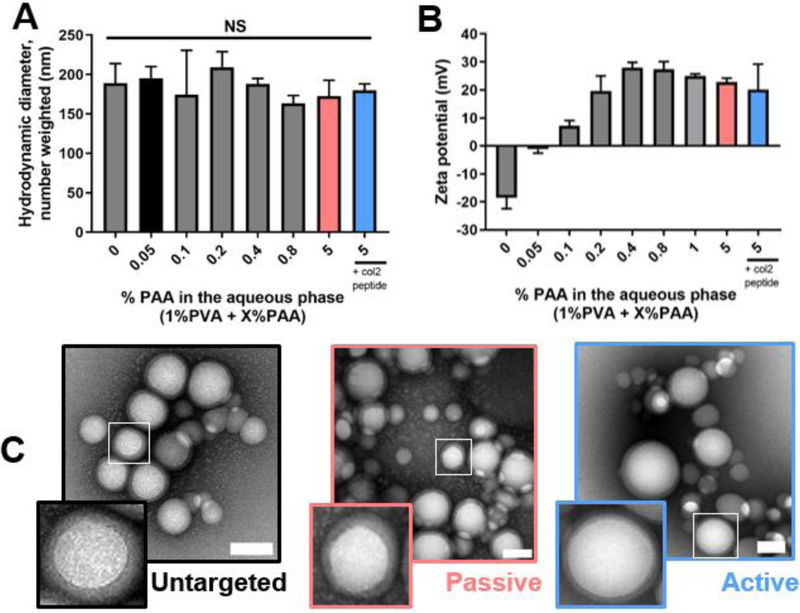
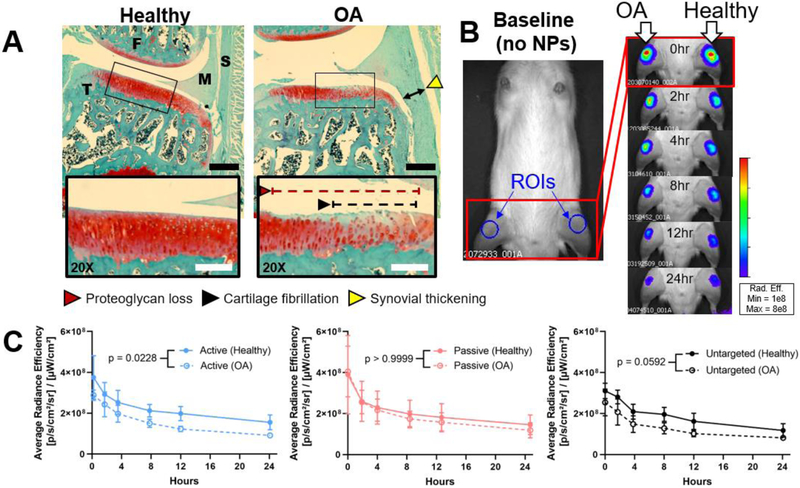
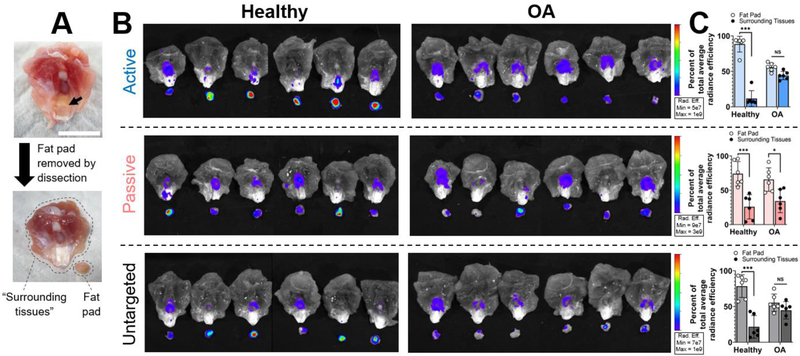
Understanding intra-articular biodistribution is imperative as candidate osteoarthritis (OA) drugs become increasingly site-specific. Cartilage has been identified as opportunistic for therapeutic intervention, but poses numerous barriers to drug delivery. To facilitate drug delivery to cartilage, nanoscale vehicles have been designed with different features that target the tissue's matrix. However, it is unclear if these targeting strategies are influenced by OA and the associated structural changes that occur in cartilage. The goal of this work was to study the effectiveness of different cartilage-targeting nanomaterials with respect to cartilage localization and retention, and to determine how these outcomes change in OA. To address these questions, a nanoparticle (NP) system was developed, and the formulation was tuned to possess three distinct cartilage-targeting strategies: (1) passive targeting cationic NPs for electrostatic attraction to cartilage, (2) active targeting NPs with binding peptides for collagen type II, and (3) untargeted neutrally-charged NPs. Ex vivo analyses with bovine cartilage explants demonstrated that targeting strategies significantly improved NP associations with both healthy and OA-like cartilage. In vivo studies with collagenase-induced OA in rats revealed that disease state influenced joint biodistribution for all three NP formulations. Importantly, the extent of cartilage accumulation for each NP system was affected by disease differently; with active NPs, but not passive NPs, cartilage accumulation was increased in OA relative to healthy knees. Together, this work suggests that NPs can be strategically designed for site-specific OA drug delivery, but the biodistribution of the NPs are influenced by the disease conditions into which they are delivered. STATEMENT OF SIGNIFICANCE: As emerging drugs for osteoarthritis are becoming increasingly site-specific, the need for targeted intra-articular drug delivery has evolved. To improve drug delivery to cartilage, targeting strategies for nanomaterials have been developed, but the manner in which these targeted systems accumulate at different sites within the joint remains poorly understood. Moreover, it is unclear how nanomaterial-tissue interactions change in osteoarthritic conditions, as tissue structure and composition change after disease onset. By understanding how nanomaterials distribute within healthy and disease joints, we can advance targeted drug delivery strategies and improve therapeutic outcomes for emerging drugs.

Keywords: Cartilage; Drug delivery; Intra-articular; Osteoarthritis; Targeting.


Figures

Figure 1.
Figure 1.
NP formulation and characterization. (A) Hydrodynamic diameter and (B) zeta potential of various formulations by DLS. (C) Contrast-enhanced TEM micrographs of the “untargeted” 0.05% PAA NPs (left), passive targeted” 5% PAA NPs (center), and “active targeted” 5% PAA + collagen type II peptide (right) NPs that were selected for further study. TEM scale bars = 100 nm. Statistics: n = 3 and compared via a one-way ANOVA.
Figure 2.
Figure 2.
The effect of fluorescent tagging of PLGA NPs on (A) size and (B) zeta potential. Statistics: n = 3, compared with 2-way ANOVAs with Bonferroni-corrected multiple comparisons tests for plain vs. fluorescently tagged NPs.
Figure 3.
Figure 3.
Confirmation of amines and peptide incorporation into the NP system. (A) Primary amines were detected through the ninhydrin assay. (A, inset) The gross presence of PAA, which is light brown in solution, could be visualized as a change in color in the NP pellets after washing. (B) The presence of peptides in the active NPs (“+col2 peptide”) was confirmed through the microBCA assay after conjugation to passive NPs (“-col2 peptide”). Statistics: n = 3 for all groups and compared by a (A) one-way ANOVA with a Tukey’s multiple comparisons test and (B) student’s paired t-test. col2 = collagen type II binding.
Figure 4.
Figure 4.
Particle colloidal and chemical stability. (A) Colloidal stability of the NPs in PBS at 37 °C and 60 rpm, determined by longitudinal DLS measurements. (B) NP suspensions mixed with bovine synovial fluid at 1:1 (volumetric, NP:synovial fluid) as a visualization of gross NP stability. (C) Net change in fluorescence signal for AlexaFluor 594-tagged 5% PAA NPs (“NPs-dye”) over 72 hours of dialysis. SF = synovial fluid. Scale bar = 0.5 cm. Statistics: n = 3 for all assessments and (A) compared by a 2-way ANOVA with a Dunnett’s comparison to the time 0 value for each NP type, (C) 1-way ANOVA with a Tukey’s multiple comparison test.
Figure 5.
Figure 5.
Cytocompatibility of cationic NPs after 24 hours of incubation with (A) chondrocytes and synoviocytes in monolayer and (B) whole cartilage explants. For cartilage explants, viability was tested with 5% PAA NPs with and without AlexaFluor 750 to verify that tagging did not change cytocompatibility. Statistics: n = 6 for all groups except cartilage control group (n = 12), and differences calculated through Dunnett’s comparisons to the ‘No NP control’.
Figure 6.
Figure 6.
NP interactions with healthy and OA-mimicked cartilage. (A) Histological appearance of tissue at the time of NP loading, and (B) after the 24 hour incubation in PBS. (C) NP loading into cartilage explants after 1 hour of surface-restricted incubation with NPs. (D) Retention of NPs in explants after 24 hours in PBS. Histological samples were not exposed to NPs. Scale bar = 1 mm. Statistics: n = 4–8 explants per group, compared by 2-way ANOVAs with Tukey’s multiple comparisons tests.
Figure 7.
Figure 7.
Visualization of the particles in explant cross sections via fluorescence microscopy, immediately after NP loading (“Loaded”) and after the 24 hour incubation in PBS (“Retained”). Tissue that had not been exposed to NPs serves as a control for potential cartilage autofluorescence. Note that comparisons should be drawn between “loaded” and “retained” images for given group due to differences in the fluorescent properties of the NPs. Fluorescence microscope objective 4X. Dotted line = cartilage articular surface; arrow = direction from articular surface to deeper zones within the cartilage; green = AlexaFluor 488-tagged NPs. Scale bar = 1 mm.
Figure 8.
Figure 8.
Short-term joint retention of NPs in healthy (PBS, anatomical left) and OA (collagenase, anatomical right) knees. (A) Histological condition of the medial compartment of knees 6 weeks post OA induction. Tissue sections are animal-matched and stained with Safranin-O/fast green. Images were taken at 4X and (inset) 20X. (B) Representative appearance of IVIS images pre- (“baseline”) and post-injection with AlexaFluor 750-tagged passive NPs. Regions of interest (ROIs) were drawn over each knee as shown for semi-quantitative assessment of the fluorescence, as shown in the baseline image. (C) Fluorescent NP tracking via IVIS. S = synovium, M = meniscus, F = femur, T = tibia, red = proteoglycans (cartilage), green = nonspecific tissue. Black scale bar = 500 μm. White scale bar = 50 μm. Statistics: n = 6 and all six curves analyzed by area under the curve and a 2-way ANOVA with Bonferroni-corrected multiple comparisons tests for each NP type (healthy vs. OA).
Figure 9.
Figure 9.
Biodistribution of NPs in OA and healthy knees 48 hours post injection. (A) Five groups of tissues were isolated from each knee for biodistribution analysis: EM = extensor mechanism, F = distal femoral head, T = proximal tibial head, M = meniscus, and L = medial and lateral collateral ligaments and tendon of the lateral long digital extensor muscle. (B) Epi-fluorescent IVIS images of each of these tissues, normalized to the same colorimetric scale for each NP system. (C) Semi-quantitative analysis of IVIS images, reported as a percent of signal for each tissue type. Colorimetric scales of IVIS images were normalized across healthy and OA knees for each NP formulation. Scales were set to adjust for baseline differences in fluorescent capacities of the different NP systems (Figure S8). (D) Healthy animals that had not been exposed to NPs were included as a control for potential autofluorescence. Tissue scale bar = 0.5 cm. Statistics: n = 6 for all except no NP controls (n = 3), compared by 2-way ANOVAs with Bonferroni-corrected multiple comparisons tests.
Figure 10.
Figure 10.
Biodistribution of NPs in the extensor mechanism. (A) After imaging the extensor mechanism for whole joint biodistribution, the fat pad was isolated from the patellar ligament by dissection, as shown. (B) IVIS fluorescence of separated extensor mechanisms and fat pads. (C) Semi-quantitative analysis of IVIS images for each NP system. Tissue scale bar = 1 cm. Statistics: n = 6, compared by 2-way ANOVAs with Bonferroni-corrected multiple comparisons tests.

References

    1. Goldring MB, Update on the biology of the chondrocyte and new approaches to treating cartilage diseases, Best Pract. Res. Clin. Rheumatol 20 (2006) 1003–1025. doi: 10.1016/j.berh.2006.06.003. - DOI - PubMed
    1. Hootman JM, Helmick CG, Projections of US prevalence of arthritis and associated activity limitations, Arthritis Rheum. 54 (2006) 226–229. doi: 10.1002/art.21562. - DOI - PubMed
    1. Bay-Jensen A-C, Hoegh-Madsen S, Dam E, Henriksen K, Sondergaard BC, Pastoureau P, Which elements are involved in reversible and irreversible cartilage degradation in osteoarthritis?, Rheumatol. Int 30 (2010) 435–442. doi: 10.1007/s00296-009-1183-1. - DOI - PubMed
    1. Loeser RF, Goldring SR, Scanzello CR, Goldring MB, Osteoarthritis: A disease of the joint as an organ, Arthritis Rheum. 64 (2012) 1697–1707. doi: 10.1002/art.34453. - DOI - PMC - PubMed
    1. Janssen M, Mihov G, Welting T, Thies J, Emans P, Drugs and Polymers for Delivery Systems in OA Joints: Clinical Needs and Opportunities, (2014) 799–819. doi: 10.3390/polym6030799. - DOI

Publication types