. 2019 Oct 15;51(4):655-670.e8.
doi: 10.1016/j.immuni.2019.09.002. Epub 2019 Oct 3.

Liver-Derived Signals Sequentially Reprogram Myeloid Enhancers to Initiate and Maintain Kupffer Cell Identity

Affiliations

Liver-Derived Signals Sequentially Reprogram Myeloid Enhancers to Initiate and Maintain Kupffer Cell Identity

Mashito Sakai et al. Immunity. .

Abstract

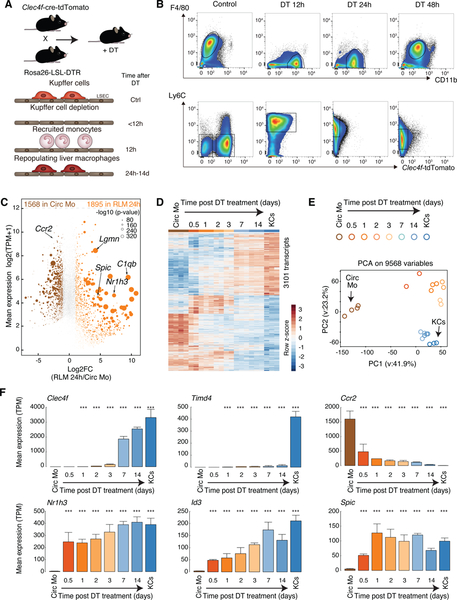
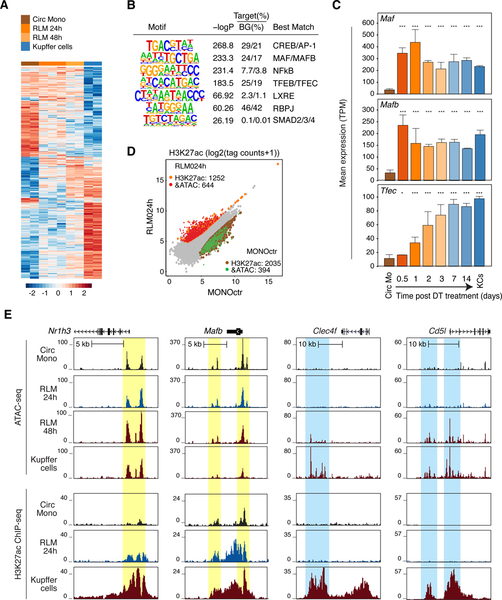
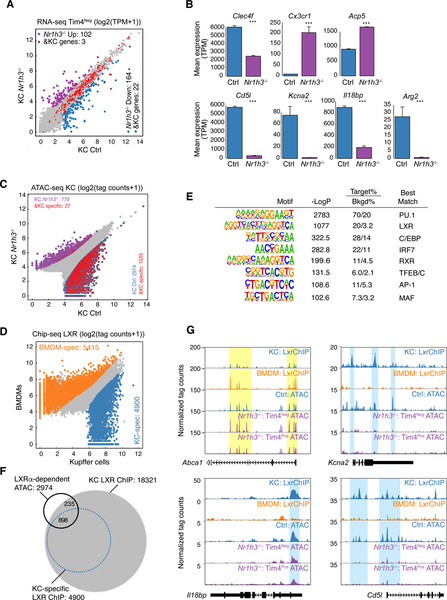
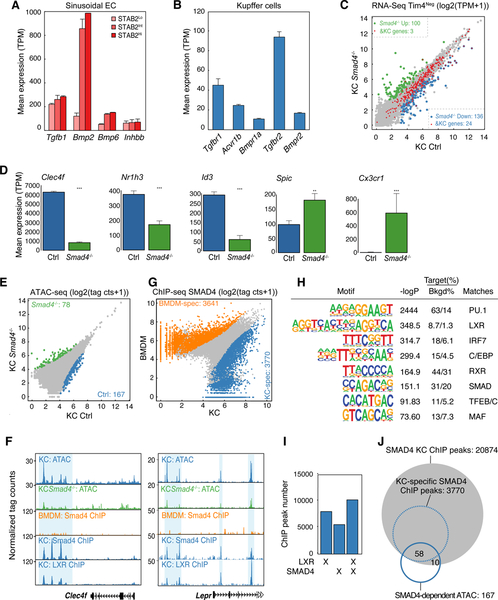
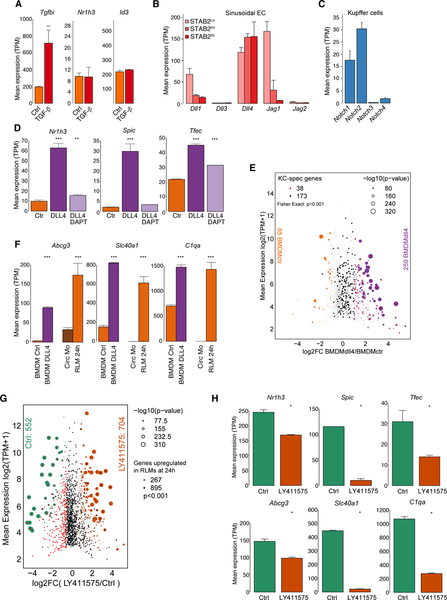
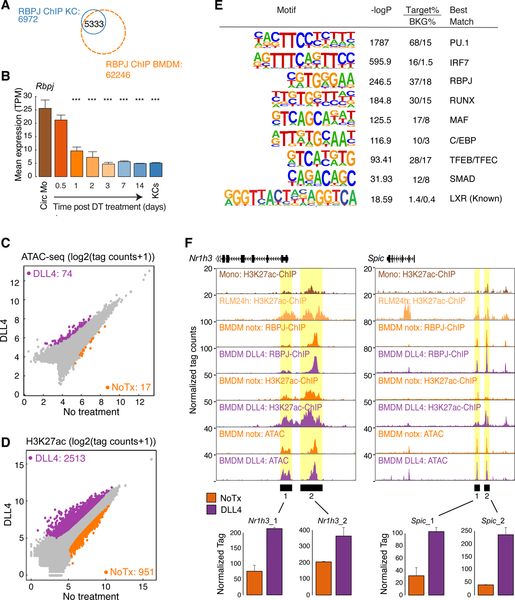
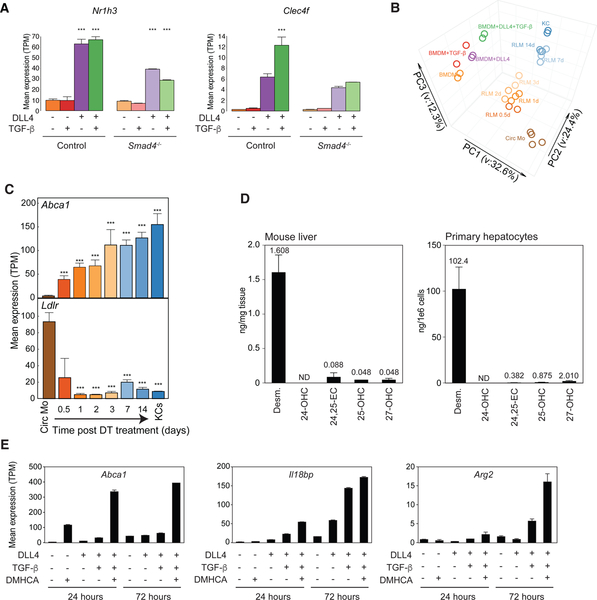
Tissue environment plays a powerful role in establishing and maintaining the distinct phenotypes of resident macrophages, but the underlying molecular mechanisms remain poorly understood. Here, we characterized transcriptomic and epigenetic changes in repopulating liver macrophages following acute Kupffer cell depletion as a means to infer signaling pathways and transcription factors that promote Kupffer cell differentiation. We obtained evidence that combinatorial interactions of the Notch ligand DLL4 and transforming growth factor-b (TGF-β) family ligands produced by sinusoidal endothelial cells and endogenous LXR ligands were required for the induction and maintenance of Kupffer cell identity. DLL4 regulation of the Notch transcriptional effector RBPJ activated poised enhancers to rapidly induce LXRα and other Kupffer cell lineage-determining factors. These factors in turn reprogrammed the repopulating liver macrophage enhancer landscape to converge on that of the original resident Kupffer cells. Collectively, these findings provide a framework for understanding how macrophage progenitor cells acquire tissue-specific phenotypes.


Conflict of interest statement

Declaration of interests

The authors declare no competing interests.

Figures

Figure 1.
Figure 1.
Recruited monocytes rapidly acquire expression of KC LDTFs followed by expression of a subset of KC-specific genes in KC-depleted livers A. Experimental scheme: Clecf4-cre-tdTomato x Rosa26 LSL DTR +/− DT B. Flow cytometry analysis of cell populations as a function of time following DT treatment. C. MA plot of RNA-seq data comparing circulating monocytes and RLMs at 24 h. Data are from one or two experiments with n = 3–4 per group. D. Genome-wide representation of DE genes in RLMs from 12h to 14 days in comparison to circulating monocytes and resident KCs. Data are from one or two experiments with n = 2–4 per group. DE genes are selected by DESeq2 (p-adj < 0.05). E. PCA of 9568 detectable genes (at least 8 TPM in at least two samples) in circulating monocytes, recruited liver monocytes, RLMs and resident KCs. F. Bar plots for expression of indicated genes. The significance symbols represent the p-adj from DESeq2 comparing to circulating monocytes respectively. ***p-adj < 0.001. Data are from one or two experiments with n = 2–4 per group. See also Figure S1.
Figure 2.
Figure 2.
Rapid reprogramming of the RLM epigenetic landscape A. Heat map of distal accessible chromatin regions defined by ATAC-seq in circulating monocytes, RLMs at 24 and 48h, and KCs. Each row is Z-score normalized tag counts for a peak. Data are from one or two experiments with n = 2–3 per group. B. Enriched motifs in distal accessible chromatin regions defined by ATAC-seq of RLMs at 48 h using GC-matched genomic background. C. Bar plots for expression of indicated genes in circulating monocytes (Circ Mo), RLMs, and resident KCs. Data are from one or two experiments with n = 2–4 per group. The significance markers represent the p-adj from DESeq2 comparing to circulating monocytes respectively. *p-adj < 0.05; ***p-adj < 0.001. D. Scatter plot of distal ATAC-associated H3K27ac in RLMs at 24h vs circulating monocytes. Data are from one or two experiments with n = 2–3 per group. Color codes indicate significant changes (p-adj < 0.05 & FC > 2) in H3K27ac with or without significant changes in ATAC-seq peaks. E. Genome browser tracks of ATAC-seq and H3K27ac ChIP peaks in the vicinity of the indicated loci in blood monocytes (Circ Mono), RLMs at 24 and 48 h and KCs. Yellow shading; pre-existing ATAC-seq peaks in circulating monocytes. Blue shading; regions of open chromatin acquired during RLM differentiation. See also Figure S2.
Figure 3.
Figure 3.
LXRα is a KC LDTF A. Scatter plot of mRNA expression in Control KCs vs Tim4Neg Nr1h3−/− KCs. Data are from one experiment with n = 2 per group. DE genes are colored (blue: down-regulated; purple: up-regulated in Nr1h3−/− KC). KC-specific genes are color-coded in red. B. Bar plots for expression of the indicated genes in control or Tim4Neg Nr1h3−/− KCs. Data are from one experiment with n = 2 per group. The significance symbols represent the p-adj from DESeq2 comparing Nr1h3−/− KC to Control KC. ***p-adj < 0.001. C. Scatter plot of IDR-defined ATAC-seq peaks in Control KCs vs. Tim4Neg Nr1h3−/− KCs. Significantly-changed ATAC-peaks are color-coded (blue: reduced; purple: gained in Nr1h3−/− KC). KC-specific enhancers identified in Figure S2B are color-coded in red. D. Scatter plot of IDR-defined LXR ChIP-seq peaks in KCs against BMDMs. Data are from two experiments with n = 42 per group. Differential LXR-ChIP peaks (p-adj < 0.05 & FC > 2) are colored (Blue: KC-specific; Orange: BMDM-specific). E. De novo motif enrichment analysis of KC-specific LXR peaks using a GC-matched genomic background F. Overlaps of total and KC-specific LXR ChIP-seq peaks with lost ATAC-Seq peaks in Tim4Neg Nr1h3−/− KCs G. Genome browser tracks of LXR ChIP-seq peaks in BMDMs and KCs aligned with ATAC-seq peaks in control and Nr1h3−/− KCs at the indicated loci. Yellow shading: common ATAC-seq peaks and LXR binding sites in BMDMs and KCs. Blue shading: KC-specific LXR binding sites associated with loss of ATAC peaks in Tim4Neg Nr1h3−/− KCs. See also Figure S3.
Figure 4.
Figure 4.
TGF-β and/or BMP signaling regulates KC identity A. Expression of TGF-β and BMP family members in endothelial cells. B. Expression of TGF-β and BMP receptors in KCs. C. Scatter plot of mRNA expression in control KCs vs Tim4Neg Smad4−/− KCs. Data are from one experiment with n = 2 per group. DE genes are colored (blue: down-regulated; green: up-regulated in Smad4−/− KC) KC-specific genes are color-coded in red. D. Bar plots for expression of the indicated genes in control or Tim4Neg Smad4−/− KCs. Data are from one experiment with n = 2 per group. The significance symbols represent the p-adj from DESeq2 comparing Smad4−/− KC to Control KC. **p-adj < 0.01; ***p-adj < 0.001. E. Scatter plot of IDR-defined ATAC-seq peaks in control or Smad4−/− KCs. Data are from one experiment with n = 2 per group. Significantly-changed ATAC-peaks are colored (blue: reduced; green: gained in Smad4−/− KC). F. Browser track examples of ATAC-seq in control and Smad4−/− KCs, Chip-seq for SMAD4 in KCs vs BMDMs and ChIP-seq for LXRs in KCs at the indicated loci. Blue shading: Sites of SMAD4 binding exhibiting loss of corresponding ATAC-seq peak in Smad4−/− KCs. G. Scatter plot of IDR-defined SMAD4 ChIP-seq peaks in KCs vs. BMDMs. Data are from two experiments with n = 2 per group. Differential LXR-ChIP peaks (p-adj < 0.05 & FC > 2) are colored (Blue: KC-specific; Orange: BMDM-specific). H. De novo motif enrichment analysis of KC-specific SMAD4 ChIP peaks using a GC-matched genomic background. I. Overlap of LXR and SMAD4 binding sites in KCs. J. Overlap of SMAD4 ChIP-seq peaks in KCs and KC-specific SMAD4 peaks with lost ATAC-seq peaks in Smad4−/− KCs. See also Figure S4.
Figure 5.
Figure 5.
Notch signaling activates KC LDTFs in BMDMs A. Bar plots for expression of the indicated genes in BMDMs stimulated with or without TGF-β. Data are from one experiment with n = 2 per group. The significance symbols represent the p-adj from DESeq2 comparing TGF-β-stimulated BMDM to Control BMDM. ***p-adj < 0.001. B. Expression of Notch ligands in endothelial cells C. Expression of Notch receptors in KCs D. Bar plots for expression of the indicated genes in control BMDMs or BMDMs stimulated with DLL4 alone or with DLL4 and DAPT. Data are from one experiment with n = 2 per group. The significance symbols represent the p-adj from DESeq2 comparing to Control BMDM respectively. **p-adj < 0.01; ***p-adj < 0.001. E. MA plot of RNA-seq data comparing control BMDMs and BMDMs treated with DLL4 for 24h. DE genes are colored (purple: up-regulated; orange: down-regulated in DLL4-stimulated BMDMs) and KC-specific genes are color-coded (red: up-regulated; black: not up-regulated in DLL4-stimulated BMDMs). Data are from one experiment with n = 2 per group. Fisher’s exact test was used to determine the odds ratio between DLL4 stimulation and KC-specific genes. F. Bar plots for expression of the indicated genes in circulating monocytes (Circ Mo), RLMs at 24 h, and BMDMs with or without DLL4 stimulation. Data are from one or two experiment with n = 2–4 per group. The significance symbols represent the p-adj from DESeq2 comparing DLL4-treated BMDM to control BMDM, and RLMs at 24 h to circulating monocytes respectively. ***p-adj < 0.001. G. MA plot of RNA-seq data comparing control RLMs at 24 h and RLMs at 24 h treated with LY411575. DE genes are colored (orange: up-regulate; green: down-regulated in LY411575-stimulated RLMs) and genes up-regulated in RLM 24h compared to circulating monocytes are color-coded. (red: down-regulated; black: not down-regulated in LY411575-stimulated RLMs). Data are from one experiment with n = 2–3 per group. Fisher’s exact test was used to determine the odds ratio between LY411575 stimulation and genes up-regulated in RLM 24h. H. Bar plots for expression of the indicated genes in RLMs at 24 h with or without LY411575 stimulation. Data are from one experiment with n = 2–3 per group. The significance symbols represent the p-adj from DESeq2 comparing LY411575-treated RLMs to control RLMs. *p-adj < 0.05. See also Figure S5.
Figure 6.
Figure 6.
Notch signaling activates a pre-existing enhancer landscape in BM progenitor cells A. Overlap of reproducible RBPJ ChIP-Seq peaks in KCs and BM progenitor cells B. Bar plot for Rbpj expression in circulating monocytes (Circ Mo), RLMs, and resident KCs. Data are from one or two experiments with n = 2–4 per group. The significance symbols represent the p-adj from DESeq2 comparing to circulating monocytes respectively. ***p-adj < 0.001. C. Scatter plot of IDR-defined distal ATAC-peaks in DLL4-treated BMDMs vs. control BMDMs. Data are from one experiment with n = 2 per group. Significantly-changed ATAC-peaks (p-adj < 0.05 & FC > 2) are colored (purple: gained; orange: reduced in DLL4-treated BMDM). D. Scatter plot of distal ATAC-associated H3K27ac in DLL4-treated BMDMs vs control BMDMs. Data are from one experiment with n = 2 per group. Color codes indicate significant changes (p-adj < 0.05 & FC > 2) in H3K27ac. E. Motif enrichment analysis of distal ATAC-seq peaks in DLL4-treated BMDMs that gain H3K27ac. F. Browser tracks of ATAC-Seq, H3K27ac ChIP-seq and RBPJ ChIP-seq peaks in the vicinities of putative regulatory elements for the indicated genes (Yellow shading). Bar graphs illustrate H3K27ac normalized tag counts for the indicated genomic regions. See also Figure S6.
Figure 7.
Figure 7.
Combinatorial interactions of liver environmental signals A. Effect of the combination of DLL4 and TGF-β on expression of indicated genes in control and Smad4−/− BMDMs. Data are from one experiment with n = 2 per group. The significance symbols represent the p-adj from DESeq2 comparing to control samples without stimulation in control and Smad4−/− respectively. ***p-adj < 0.001. B. PCA of overall gene expression in BM progenitor cells stimulated with or without DLL4 and/or TGF-β, circulating monocytes (Circ Mo), RLMs, and resident KCs. C. Bar plots for expression of the indicated genes in circulating monocytes (Circ Mo), RLMs, and resident KCs. Data are from one or two experiments with n = 2–4 per group. The significance markers represent the p-adj from DESeq2 comparing to circulating monocytes respectively. ***p-adj < 0.001. D. Quantification of desmosterol, 24-, 25- and 27-OHC and 24,25-EC in mouse liver (left) and primary hepatocytes (right). Data are from two experiments with n = 4–6 per group. E. Effects of the indicated combinations of DLL4, TGF-β and/or DMHCA on Abca1, Il18bp and Arg2 expression in BMDMs. Data are from two experiments with n = 2 per group. See also Figure S7.

Comment in

  • Kupffer cells: finding their niche.
    Bordon Y. Bordon Y. Nat Rev Immunol. 2019 Nov;19(11):660-661. doi: 10.1038/s41577-019-0231-7. Nat Rev Immunol. 2019. PMID: 31591534 No abstract available.

References

    1. Aida T, Chiyo K, Usami T, Ishikubo H, Imahashi R, Wada Y, Tanaka KF, Sakuma T, Yamamoto T, and Tanaka K (2015). Cloning-free CRISPR/Cas system facilitates functional cassette knock-in in mice. Genome Biology 16, 87. - PMC - PubMed
    1. Avigan J, Steinberg D, Thompson MJ, and Mosettig E (1960). Mechanism of Action of MER-29, An inhibitor of cholesterol biosynthesis. Biochemical and biophysical research communications 2, 63–65. - PubMed
    1. Bain CC, Hawley CA, Garner H, Scott CL, Schridde A, Steers NJ, Mack M, Joshi A, Guilliams M, Mowat AM, et al. (2016). Long-lived self-renewing bone marrow-derived macrophages displace embryo-derived cells to inhabit adult serous cavities. Nat Commun 7, ncomms11852. - PMC - PubMed
    1. Borggrefe T, and Oswald F (2009). The Notch signaling pathway: transcriptional regulation at Notch target genes. Cell Mol Life Sci 66, 1631–1646. - PMC - PubMed
    1. Bray SJ (2006). Notch signalling: a simple pathway becomes complex. Nat Rev Mol Cell Biol 7, 678–689. - PubMed

Publication types

MeSH terms

Substances