. 2019 Oct 21;29(20):3345-3358.e7.
doi: 10.1016/j.cub.2019.08.004. Epub 2019 Oct 3.

Functionally Distinct Gamma Range Activity Revealed by Stimulus Tuning in Human Visual Cortex

Affiliations

Functionally Distinct Gamma Range Activity Revealed by Stimulus Tuning in Human Visual Cortex

Eleonora Bartoli et al. Curr Biol. .

Abstract

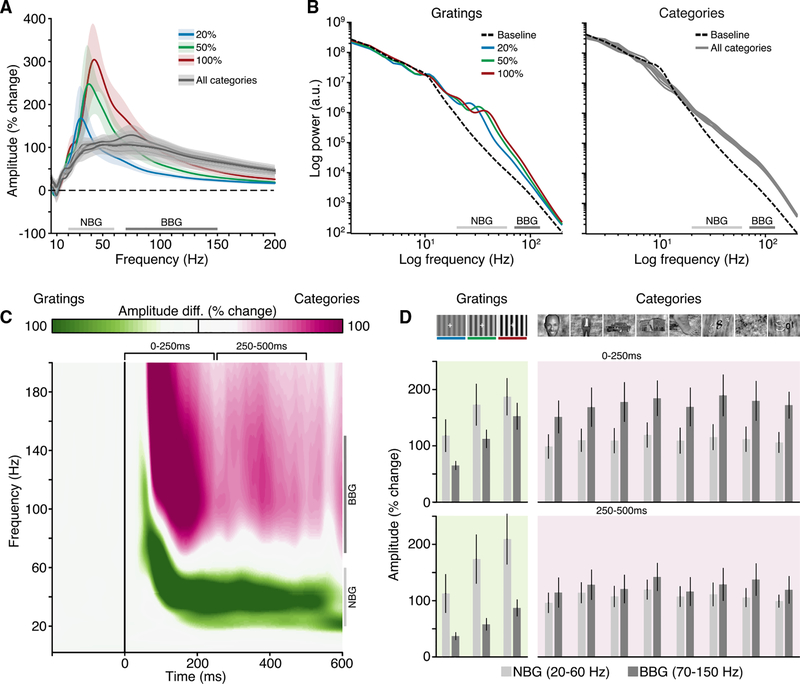
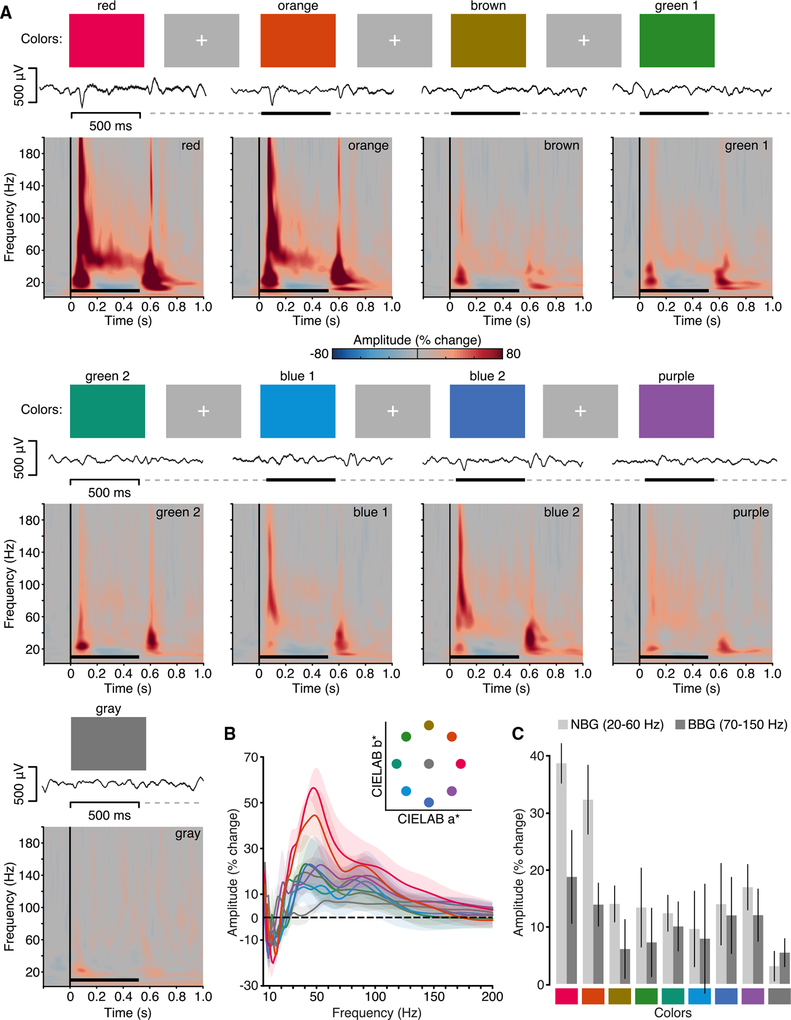
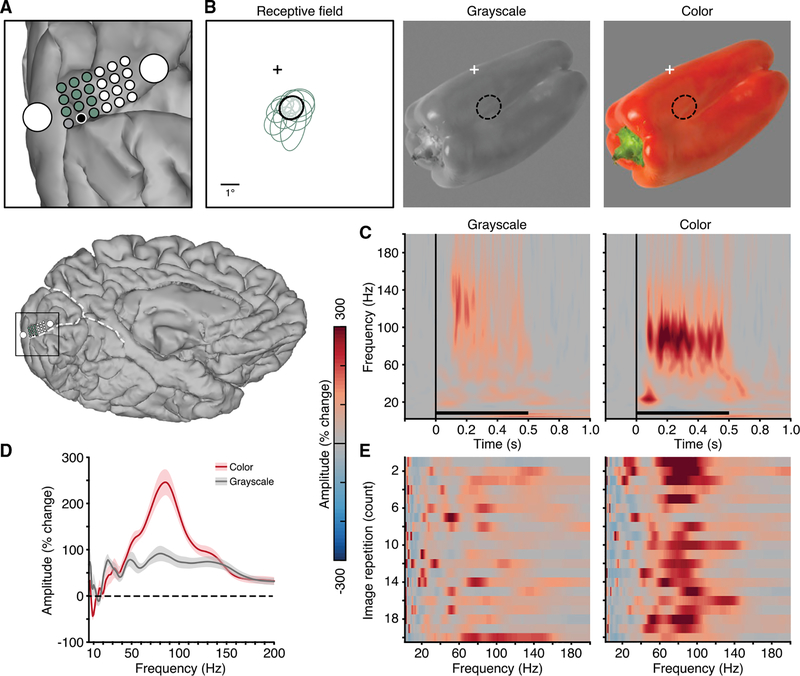
Neocortical gamma activity has long been hypothesized as a mechanism for synchronizing brain regions to support visual perception and cognition more broadly. Although early studies focused on narrowband gamma oscillations (∼20-60 Hz), recent work has emphasized a more broadband "high-gamma" response (∼70-150+ Hz). These responses are often conceptually or analytically treated as synonymous markers of gamma activity. Using high-density intracranial recordings from the human visual cortex, we challenge this view by showing distinct spectral, temporal, and functional properties of narrow and broadband gamma. Across four experiments, narrowband gamma was strongly selective for gratings and long-wavelength colors, displaying a delayed response onset, sustained temporal profile, and contrast-dependent peak frequency. In addition, induced narrowband gamma oscillations lacked phase consistency across stimulus repetitions and displayed highly focal inter-site synchronization. In contrast, broadband gamma was consistently observed for all presented stimuli, displaying a rapid response onset, transient temporal profile, and invariant spectral properties. We exploited stimulus tuning to highlight the functional dissociation of these distinct signals, reconciling prior inconsistencies across species and stimuli regarding the ubiquity of visual gamma oscillations during natural vision. The occurrence of visual narrowband gamma oscillations, unlike broadband high gamma, appears contingent on specific structural and chromatic stimulus attributes intersecting with the receptive field. Together, these findings have important implications for the study, analysis, and functional interpretation of neocortical gamma-range activity.

Keywords: broadband gamma; color vision; electrocorticography; gamma oscillations; high-frequency activity; human vision; narrowband gamma; natural vision; neural synchronization; visual cortex.


Conflict of interest statement

DECLARATION OF INTERESTS

The authors declare no competing interests.

Figures

Figure 1.
Figure 1.. Electrode Arrays and Visually Responsive Recording Sites
(A) Schematic of hybrid macro- and mini-ECoG electrode arrays employed. Standard clinical strip arrays with macro-electrodes were customized to include small diameter mini-electrodes in two configurations. Macro-electrodes had diameters of 2 mm (array A; subjects N1–5) and 3 mm (array B; subjects N6–10), with mini-electrodes having a diameter of 0.5 mm (both arrays). (B) To functionally select visually responsive electrodes, we used the visual evoked potential (VEP). Mean voltage traces are shown for VEP (orange) and non-VEP (gray) electrodes. Black vertical lines indicate stimulus onset and offset. From a total of 205 electrodes shown, 133 (~65%) displayed a VEP (data from subjects N1–7). (C) Anatomical location of electrodes from subjects participating in the visual grating task is shown on a standard cortical surface (see Figure S1 and Table S1 for single-subject locations; Figures S4 and S5 for task responses mapped onto locations). Electrodes displaying a VEP are shown in orange (non-VEP in white). Dashed white lines indicate the parieto-occipital and calcarine sulci.
Figure 2.
Figure 2.. Experiment 1: Spectral Response to Visual Grating Stimuli
(A) Experiment 1 stimuli and example voltage response (from subject N6). Static grating stimuli were presented for 500 ms (black line), with a random inter-stimulus interval (ISI) (dashed line) of 1.5–2.0 s. Gratings were presented at 20%, 50%, and 100% contrast levels (represented in blue, green, and red, respectively). (B) Group average spectrograms are shown for each grating contrast level; color maps reflect percentage change in amplitude relative to the pre-stimulus period (black line indicates stimulus presentation). See also Figures S2 and S3. (C) Group average normalized amplitude spectra (percent change) for each contrast condition averaged from the 250- to 500-ms post-stimulus time window (filled circles indicate peak amplitude frequency; shading reflects SEM). (D) Peak frequency of induced NBG for each subject across grating contrast levels (see Figures S4 and S5). Together, (B)–(D) clearly show a systematic increase in the NBG peak frequency with increasing contrast levels. (E) Group mean amplitude time course for NBG and BBG ranges. Although NBG shows a more sustained temporal profile, BBG shows transient increases at stimulus onset and offset (shading reflects SEM).
Figure 3.
Figure 3.. Inter-trial and Inter-site Phase Properties of NBG
(A) Time-frequency plots show group mean inter-trial phase clustering (ITPC) for each contrast condition. ITPC shows broadband clustering for stimulus onset and offset for each contrast level (contour lines indicate pcorr < 0.05; see also Figure S3). On the left, examples of NBG phase across repeated trials for an electrode, used for estimating ITPC, are shown. (B) Time-frequency plots show group mean inter-site phase clustering (ISPC) for each contrast condition (based on all 1,252 electrode pairs; contour lines indicate pcorr < 0.05; see Figure S6). ISPC shows broadband clustering for stimulus onset followed by sustained NBG ISPC predominately for the 50% and 100% contrast levels. On the left, two example electrodes used for estimating ISPC are shown. ITPC and ISPC reflect normalized values relative to the pre-stimulus period. (C) NBG ISPC is shown for each electrode pair as a function of inter-electrode distance for each contrast condition. Data are fitted with an exponential decay function (dashed line). (D) Electrode location of macro- and mini-ECoG grid in subject N7. (E) Spectrograms show the mean amplitude response across the electrodes shown in (D) for the 100% contrast level. (F) NBG ISPC for the same data in (D) and (E), relative to a seed electrode (indicated with a white star). Despite strong responses across electrodes, NBG ISPC is focal and rapidly decays within the mini-grid. The baseline-corrected ISPC values can range from −1 to 1 (with the seed being 1), but here, the color bar is clipped to smaller values (−0.2:0.2) to better capture the ISPC decay.
Figure 4.
Figure 4.. Experiment 2: Spectral Response to Natural Image Stimuli
Experiment 2 stimuli, example voltage response (subject N6; same as Figure 1A), and group mean spectrograms. Stimuli were grayscale images from eight visual categories (number, scramble, car, face, house, body, limb, and word), presented for 1,000 ms (black line), with a random ISI (dashed line) of 1–1.5 s (see also Figure S7). Mean group spectrograms show a highly consistent time-frequency response profile, typified by a strong BBG response to stimulus onset (color maps reflect percentage change in amplitude relative to the pre-stimulus period; black line indicates stimulus presentation).
Figure 5.
Figure 5.. Experiments 1 and 2 Spectral Comparison
(A) Mean group normalized amplitude spectra (% change) are shown for all conditions across both experiments (image categories are given same gray color given highly overlapping data); shading reflects SEM. (B) Mean group power spectra (log-log axis) are shown for both experiments, including mean baseline power spectra. (C) Mean group “task selectivity” spectrogram (grating versus categories). Time-frequency map highlights amplitude of response relative to task (green for time-frequency points larger for gratings; purple for time-frequency points larger for categories; white for time-frequency points of similar amplitude across tasks). Conditions in both tasks have been collapsed (note: gratings are presented for 500 ms and natural images for 1,000 ms; map is truncated at 600 ms post-stimulus to capture stimulus presentation up until the offset response to gratings). (D) Mean group amplitude response for NBG and BBG for early (0–250 ms) and late (250–500 ms) time windows (error bars, SEM). Across panels, NBG and BBG range is indicated for reference. Together, these plots highlight that BBG changes extend through the classical NBG range.
Figure 6.
Figure 6.. Experiment 3: Spectral Response to Color Stimuli
(A) Experiment 3 stimuli, example voltage response, and group mean spectrograms. Stimuli were full-screen colors from CIE L*a*b* space (red, orange, yellow, green1, green2, blue1, blue2, purple, and gray), presented for 500 ms (black line), with a random ISI (dashed line) of 1.5–2 s. Example voltage response to stimuli is shown (subject N10). Mean group spectrograms show a variable time-frequency response profile depending on stimulus color, with a transient broadband response visible at onset and offset for most colors and a NBG response clearly visible for red/orange (color maps reflect percentage change in amplitude relative to the pre-stimulus period; black line indicates stimulus presentation). (B) Group average normalized amplitude spectra (percent change) for each color averaged from the 250- to 500-ms post-stimulus time window (shading reflects SEM). Inset shows color stimuli location in CIE L*a*b* space (lightness plane L = 60). (C) Mean group amplitude response across colors for NBG and BBG (250- to 500-ms time window; error bars, SEM).
Figure 7.
Figure 7.. Experiment 4: Spectral Response Differences to Color and Grayscale Image
(A) Electrode location of macro- and mini-ECoG grid in subject N10 (whole brain location shown below for reference). Mini-ECoG electrodes with an identified receptive field are shown in green and black (gray electrode was excluded due to poor signal). (B) Receptive fields of the 11 mini-ECoG electrodes highlighted in (A). Receptive fields are given by Gaussian fits to the data [30, 42]. The receptive field location of the black electrode in (A) is shown with respect to fixation (cross) and overlaid on both the grayscale and color images (middle and right panels; luminance values 23.8 and 24.4 cd/m2, respectively; note: this is a cropped view of the full monitor display). (C) Mean spectrogram response for the grayscale (left) and color (right) image versions (black electrode in A; color maps reflect % change in amplitude relative to the pre-stimulus period; black line indicates stimulus presentation). (D) Mean normalized amplitude spectra (% change, averaged in the 250- to 500-ms post-stimulus window; shading reflects SEM) for the grayscale and color image versions. (E) Single-trial amplitude spectra (% change, averaged in the 250- to 500-ms post-stimulus window) for each image repetition (20 repetitions; y axis) for the grayscale (left) and color (right) image versions, showing the consistency of the spectral response to repeated presentations of the same image (non-consecutive repetitions). Although the grayscale image drives a clear BBG response, the colored image drives an additional NBG peak.

References

    1. Fries P (2005). A mechanism for cognitive dynamics: neuronal communication through neuronal coherence. Trends Cogn. Sci 9, 474–480. - PubMed
    1. Fries P (2009). Neuronal gamma-band synchronization as a fundamental process in cortical computation. Annu. Rev. Neurosci 32, 209–224. - PubMed
    1. Singer W (1999). Neuronal synchrony: a versatile code for the definition of relations? Neuron 24, 49–65, 111–125. - PubMed
    1. Gray CM (1999). The temporal correlation hypothesis of visual feature integration: still alive and well. Neuron 24, 31–47, 111–125. - PubMed
    1. Singer W, and Gray CM (1995). Visual feature integration and the temporal correlation hypothesis. Annu. Rev. Neurosci 18, 555–586. - PubMed

Publication types

LinkOut - more resources