Clinical Trial
. 2019 Oct 14;36(4):444-457.e7.
doi: 10.1016/j.ccell.2019.09.001. Epub 2019 Oct 3.

Pan-Cancer Landscape and Analysis of ERBB2 Mutations Identifies Poziotinib as a Clinically Active Inhibitor and Enhancer of T-DM1 Activity

Affiliations
Clinical Trial

Pan-Cancer Landscape and Analysis of ERBB2 Mutations Identifies Poziotinib as a Clinically Active Inhibitor and Enhancer of T-DM1 Activity

Jacqulyne P Robichaux et al. Cancer Cell. .

Erratum in

Abstract

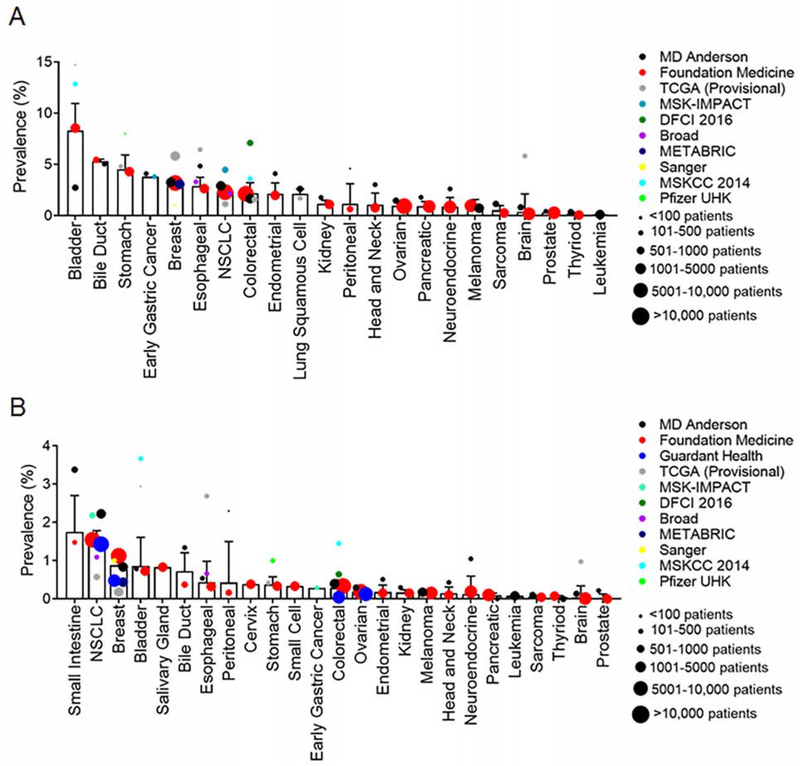
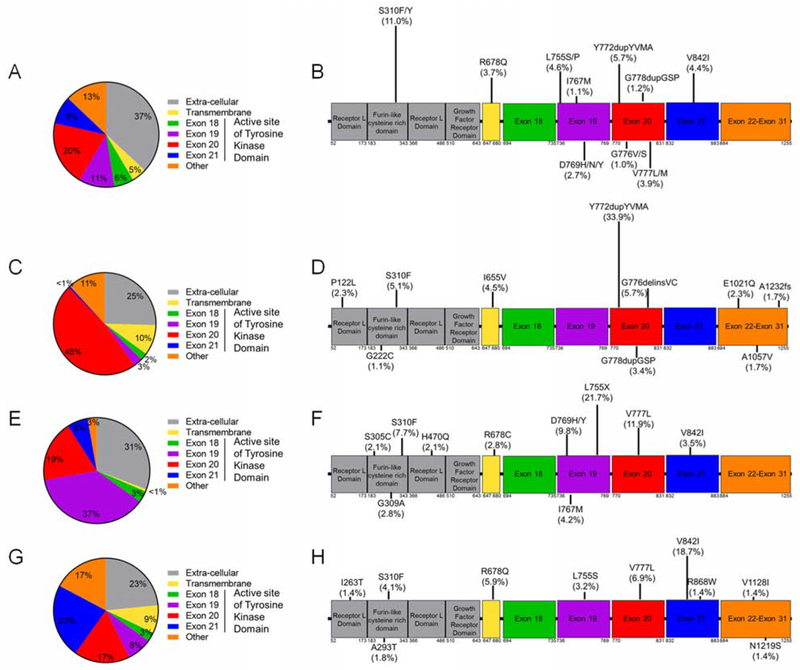
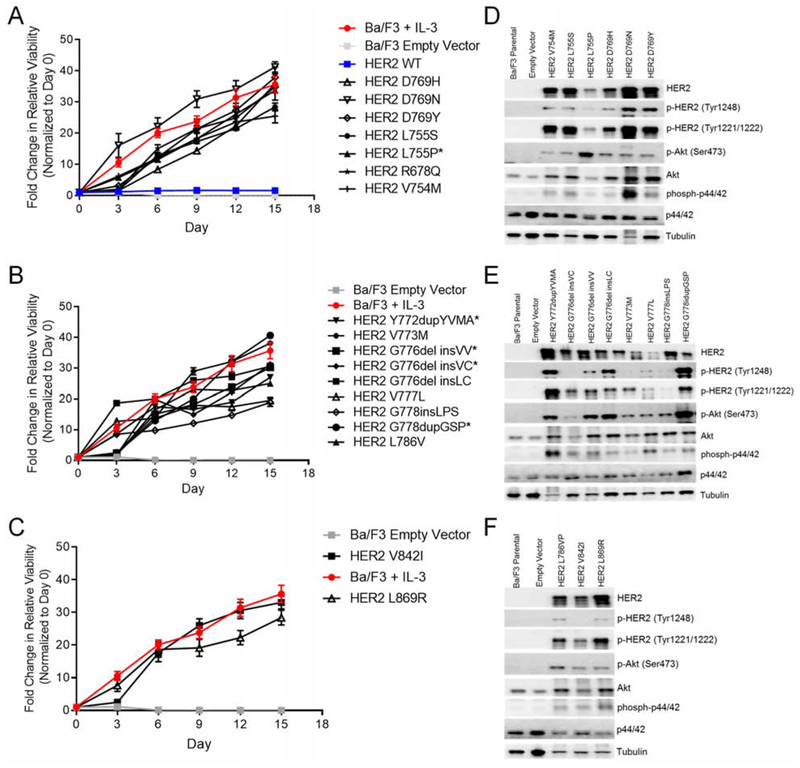
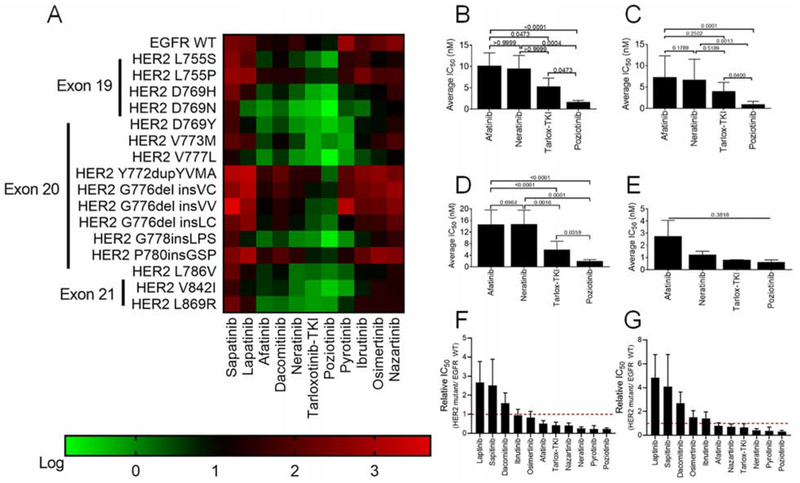
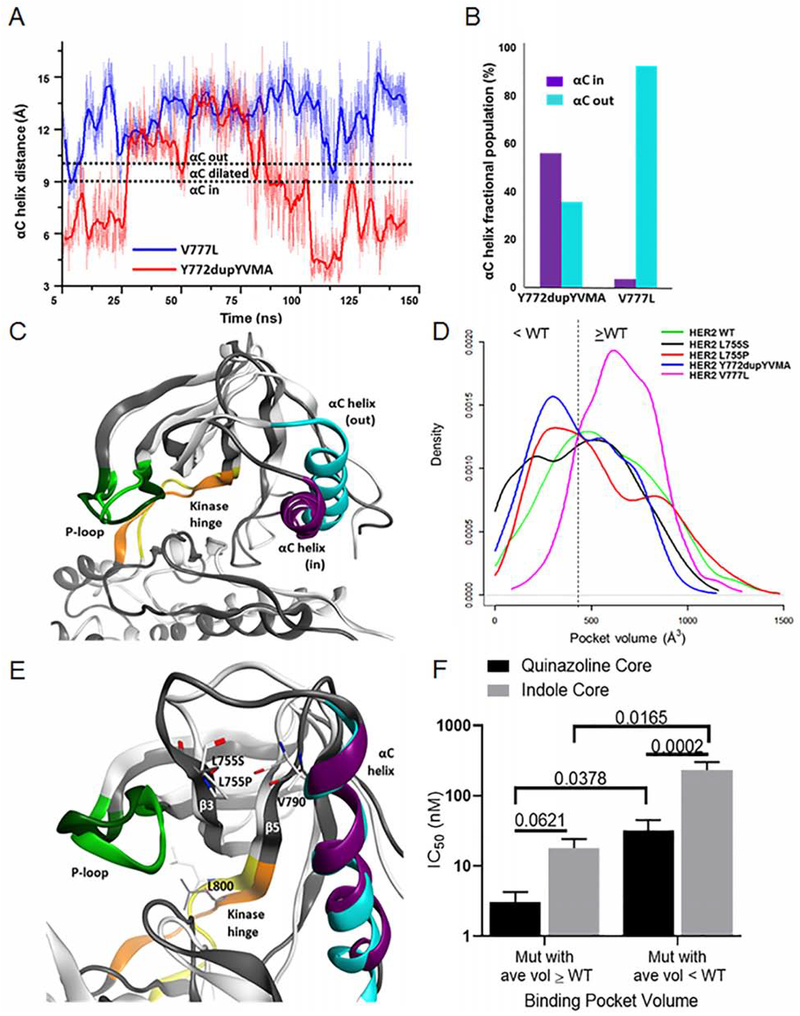
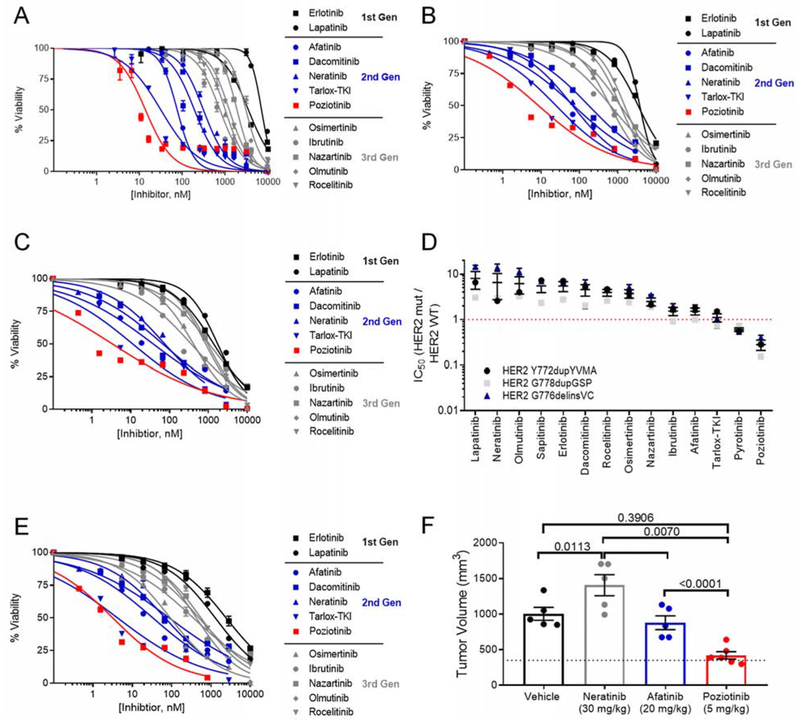
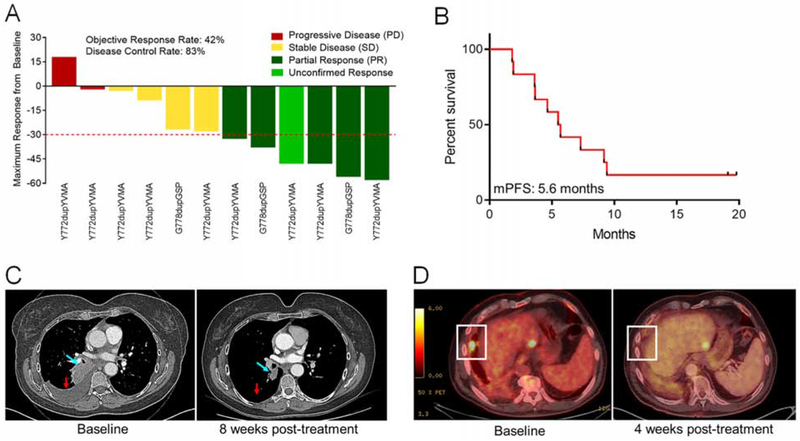
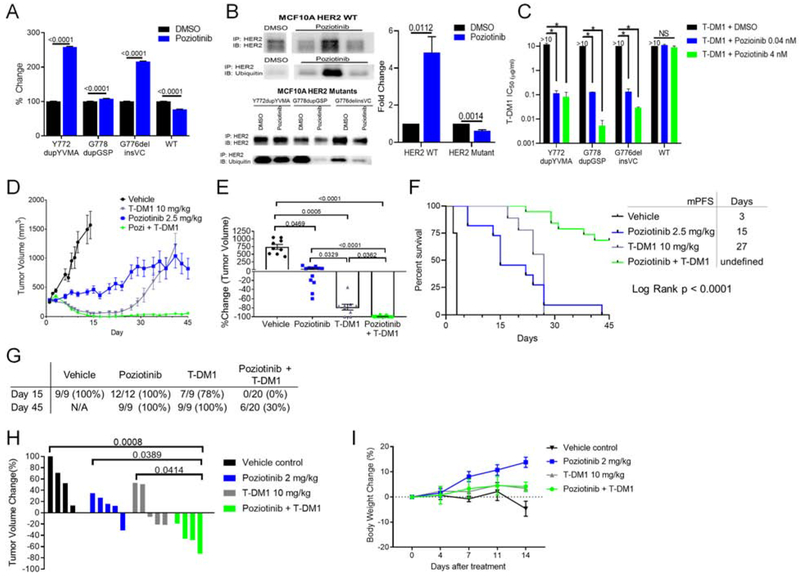
We characterized the landscape and drug sensitivity of ERBB2 (HER2) mutations in cancers. In 11 datasets (n = 211,726), ERBB2 mutational hotspots varied across 25 tumor types. Common HER2 mutants yielded differential sensitivities to eleven EGFR/HER2 tyrosine kinase inhibitors (TKIs) in vitro, and molecular dynamics simulations revealed that mutants with a reduced drug-binding pocket volume were associated with decreased affinity for larger TKIs. Overall, poziotinib was the most potent HER2 mutant-selective TKI tested. Phase II clinical testing in ERBB2 exon 20-mutant non-small cell lung cancer resulted in a confirmed objective response rate of 42% in the first 12 evaluable patients. In pre-clinical models, poziotinib upregulated HER2 cell-surface expression and potentiated the activity of T-DM1, resulting in complete tumor regression with combination treatment.

Keywords: ERBB2 mutant; HER2 mutant; NSCLC; T-DM1; TKI; exon 20; pan-cancer; poziotinib.


Conflict of interest statement

Declaration of Interests

The research being reported in this publication is research in which The University of Texas MD Anderson Cancer Center has an institutional financial conflict of interest. Because MD Anderson is committed to the protection of human subjects and the effective management of its financial conflicts of interest in relation to its research activities, MD Anderson has implemented an Institutional Conflict of Interest Management and Monitoring Plan to manage and monitor the conflict of interest with respect to MD Anderson’ s conduct of this research.

Figures

Figure 1:
Figure 1:
ERBB2 mutations occur in a variety of cancer types with mutational hotspots occurring across the receptor. (A and B) Bar plot of weighted averages of ERBB2 mutations (A) and ERBB2 exon 20 mutation (B) frequency by cancer. Bars are representative of the weighted average ± SEM. Dot sizes are representative of number of cases in each database. Frequency of ERBB2 mutations detected by cfDNA reported by Guardant Health were normalized for clinical sensitivity as reported in Odegaard et al 2018 (Odegaard et al., 2018). See also Table S1.
Figure 2:
Figure 2:
ERBB2 mutation hotspots vary by cancer type. (A-B) Frequency and location of ERBB2 mutations found across all cancers analyzed by protein coding region (A) and specific variant frequency of top ten variants (B) (n = 2338). (C-D) Frequency and location of ERBB2 mutations found in NSCLC (n = 177) analyzed by protein coding region (C) and specific variant (D). (E-F) Frequency and location of ERBB2 mutations found in breast cancer (n = 143) analyzed by protein coding region (E) and specific variant (F). (G-H) Frequency and location of ERBB2 mutations found in colon cancer (n = 219) analyzed by protein coding region (G) and specific variant (H). (B, D, F, and H) Length of bars on lollipop plots are relative to frequency of mutation reported. See also Figure S1.
Figure 3:
Figure 3:
The most common HER2 variants in the tyrosine kinase domain are activating mutations. (A-C) Cell viability of stable Ba/F3 cell lines expressing HER2 exon 19 (A), HER2 exon 20 (B), and HER2 exon 21 (C) mutations grown in IL-3 free conditions for 15 days. Fluorescence values were normalized to day zero, and the mean fold change ± SEM is plotted for each cell line (n = 3). (D-F) Representative Western blot of Ba/F3 cells expressing HER2 exon 19 (D), HER2 exon 20 (E), and HER2 exon 21 mutants (F) or empty vector (n = 3). See also Figure S2.
Figure 4:
Figure 4:
Potency of TKIs in Ba/F3 cell lines expressing HER2 mutants. (A) Heatmap of log IC50 values calculated in GraphPad for Ba/F3 cells stably expressing the indicated mutants and after 72 hr of drug treatment, (n ≥ 3). (B-E) Average IC50 values for Ba/F3 cell lines expressing all HER2 mutants (B), HER2 exon 19 mutants (C), HER2 exon 20 mutants (D), or HER2 exon 21 mutants (E) after treatment for 72 hr with indicated TKIs. (F and G) Bar plots of ratio of IC50 values of all HER2 mutant (F) or HER2 exon 20 mutant (G) to WT EGFR in the presence of 10 ng/ml EGF. (B-G) Bars are representative of mean ± SEM (n ≥ 3). See also Figure S3.
Figure 5:
Figure 5:
MDS of HER2 mutants reveal possible mechanisms for decreased drug sensitivity for Y772dupYVMA and L755P mutations. (A) αC-helix positions for the HER2 V777L and Y772dupYVMA exon 20 mutants during the 150 ns accelerated MDS. (B) Fractional population of molecular dynamics snapshots for the HER2 exon 20 mutants in the αC-helix “in” vs. “out” conformations. (C) Molecular dynamics snapshots of the V777L (white backbone, light green P-loop) and Y772dupYVMA (grey backbone, dark green P-loop) mutants. Note minor differences in P-loop and kinase hinge conformations but a significant shift in αC-helix position (“out” position for V777L in blue, “in” position for Y772dupYVMA in purple). (D) Binding pocket volume profiles for the HER2 mutants taken from the accelerated MDS. (E) Molecular dynamics snapshots of L755P (white, backbone; light green, P-loop; yellow, hinge; blue, αC-helix) and L755S (grey, backbone; dark green, P-loop; orange, hinge; purple, αC-helix) HER2 mutants. (F) Bar plots of IC50 values of HER2 mutants with binding pocket volumes ≥ WT HER2 or smaller than WT HER2 treated with quinazoline or indole based TKIs. Bars are representative of mean ± SEM (n ≥ 3). See also Figure S4.
Figure 6:
Figure 6:
Human cell lines expressing HER2 mutants are also sensitive to poziotinib. (A-C) Dose response curves of MCF10A cells expressing HER2 exon 20 insertion mutants G776delinsVC (A), Y772dupYVMA (B), or G778dupGSP (C), treated with indicated TKIs for 72 hr. (D) Dot plot of ratio of IC50 values comparing MCF10A expressing HER2 exon 20 mutants to MCF10A expressing WT HER2. Dots are representative of mean ± SEM for each cell line and bars are representative of mean ± SEM of all three cell lines (n ≥ 3 for each cell line). (E) Dose response curve of CW-2 colorectal cancer cell line harboring endogenous ERBB2 exon 19 mutation, L755S, treated with indicated inhibitors for 72 hr. (A-C, E) Curves are representative of mean ± SEM, n = 3. (F) Bar graph of CW-2 tumor volume at day 21. Tumors were randomized at 350 mm3, indicated by the dotted line. Dots are representative of individual tumors (n = 5/ group), and bars are representative of mean ± SEM. See also Figure S5.
Figure 7:
Figure 7:
Patients with NSCLC harboring ERBB2 mutations had a 42% confirmed response rate to poziotinib. (A) Waterfall plot of the objective responses of patients on clinical trial . Objective PR are shown in dark green, an unconfirmed response is shown in light green, SD is shown in yellow, and PD is shown in red. (B) Kaplan-meier plot of PFS of the 12 patients in (A). (C) Computed tomography (CT) scan of a patient with an ERBB2 Y772dupYVMA mutation one day before and eight weeks after poziotinib treatment. Blue arrow indicates the target lesion and the red arrow indicates the resolved pleural effusion. (D) Positron emission tomography (PET) scans of patient with ERBB2 L755P mutant NSCLC one day before and four weeks after poziotinib treatment. White boxes highlight the lesion of interest. See also Figure S6.
Figure 8:
Figure 8:
Poziotinib treatment induces accumulation of HER2 on the cell surface, and combination of poziotinib and T-DM1 treatment potentiates anti-tumor activity. (A) FACS analysis of HER2 expression on MCF10A cells expressing indicated HER2 mutants or WT HER2 after 24 hr of 10 nM poziotinib treatment. (B) Representative western blot of ubiquitin and total HER2 after immunoprecipitation of HER2 in MCF10A cells expressing WT HER2 or indicated HER2 mutants. Molecular weight ladder run between samples was omitted as indicated by the white space between lanes. Ubiquitin level was normalized to HER2 level then to DMSO control to determine fold change in relative ubiquitin expression (C) Bar plot of T-DM1 IC50 values of MCF10A cells expressing indicated HER2 mutants treated with T-DM1 alone or in combination with poziotinib. (n = 2), *, p < 0.0001. (D) Tumor growth curves of ERBB2 Y772dupYVMA NSCLC PDX treated with the indicated inhibitors. (E) Dot plot of percent change in tumor volume of mice treated with indicated inhibitors at day 15. (A-E) Bars and symbols are representative of mean ± SEM. (F) Kaplan-Meier curve of PFS of mice bearing ERBB2 Y772dupYVMA PDX treated with indicated inhibitors. (G) Summary of number of tumor bearing mice in each group at day 15 and day 45. (H) ERBB2 Y772dupYVMA GEMM were treated with indicated inhibitors for four weeks and tumor volume was determined by MRI. Bars are representative of individual mouse tumor volume. (I) Percent change in body weight for ERBB2 GEMMs over the first 14 days of treatment with indicated inhibitors. Symbols are representative of mean body weight ± SEM. See also Figure S7.

References

    1. Aertgeerts K, Skene R, Yano J, Sang BC, Zou H, Snell G, Jennings A, Iwamoto K, Habuka N, Hirokawa A , et al. (2011). Structural analysis of the mechanism of inhibition and allosteric activation of the kinase domain of HER2 protein. J Biol Chem 286, 18756–18765. - PMC - PubMed
    1. Bang YJ, Van Cutsem E, Feyereislova A, Chung HC, Shen L, Sawaki A, Lordick F, Ohtsu A, Omuro Y, Satoh T, et al. (2010). Trastuzumab in combination with chemotherapy versus chemotherapy alone for treatment of HER2-positive advanced gastric or gastro-oesophageal junction cancer (ToGA): a phase 3, open-label, randomised controlled trial. Lancet 376, 687–697. - PubMed
    1. Barretina J, Caponigro G, Stransky N, Venkatesan K, Margolin AA, Kim S, Wilson CJ, Lehar J, Kryukov GV, Sonkin D, et al. (2012). The Cancer Cell Line Encyclopedia enables predictive modelling of anticancer drug sensitivity. Nature 483, 603–607. - PMC - PubMed
    1. Baselga J, Bradbury I, Eidtmann H, Di Cosimo S, de Azambuja E, Aura C, Gomez H, Dinh P, Fauria K, Van Dooren V, et al. (2012a). Lapatinib with trastuzumab for HER2-positive early breast cancer (NeoALTTO): a randomised, open-label, multicentre, phase 3 trial. Lancet 379, 633–640. - PMC - PubMed
    1. Baselga J, Cortes J, Kim SB, Im SA, Hegg R, Im YH, Roman L, Pedrini JL, Pienkowski T, Knott A, et al. (2012b). Pertuzumab plus trastuzumab plus docetaxel for metastatic breast cancer. N Engl J Med 366, 109–119. - PMC - PubMed

Publication types

MeSH terms