Observational Study
. 2019 Oct 14;36(4):418-430.e6.
doi: 10.1016/j.ccell.2019.08.007. Epub 2019 Oct 3.

Tumor Cell Biodiversity Drives Microenvironmental Reprogramming in Liver Cancer

Affiliations
Observational Study

Tumor Cell Biodiversity Drives Microenvironmental Reprogramming in Liver Cancer

Lichun Ma et al. Cancer Cell. .

Abstract

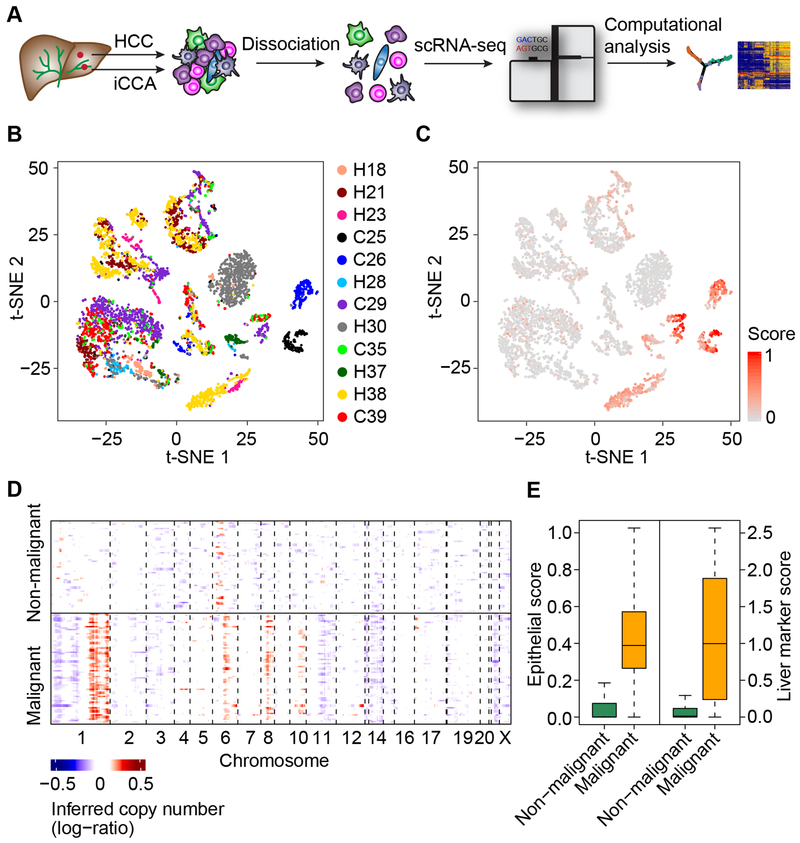
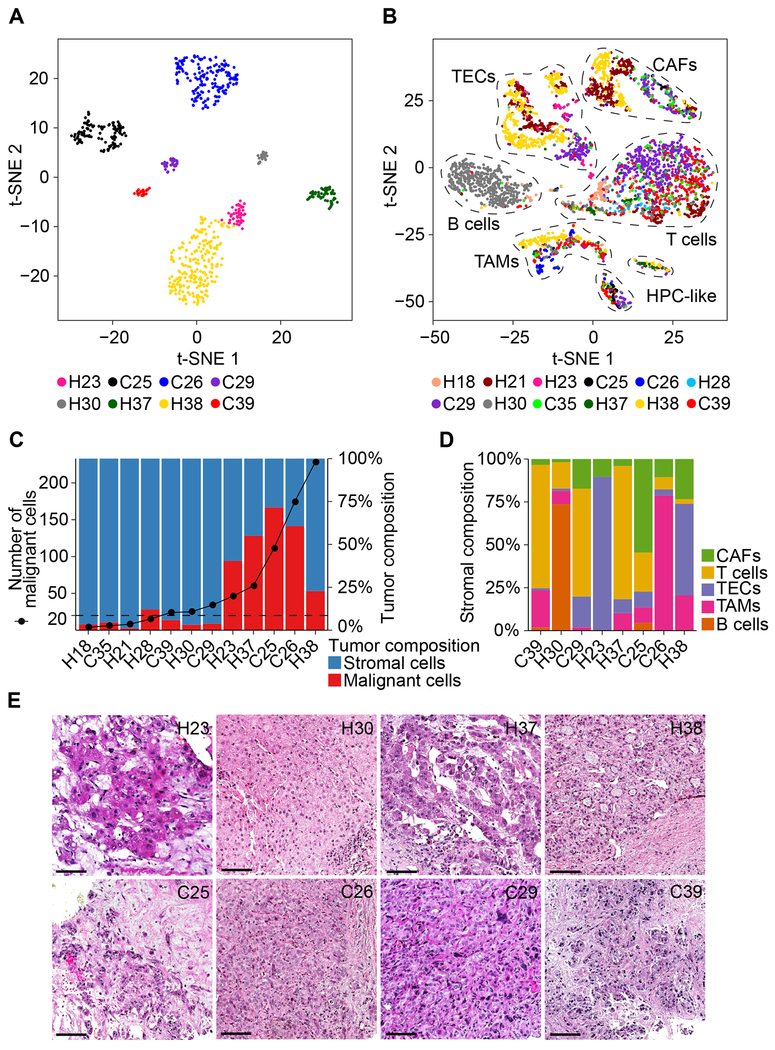
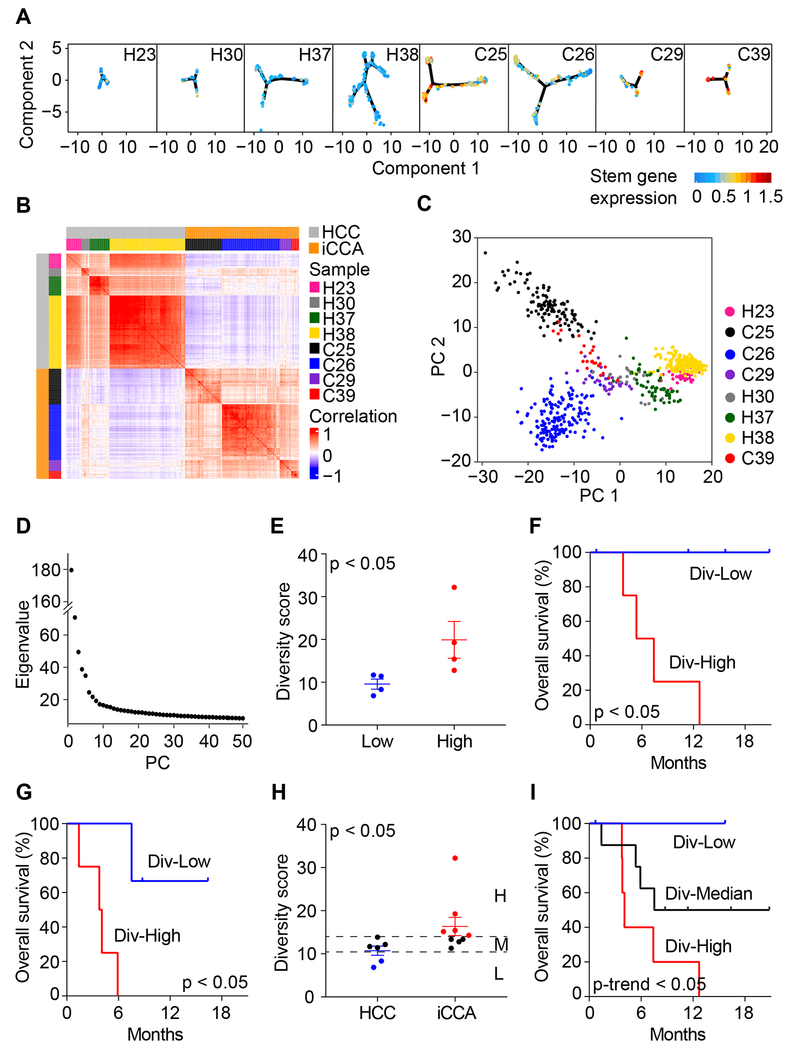
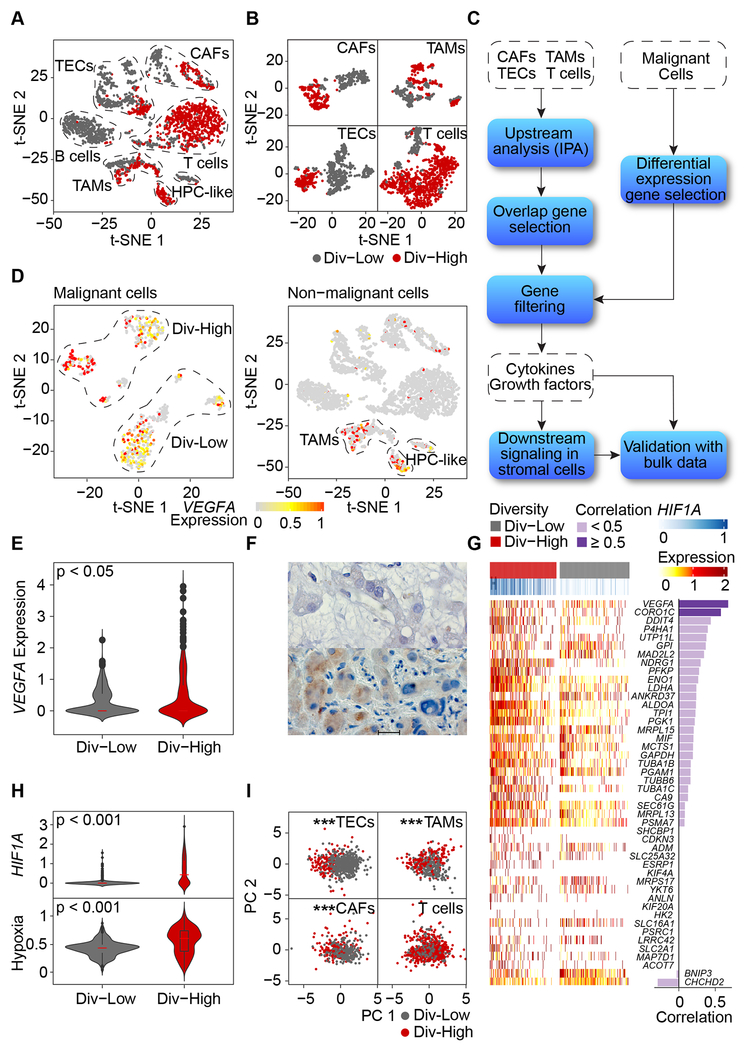
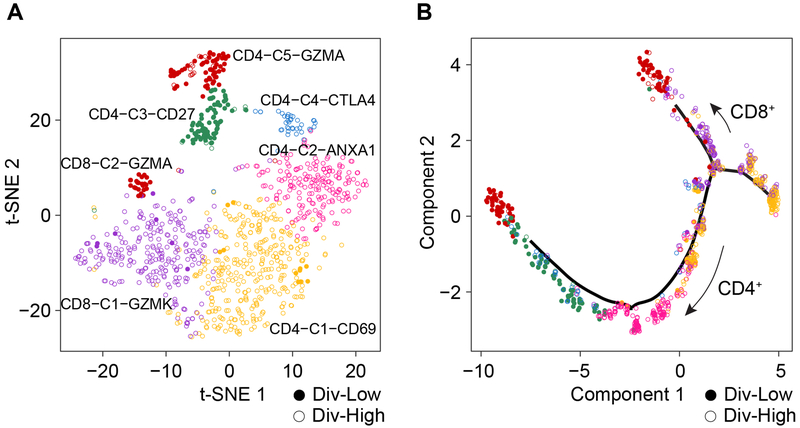
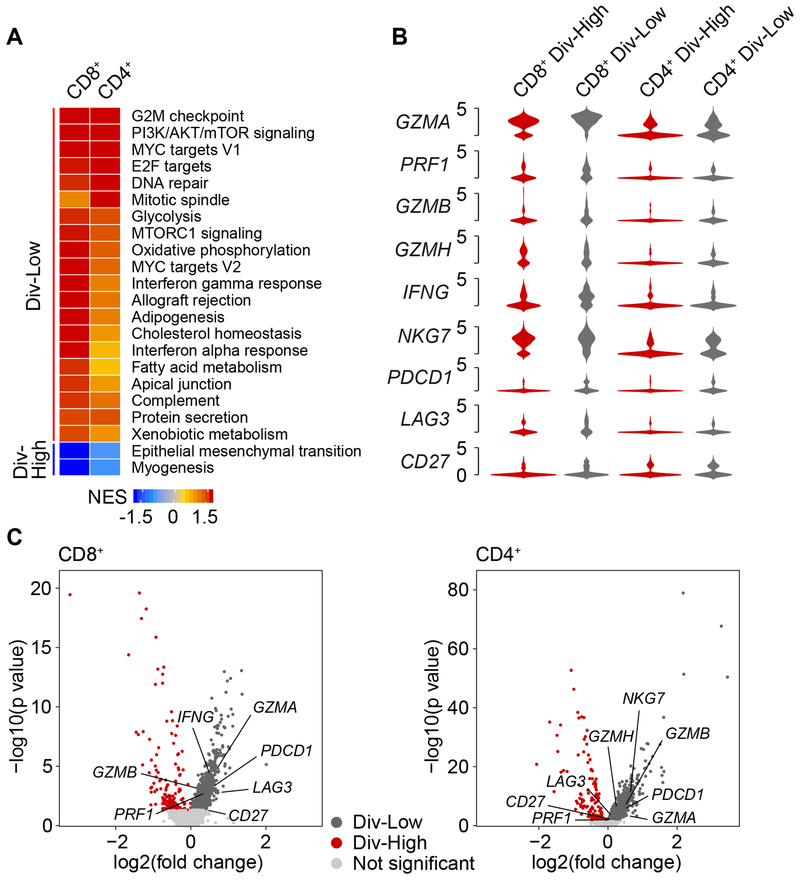
Cellular diversity in tumors is a key factor for therapeutic failures and lethal outcomes of solid malignancies. Here, we determined the single-cell transcriptomic landscape of liver cancer biospecimens from 19 patients. We found varying degrees of heterogeneity in malignant cells within and between tumors and diverse landscapes of tumor microenvironment (TME). Strikingly, tumors with higher transcriptomic diversity were associated with patient's worse overall survival. We found a link between hypoxia-dependent vascular endothelial growth factor expression in tumor diversity and TME polarization. Moreover, T cells from higher heterogeneous tumors showed lower cytolytic activities. Consistent results were found using bulk genomic and transcriptomic profiles of 765 liver tumors. Our results offer insight into the diverse ecosystem of liver cancer and its impact on patient prognosis.

Keywords: VEGF; biodiversity; cholangiocarcinoma; hepatocellular carcinoma; liver cancer; microenvironmental reprogramming; single-cell; tumor ecosystem; tumor heterogeneity; tumor microenvironments.


Conflict of interest statement

DECLARATION OF INTERESTS

The authors declare no competing interests.

Figures

Figure 1.
Figure 1.. Dissection of Primary Liver Cancer with scRNA-seq.
(A) Workflow of primary liver tumor collection, processing, sequencing, and data analysis. (B) t-SNE plot of all the 5,115 single-cells from 12 primary liver cancer patients (indicated by colors). Case ID was named according to histological subtypes of liver cancer, with H and C representing HCC and iCCA respectively. (C) t-SNE plot of all the single-cells colored by epithelial score. Epithelial score was determined by the average expression of epithelial marker genes. (D) Large-scale CNVs of single-cells (rows) of a representative tumor (H37). CNVs were inferred from transcriptomes. Red, amplifications; blue, deletions. (E) Epithelial score (left) and liver marker score (right) of malignant and non-malignant cells. In the boxplots, the central rectangles span the first quartile to the third quartile, with the segments inside the rectangle corresponding to the median. Whiskers extend 1.5 times the interquartile range. See also Figure S1 and Table S1.
Figure 2.
Figure 2.. The Nature of Liver Tumor Heterogeneity.
(A) t-SNE plot of 702 malignant cells from eight tumors (indicated by colors) with ≥ 20 malignant cells in each tumor. (B) t-SNE plot of 4,380 non-malignant cells from 12 tumors (indicated by colors). Cells were annotated based on known lineage-specific marker genes as T cells, B cells, CAFs, TAMs, TECs and HPC-like. (C) The number of malignant cells (left y-axis) and the proportions of malignant and stromal cells of each tumor (right y-axis). We selected the eight tumors with ≥ 20 malignant cells (above dashed line) for further analysis. (D) Stromal cell composition of the eight tumors with ≥ 20 malignant cells. (E) Histopathology of the eight tumors with ≥ 20 malignant cells. Scale bars, 50 μm. See also Figure S1.
Figure 3.
Figure 3.. Intratumoral Heterogeneity in Liver Cancer.
(A) Trajectory of malignant cells of each tumor constructed using reversed graph embedding method. Cells were colored by the average expression of 10 stemness related genes (i.e., EPCAM, KRT19, PROM1, ALDH1A1, CD24, ANPEP, CD44, ICAM1, CD47, and SOX9). (B) Pairwise correlation of all the malignant cells from eight tumors. Each pixel in the heatmap represents the correlation of two cells (the corresponding row and column). Red, positive correlation; blue, negative correlation. (C) PCA of malignant cells from eight tumors. (D) Eigenvalue corresponding to each PC from (C). (E) Diversity score of tumor samples according to the median value of diversity: Div-Low, below median value; Div-High, above median value. Data are represented as mean ± SEM. (F and G) Overall survival of Div-Low and Div-High groups of patients of Set 1 (F) and Set 2 (G). Log-rank test was preformed to show the statistical difference of the two groups. (H) Diversity score of HCC and iCCA tumors. Div-High group includes iCCA tumors with larger diversity score than any HCC tumors. Div-Low group includes those HCC tumors with lower diversity score than any iCCA tumors. Div-Median are the remained cases with intermediate diversity score. The analysis includes patients from both Set 1 and Set 2. Data are represented as mean ± SEM. (I) Overall survival of Div-Low, Div-Median, and Div-High groups of patients. Log-rank test for trend was preformed to show the statistical significance of the survival trend. See also Figures S2–S4.
Figure 4.
Figure 4.. Reprogramming of Stromal Cells.
(A) t-SNE plot of non-malignant cells from Div-Low (grey dots) and Div-High (red dots) tumors. Cells from other samples (diversity was not measured for tumor samples with < 20 malignant cells) were removed. (B) t-SNE plots of CAFs, TAMs, TECs and T cells derived from eight tumors with ≥ 20 malignant cells. (C) Schematic overview of searching for upstream regulators of stromal cells. Ingenuity Pathway Analysis (IPA) was applied to search for cytokines/growth factors that act as upstream regulators of each non-malignant cell type. (D) VEGFA expression in malignant and non-malignant cells. (E) Violin plot of VEGFA expression in malignant cells from Div-Low and Div-High tumors. Student’s t-test was used to show the statistical difference of the two groups. (F) Immunohistochemistry of H23 (Div-Low, top) and C29 (Div-High, bottom) stained for VEGFA. Scale bar, 20 μm. (G) Heatmap of hypoxia-related genes. Pearson correlation coefficient of HIF1A and a specific hypoxia-related gene was provided if more than 10% of all the malignant cells expressing both HIF1A and the hypoxia-related gene. (H) Violin plots of HIF1A and the average expression of hypoxia-related genes in malignant cells from Div-Low and Div-High tumors. Student’s t-test was used to show the statistical difference of the two groups. (I) PCA of TECs, TAMs, CAFs and T cells based on genes from VEGFA downstream signaling pathway. Hotelling’s T-squared test was used to test the difference of multivariate means of Div-High and Div-Low groups. *** indicates p value < 0.001. In all violin plots, white boxes span the first quartile to the third quartile; red lines in the white boxes indicate the median; dots represent outliers beyond 1.5 times the interquartile range; the width of a violin plot indicates the kernel density of the expression values. See also Figure S5 and Tables S2 and S3.
Figure 5.
Figure 5.. Analysis of T cells Derived from Div-Low and Div-High Tumors.
(A) t-SNE projection of T cells from eight tumors with ≥ 20 malignant cells. (B) Single-cell trajectory analysis of T cells. CD4+ and CD8+ T-cell branches were revealed from the cell trajectory. See also Figure S6.
Figure 6.
Figure 6.. Cytolytic Activities of T cells from Div-Low Tumors.
(A) Gene set enrichment analysis of CD8+ and CD4+ T cells. For each type of T cells, normalized enrichment score (NES) was used to indicate the enrichment of the related pathways. Pathways that were significantly enriched in either CD8+ or CD4+ T cells were listed. (B) Violin plots of T-cell cytotoxicity related genes and immune checkpoint related genes of CD8+ and CD4+ T cells from Div-Low and Div-High tumors. The width of a violin plot indicates the kernel density of the expression values. (C) Volcano plots of differential expression genes of CD8+ and CD4+ T cells derived from Div-Low and Div-High tumors. Genes from (B) were labeled if p value < 0.05. See also Figure S6 and Tables S4–S7.

References

    1. Alexandrov LB, Nik-Zainal S, Wedge DC, Aparicio SA, Behjati S, Biankin AV, Bignell GR, Bolli N, Borg A, Borresen-Dale AL, et al. (2013). Signatures of mutational processes in human cancer. Nature 500, 415–421. - PMC - PubMed
    1. Andor N, Graham TA, Jansen M, Xia LC, Aktipis CA, Petritsch C, Ji HP, and Maley CC (2016). Pan-cancer analysis of the extent and consequences of intratumor heterogeneity. Nat Med 22, 105–113. - PMC - PubMed
    1. Aran D, Hu Z, and Butte AJ (2017). xCell: digitally portraying the tissue cellular heterogeneity landscape. Genome Biology 18, 220. - PMC - PubMed
    1. Azizi E, Carr AJ, Plitas G, Cornish AE, Konopacki C, Prabhakaran S, Nainys J, Wu K, Kiseliovas V, Setty M, et al. (2018). Single-Cell Map of Diverse Immune Phenotypes in the Breast Tumor Microenvironment. Cell 174, 1293–1308 e1236. - PMC - PubMed
    1. Baslan T, and Hicks J (2017). Unravelling biology and shifting paradigms in cancer with single-cell sequencing. Nat Rev Cancer 17, 557–569. - PubMed

Publication types

MeSH terms

Substances