. 2019 Nov 7;25(5):622-638.e13.
doi: 10.1016/j.stem.2019.08.018. Epub 2019 Oct 3.

The RNA Helicase DDX6 Controls Cellular Plasticity by Modulating P-Body Homeostasis

Affiliations

The RNA Helicase DDX6 Controls Cellular Plasticity by Modulating P-Body Homeostasis

Bruno Di Stefano et al. Cell Stem Cell. .

Abstract

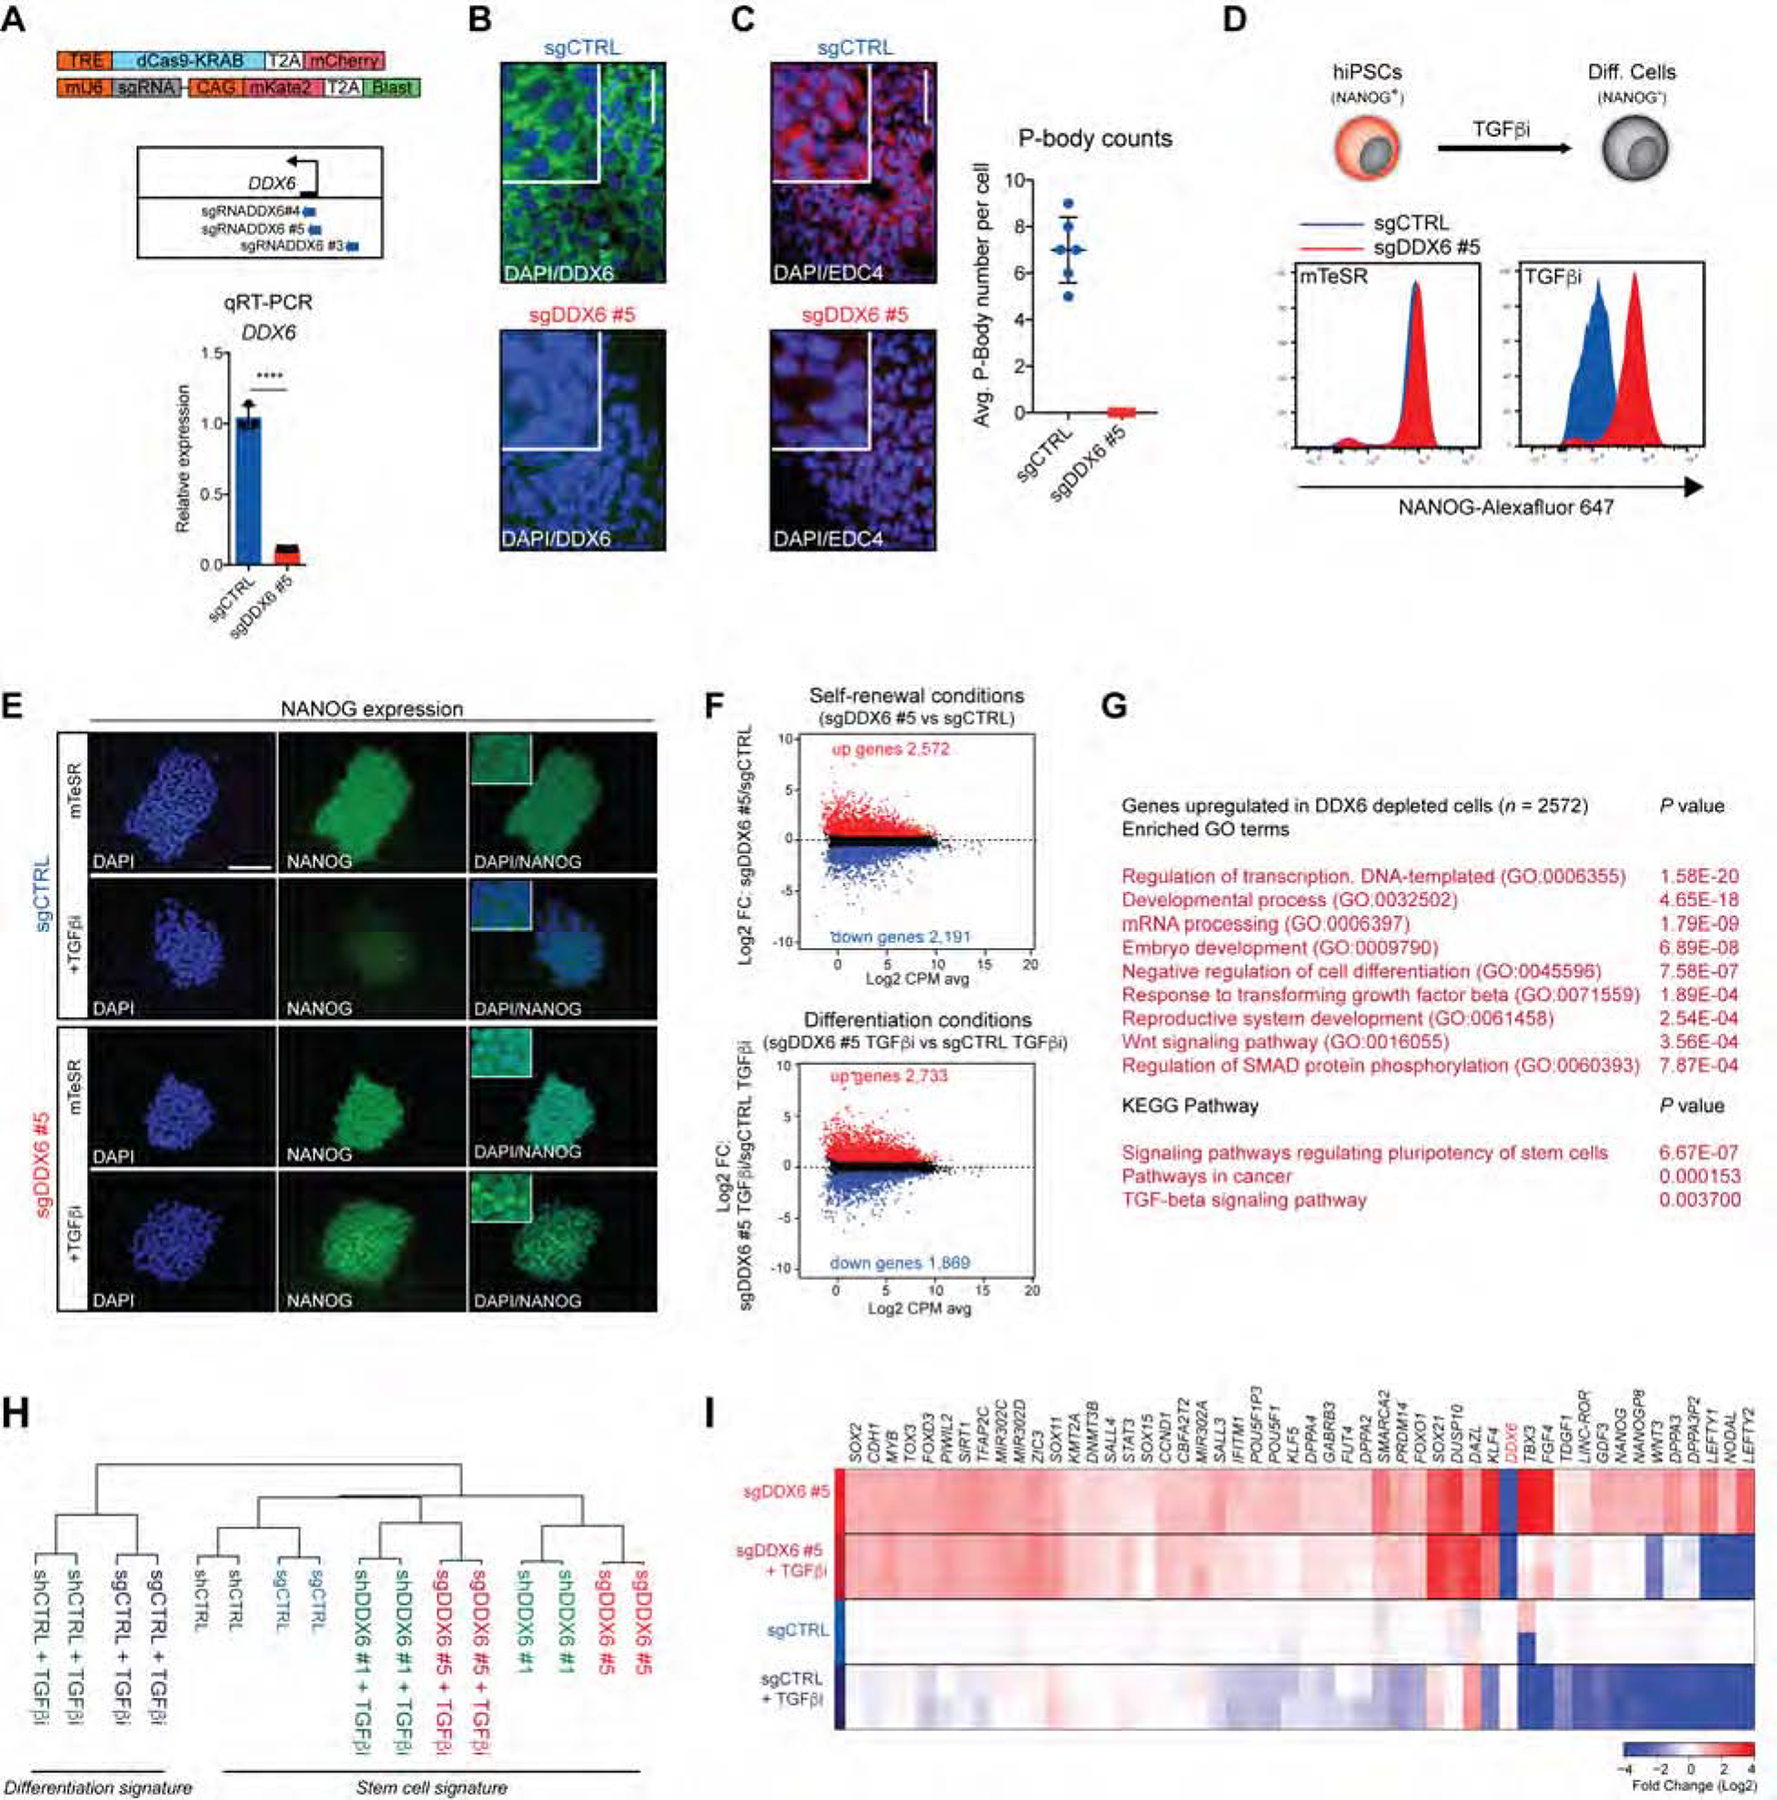
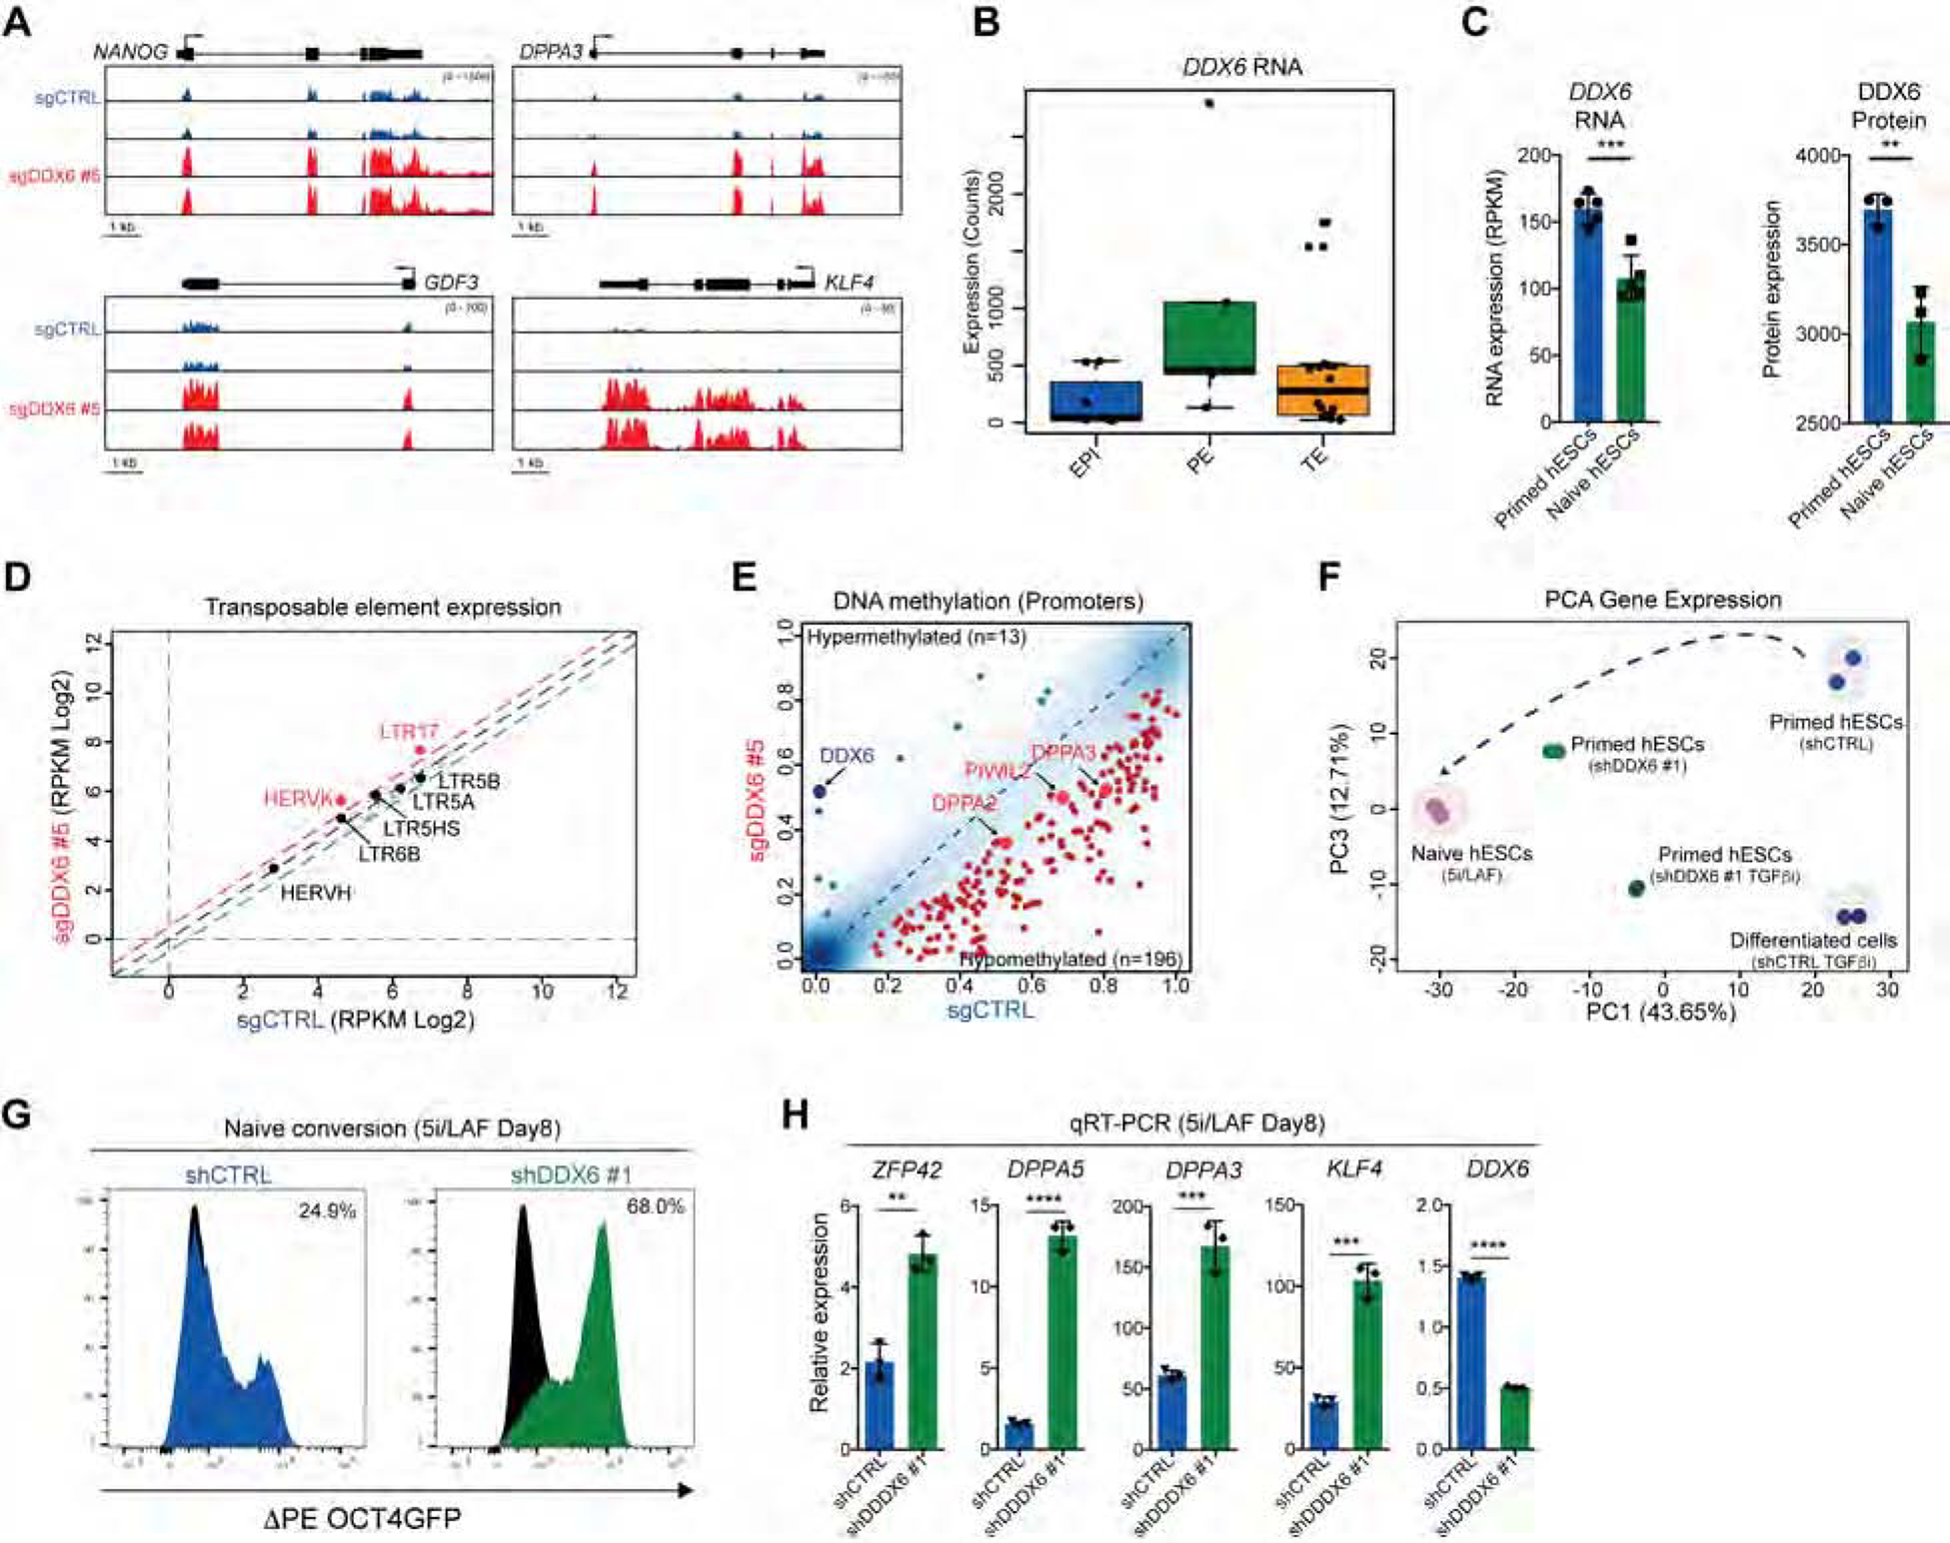
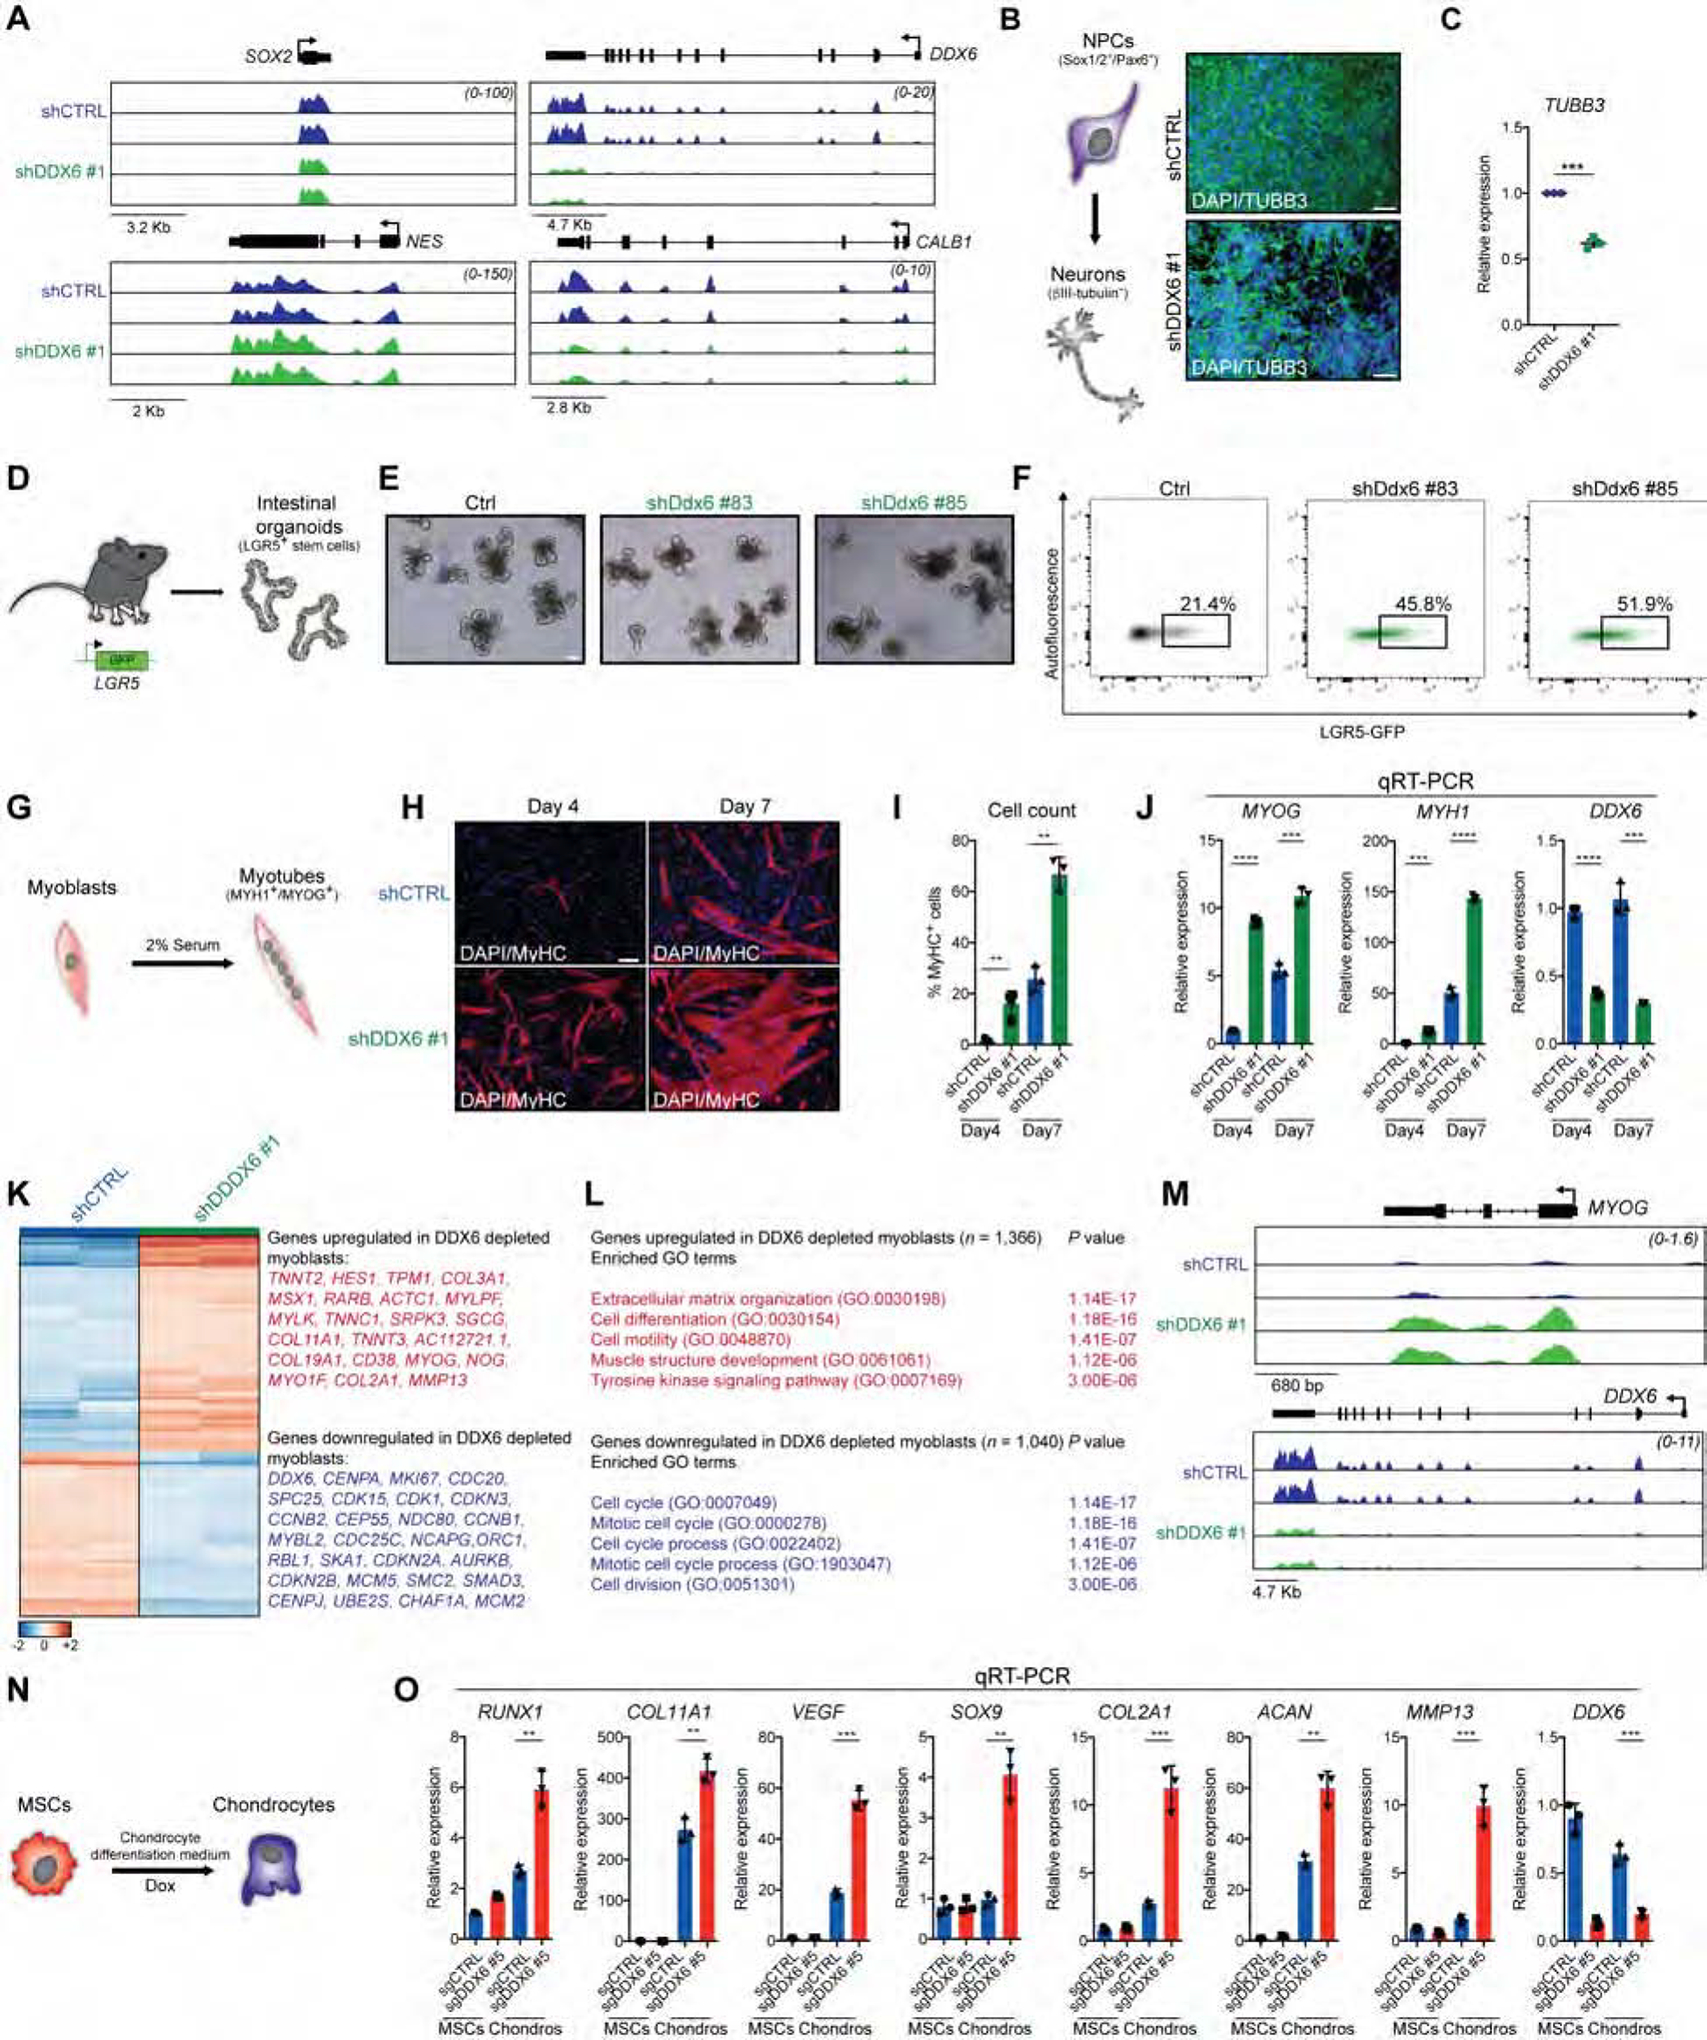
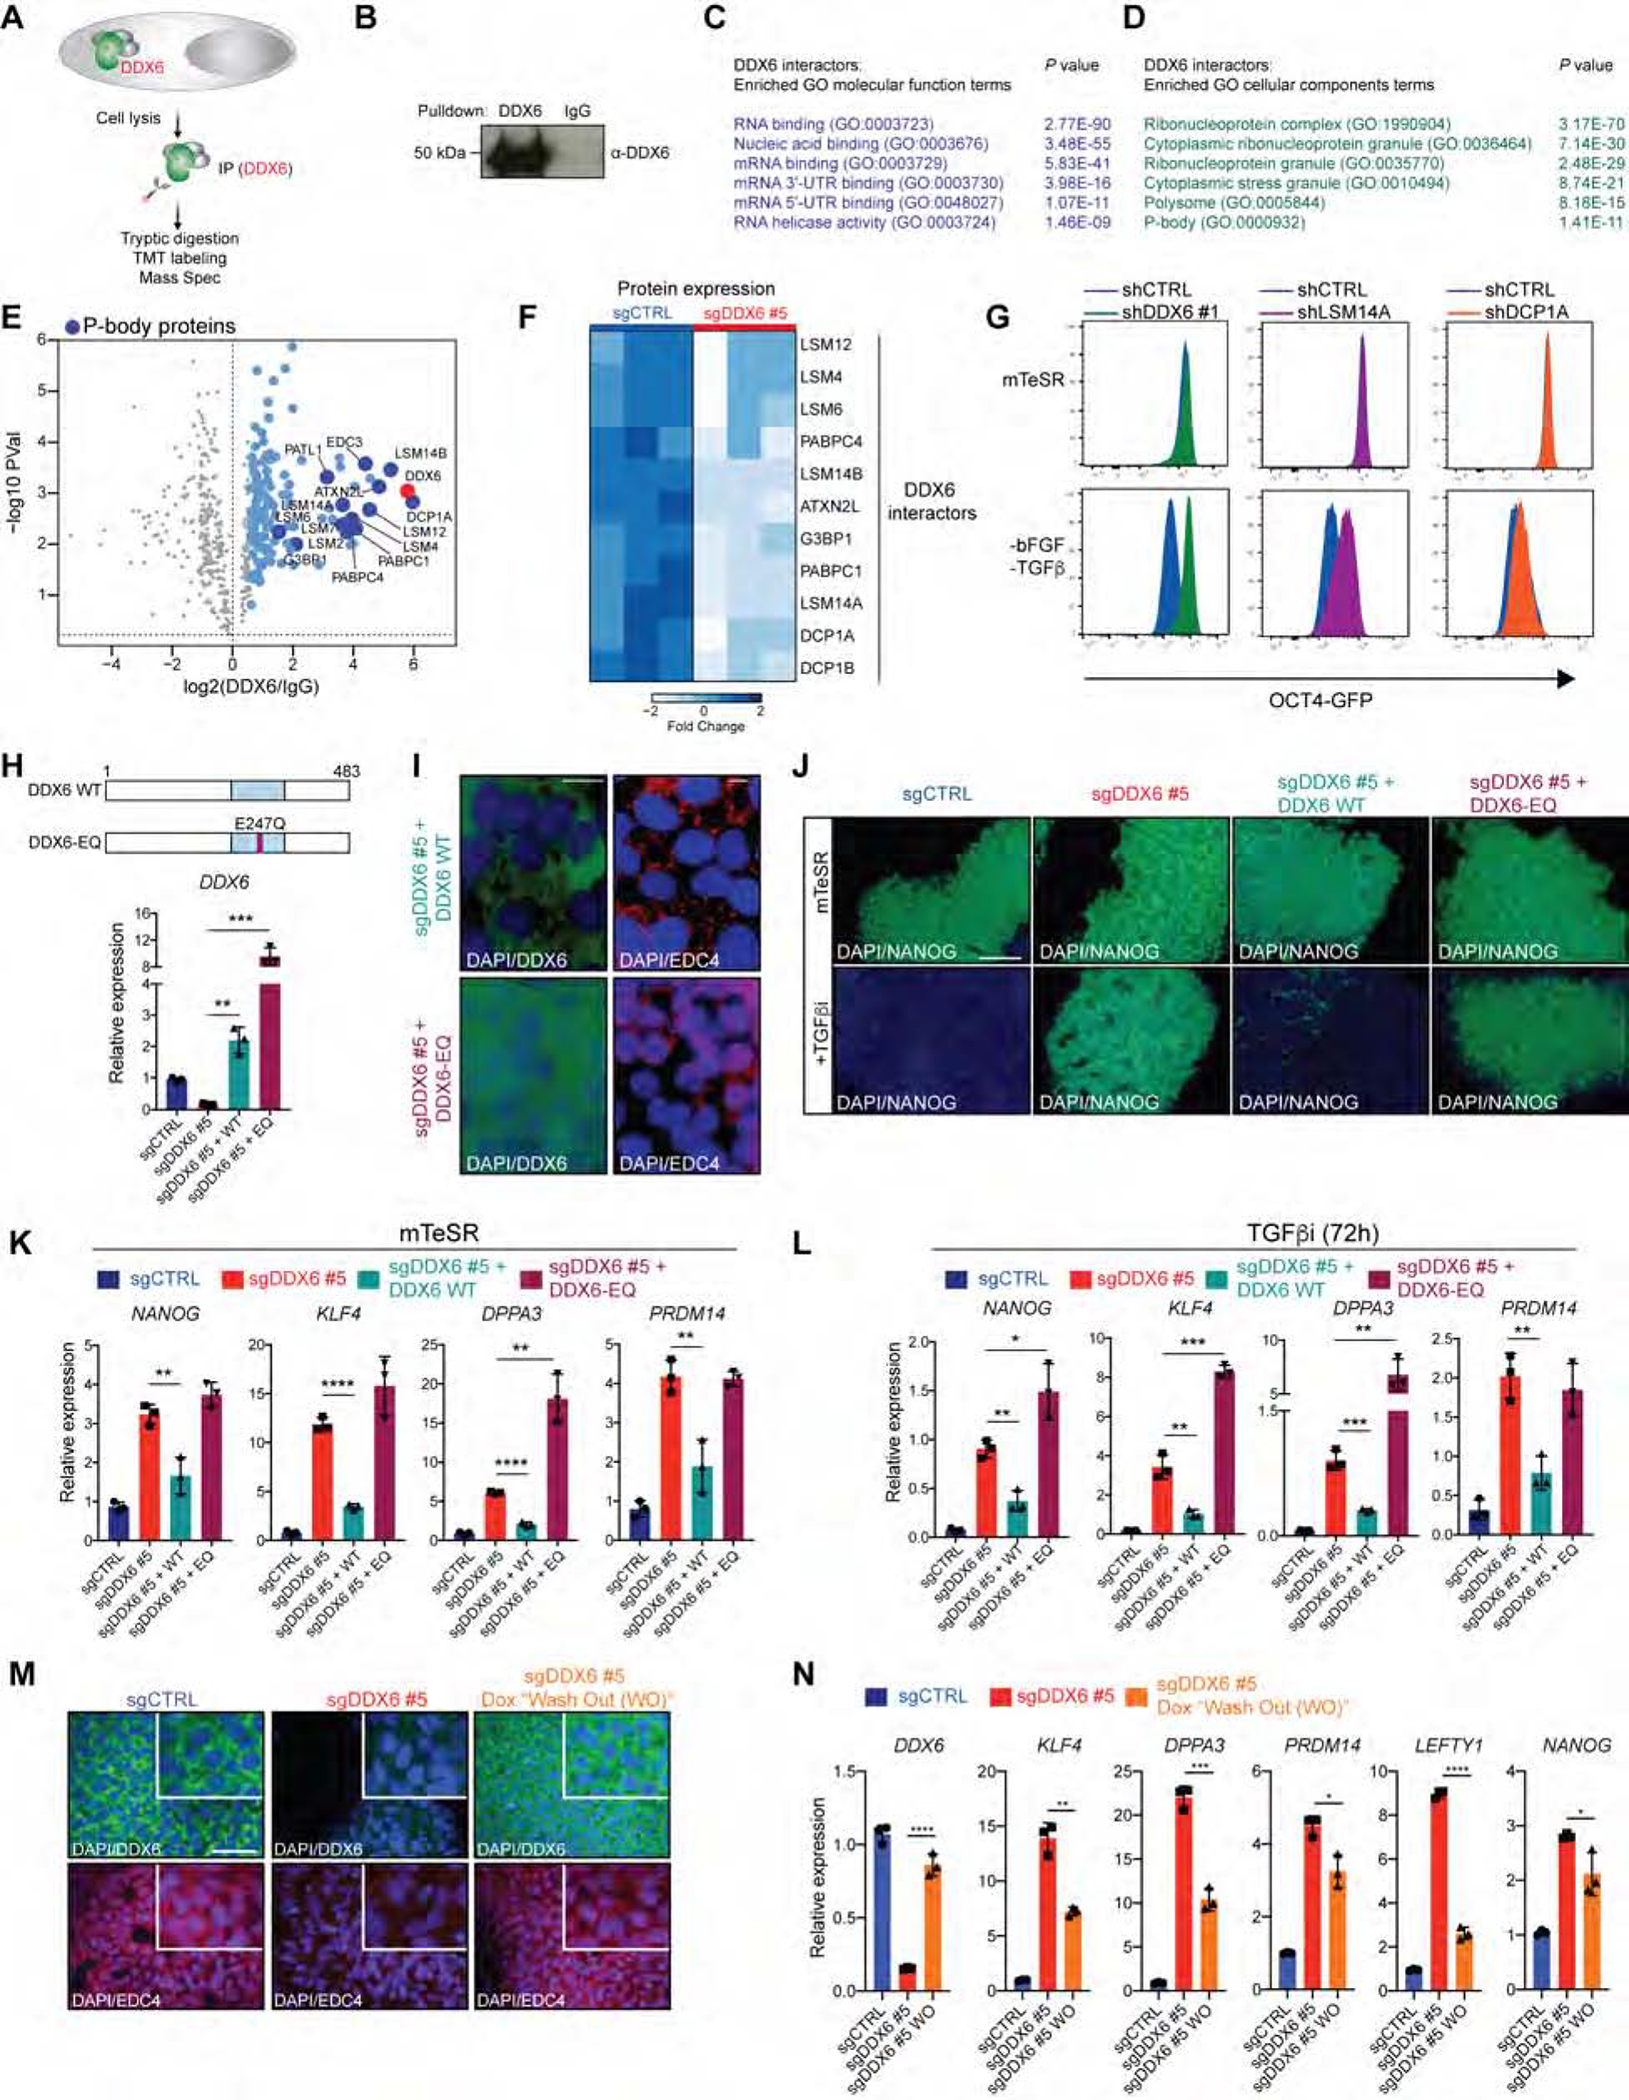
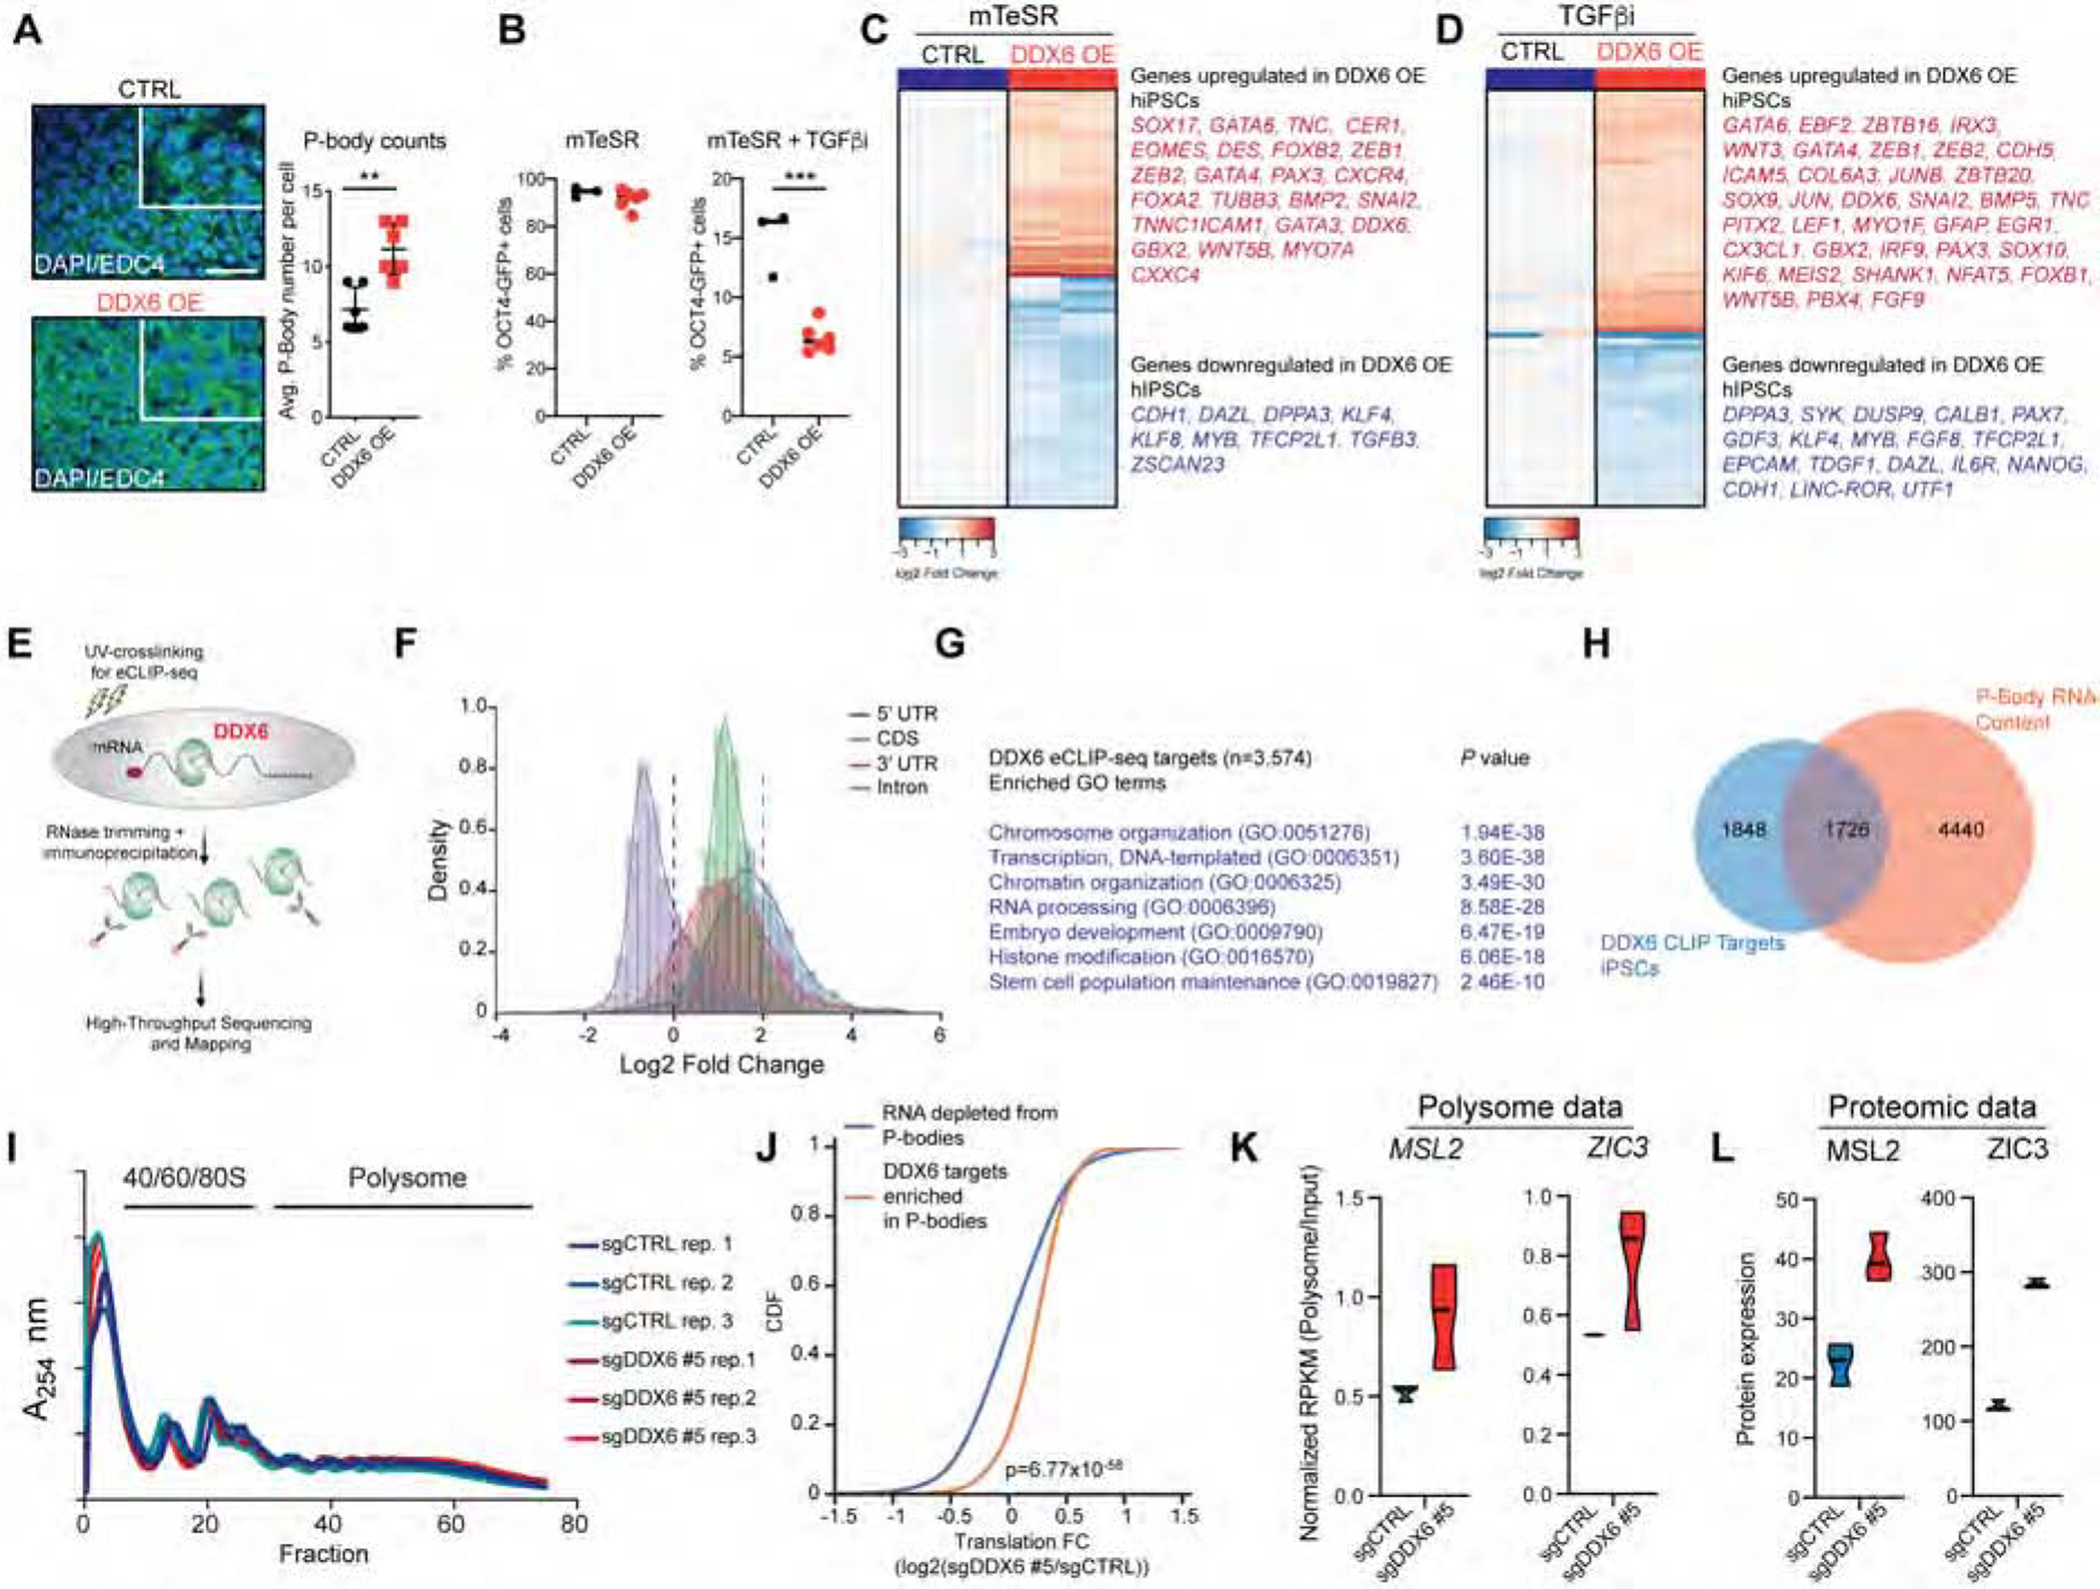
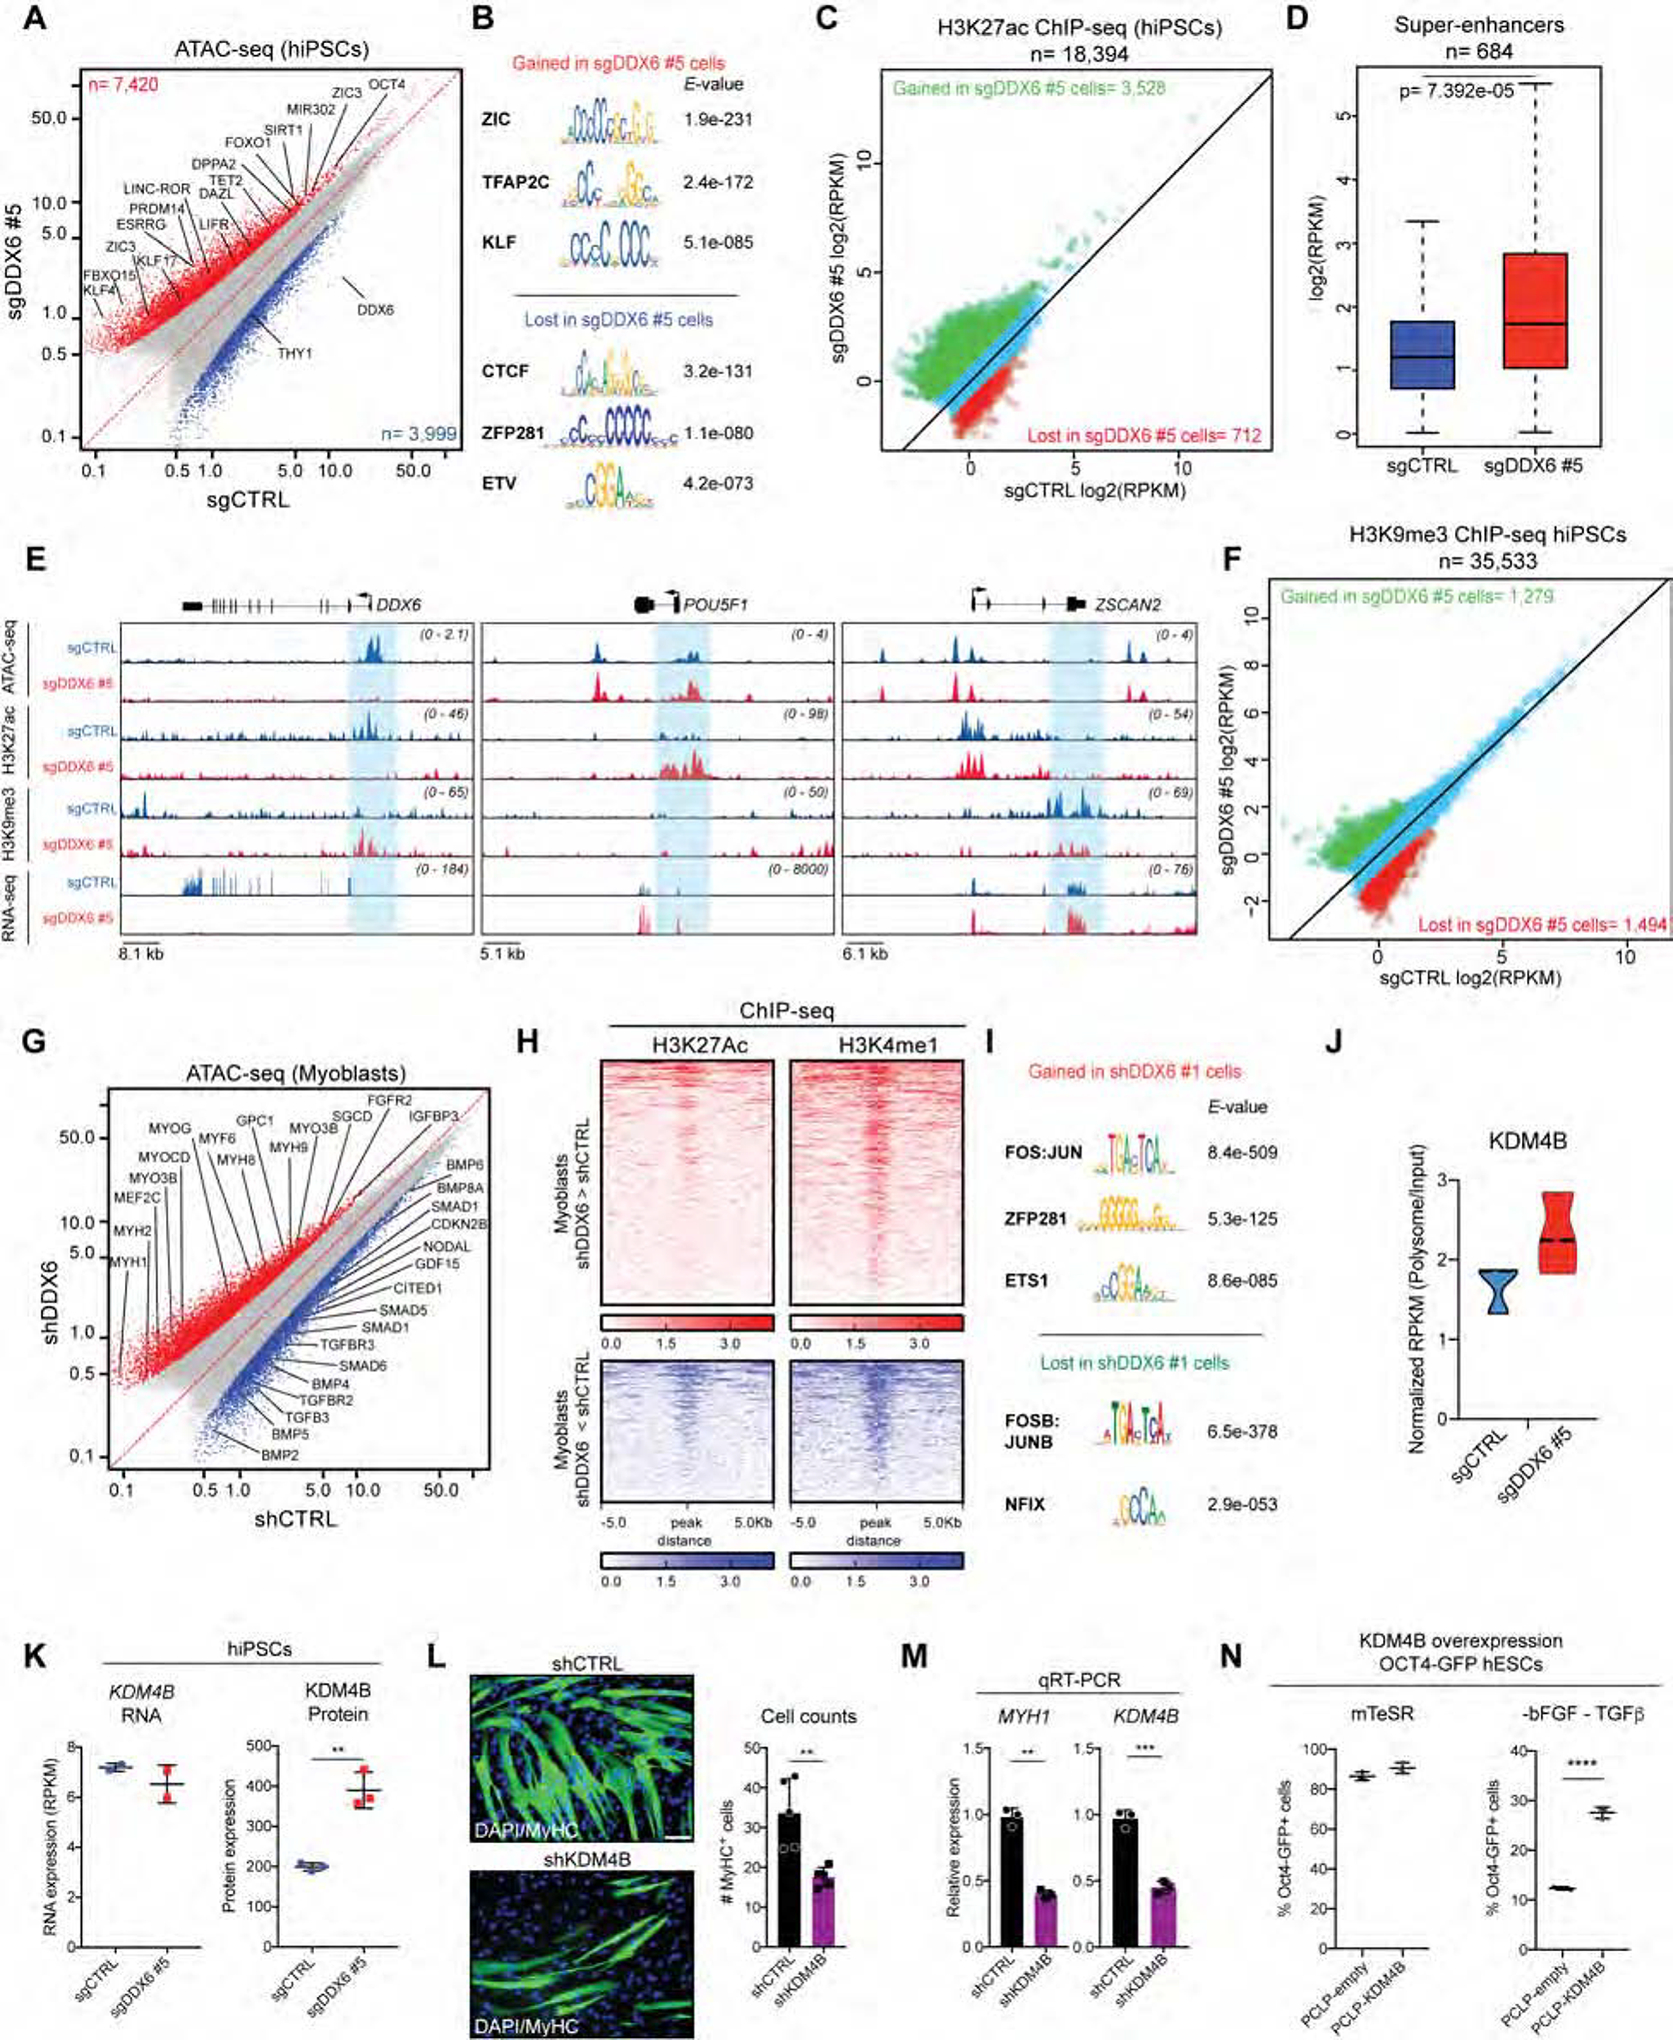
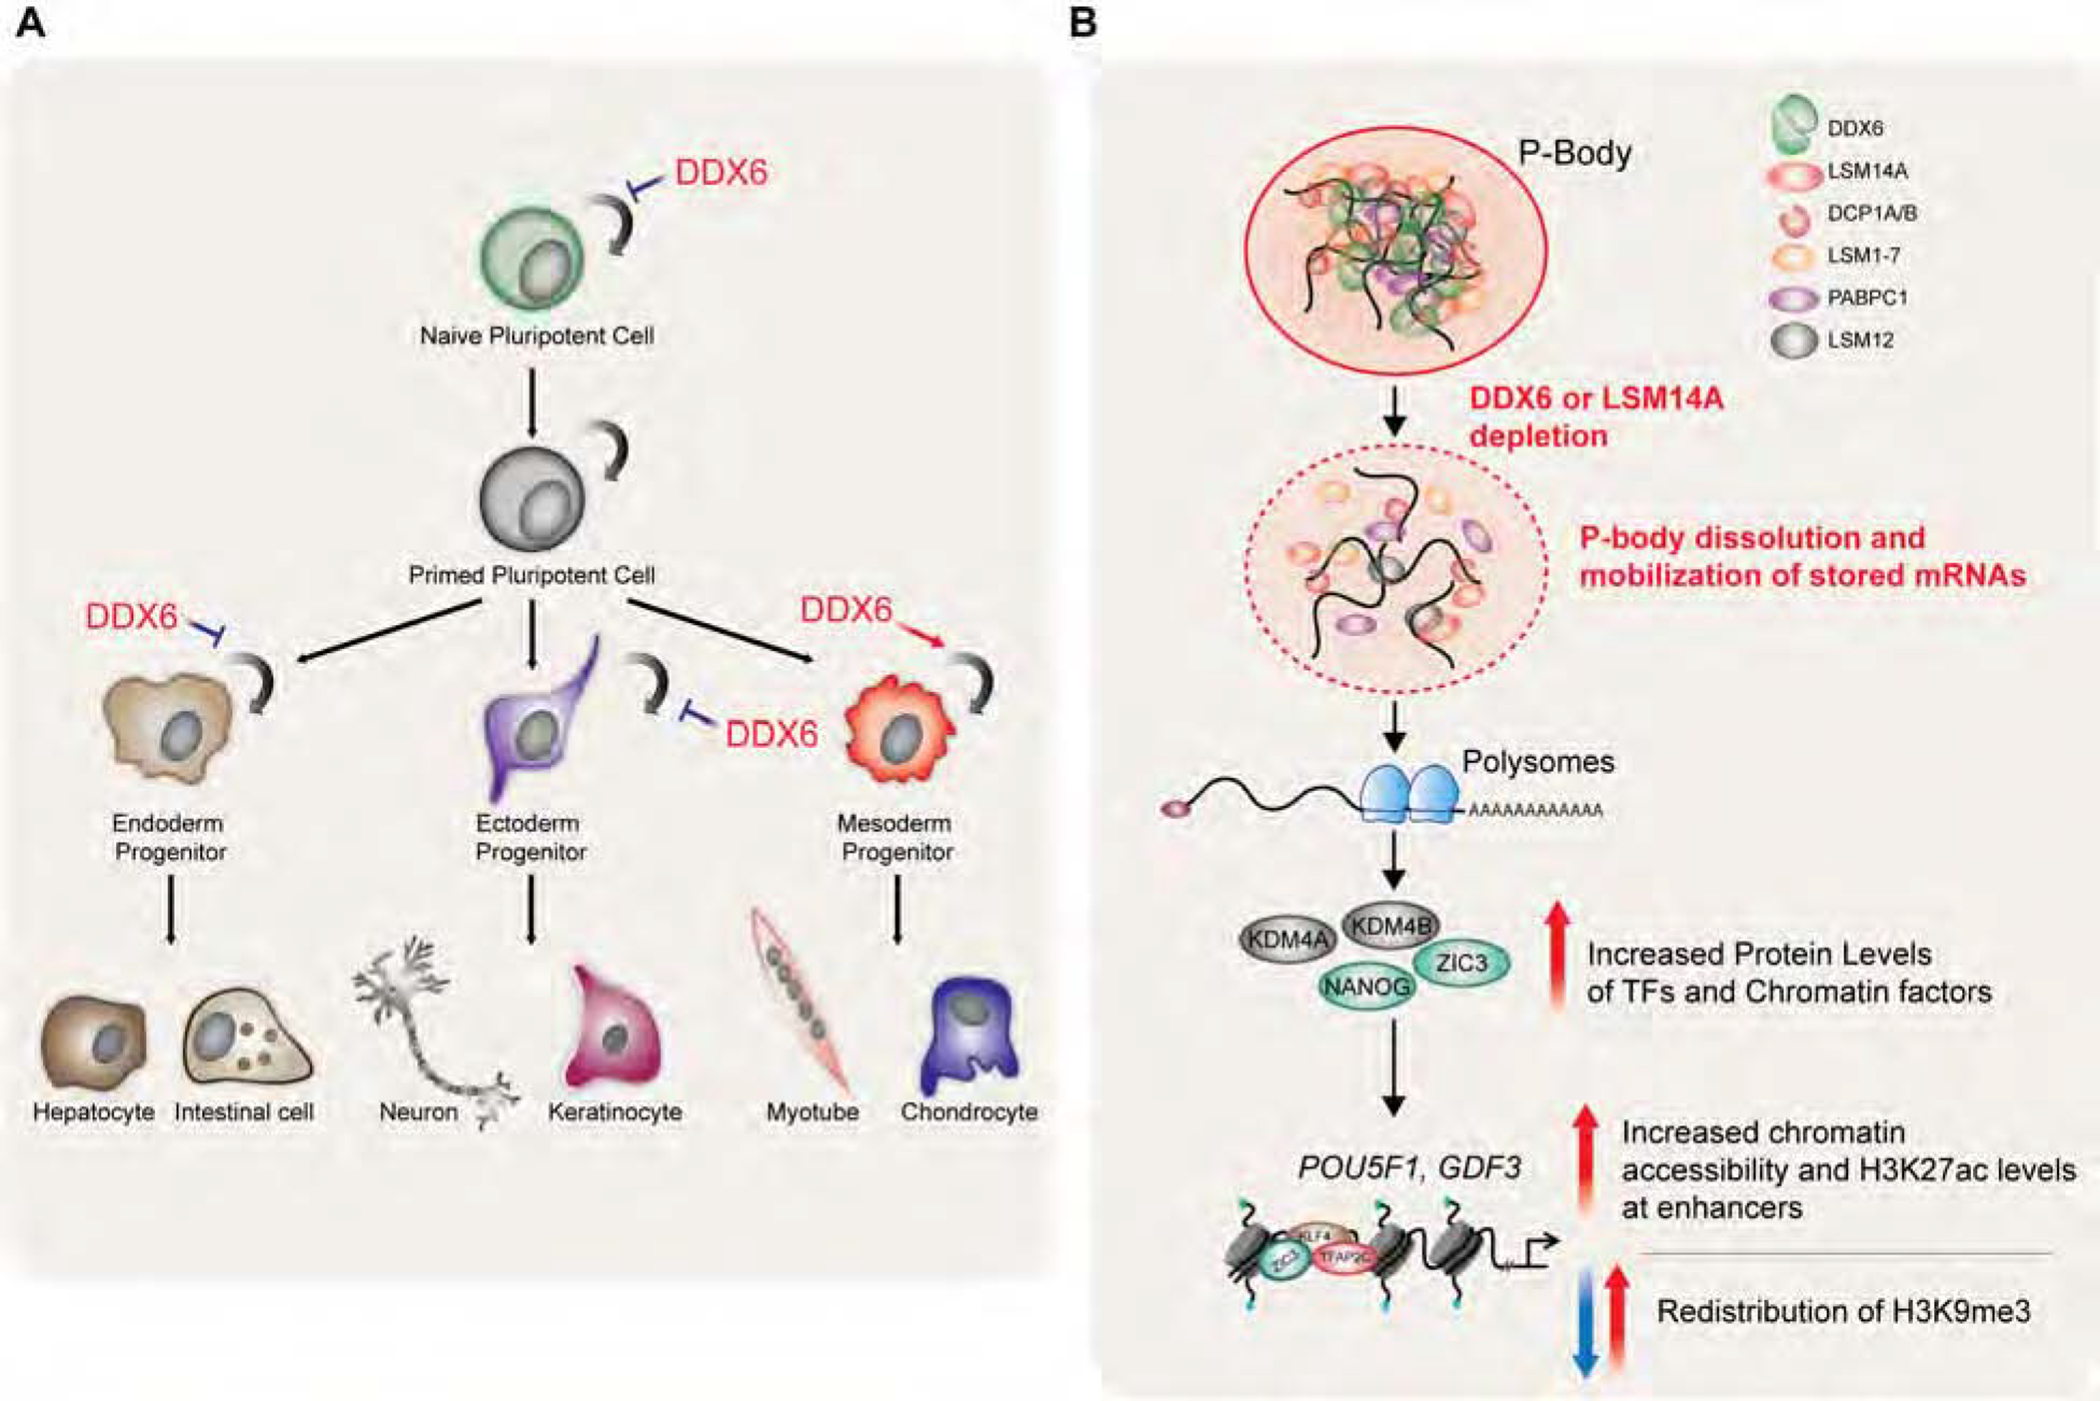
Post-transcriptional mechanisms have the potential to influence complex changes in gene expression, yet their role in cell fate transitions remains largely unexplored. Here, we show that suppression of the RNA helicase DDX6 endows human and mouse primed embryonic stem cells (ESCs) with a differentiation-resistant, "hyper-pluripotent" state, which readily reprograms to a naive state resembling the preimplantation embryo. We further demonstrate that DDX6 plays a key role in adult progenitors where it controls the balance between self-renewal and differentiation in a context-dependent manner. Mechanistically, DDX6 mediates the translational suppression of target mRNAs in P-bodies. Upon loss of DDX6 activity, P-bodies dissolve and release mRNAs encoding fate-instructive transcription and chromatin factors that re-enter the ribosome pool. Increased translation of these targets impacts cell fate by rewiring the enhancer, heterochromatin, and DNA methylation landscapes of undifferentiated cell types. Collectively, our data establish a link between P-body homeostasis, chromatin organization, and stem cell potency.

Keywords: P-body; RNA helicase DDX6; adult progenitor cells; chromatin; differentiation; embryonic stem cells; exit from pluripotency; naive pluripotency; post-transcriptional regulation; primed pluripotency; self-renewal.


Conflict of interest statement

DECLARATION OF INTERESTS

The authors declare no competing interests.

Figures

Figure 1.
Figure 1.. DDX6 depletion endows hPSCs with a differentiation-resistant, “hyper-pluripotent” state.
(A) Schematic of dCas9-KRAB and sgRNA vectors and genomic positions of the sgRNA targeting the DDX6 TSS (upper panel). QRT-PCR analysis of DDX6 in sgCTRL and sgDDX6 #5 cells treated with dox. Unpaired Student’s t test. n=3, mean ± s.d., ****P<0.0001. (B) Immunofluorescence image showing protein expression of DDX6 (scale: 50 μm; inset 2X). (C) Immunofluorescence image showing protein expression of EDC4 (scale: 50 μm; inset 2X) (left panel). P-body count per cell (right panel), n=6, mean ± s.d. (D) Schematic of hiPSCs differentiation (upper panel). FACS analysis of the proportion of NANOG+ cells (lower panel). (E) Immunofluorescence images showing protein expression of NANOG (scale: 100μm). (F) MA plots of RNA-seq data depicting upregulated genes in red and downregulated genes in blue (FC>1.5; FDR<0.01). (G) GO and KEGG pathways analysis of upregulated genes (FC>1.5; FDR<0.01) in sgDDX6 #5 vs sgCTRL cells. (H) Hierarchical clustering of RNA-seq samples. (I) Heatmap showing expression levels of selected pluripotency genes (n=2 each condition). See also Figures S1, S2 and S3.
Figure 2.
Figure 2.. Human ESCs depleted for DDX6 acquire naïve-like features.
(A) Gene tracks showing RNA-seq data. (B) Single cell RNA-seq data for DDX6 expression in human preimplantation embryos (Petropoulos et al., 2016). Epi: Epiblast; Pe: Primitive Endoderm; TE: trophectoderm. (C) RNA-seq and protein expression data for DDX6 in primed and naïve hESCs (Di Stefano et al., 2018). For RNA-seq data, n=5, mean ± s.d., unpaired Student’s t-test, ***P<0.001. For proteomic data, n=3, mean ± s.d., unpaired Student’s t-test, **P<0.01. (D) Analysis of repetitive element expression. Repeats with significant expression differences are indicated in red (FC>1.5, FDR <0.05). (E) Differentially methylated promoter regions in DDX6 depleted cells relative to control cells. Significantly hypomethylated promoters are shown in red (>10% difference, P<0.01); significantly hypermethylated promoters are shown in blue (>10% difference, P<0.01). (F) PCA analysis of RNA-seq data for the indicated samples based on differentially expressed genes between shDDX6 #1 and shCTRL hESCs. (G) Flow cytometric detection of ΔPE OCT4-GFP+ cells after reversion of primed hESCs to a naïve state in 5i/LAF medium. Black curve shows the negative control. (H) QRT-PCR analysis for the indicated genes after 8 days of 5i/LAF treatment. Values are represented respect to control cells at day 0. n=3, mean ± s.d., unpaired Student’s t-test, **P<0.01, ***P<0.001, ****P<0.0001. See also Figure S4.
Figure 3.
Figure 3.. DDX6 controls adult stem and progenitor cell potency.
(A) Gene tracks showing RNA-seq data for NPCs infected with shCTRL or shDDX6 #1 constructs. (B) Schematic of NPC to neuron differentiation (left panel). Immunofluorescence images showing βIII-tubulin protein expression (scale: 50μm, right panels). (C) Quantification of βIII-tubulin+ cells. (D) Schematic of intestinal organoid derivation from LGR5-GFP mice. (E) Phase images of intestinal organoids in 3D cultures (scale: 100μm). (F) Flow cytometric quantification of LGR5-GFP+ cells. (G) Schematic of myoblast to myotube differentiation. (H) Immunofluorescence images showing MyHC (myosin-heavy chain) protein expression after 4 and 7 days of differentiation (scale: 100μm). (I) Quantification of MyHC+ cells. (J) QRT-PCR analysis for the indicated genes in differentiating myoblasts. (K) Heatmap showing significantly differentially expressed genes (FC>1.5; FDR<0.001). (L) GO analysis of upregulated and downregulated genes (FC>1.5; FDR<0.001) in shDDX6 #1 vs shCTRL myoblasts. (M) Gene tracks showing individual genes from RNA-seq data. (N) Schematic of hiPSC to mesenchymal stem cell (MSC) differentiation. (O) QRT-PCR analysis for the indicated genes in MSCs and chondrocytes (Chondros). *p < 0.05; **p < 0.01; ***p < 0.001; ****p < 0.0001, unpaired Student’s t test. n=3, mean ± s.d. See also Figure S4.
Figure 4.
Figure 4.. P-body assembly by DDX6 is essential for exit from pluripotency.
(A) Schematic of the IP-MS protocol. (B) Western blot of immunoprecipitation experiments. (C) GO molecular function analysis of DDX6 interactors (FC>1.5). (D) GO cellular component analysis of DDX6 interactors (FC>1.5). (E) DDX6 IP-MS data, n=3, unpaired Student’s t-test, FC>1.5; P<0.05. (F) Heatmap showing protein expression changes determined by MS. (G) Flow cytometric quantification of OCT4-GFP+ hESCs in mTeSR1 and mTeSR1 lacking bFGF and TGFβ. (H) Schematic of DDX6 protein with E247Q mutation (red square) in the helicase domain (blue square) (upper panel). QRT-PCR analysis of DDX6 expression (lower panel). (I) Immunofluorescence image showing protein expression of DDX6 (scale: 10μm) and EDC4 (scale: 10μm). (J) Immunofluorescence image showing protein expression of NANOG (scale: 100μm). (K) QRT-PCR analysis of selected pluripotency genes. (L) QRT-PCR analysis of selected pluripotency genes. (M) Immunofluorescence image showing protein expression of DDX6 (scale: 50μm, inset 2X) and EDC4 (scale: 50μm, inset 2X) in sgCTRL, sgDDX6 #5 hiPSCs treated with dox for 1 weeks and sgDDX6 #5 “Wash Out” (WO) which have been treated with dox for 1 week followed by 7 days of dox withdrawal. (N) QRT-PCR analysis of selected pluripotency genes. *p < 0.05; **p < 0.01; ***p < 0.001; ****p < 0.0001, unpaired Student’s t test. n=3, mean ± s.d. See also Figure S5 and Tables S1 and S2.
Figure 5.
Figure 5.. Increased translation of DDX6 targets after P-body dissolution.
(A) Immunofluorescence image showing protein expression of EDC4 (scale: 50μm, inset 2X) in control and DDX6 overexpressing hESCs (left panel). P-body counts per cell (right panel), n=6, mean ± s.d. (B) Flow cytometric quantification of OCT4-GFP+ control (n=3) and DDX6 overexpressing (n=6) hESCs cultured in mTeSR1 and mTeSR1 supplemented with TGFβi. (C) Heatmap showing differentially expressed genes (FC>1.5; FDR<0.001) in control and DDX6 overexpressing hiPSCs cultured in mTeSR1. (D) Heatmap showing differentially expressed genes (FC>1.5; FDR<0.001) in control and DDX6 overexpressing hiPSCs cultured in mTeSR1 supplemented with TGFβi. (E) Schematic of the eCLIP-seq protocol. (F) Histogram of region-based fold change (FC) for DDX6 eCLIP-seq read density over size-matched input (FC>2; P<0.001). (G) GO analysis of DDX6 targets in hiPSCs (FC>2; P<0.001). (H) Venn diagram showing overlap for DDX6 eCLIP-seq targets (FC>2; P<0.001) and P-body-enriched mRNAs (Hubstenberger et al., 2017). (I) Polysome profile. (J) Cumulative distribution function (CDF) plot showing translation rate fold (log2) change (FC) of P-body enriched DDX6-target and non-target mRNAs for sgDDX6 #5 vs sgCTRL hiPSCs. Statistical significance was calculated using the Mann–Whitney U test. (K) Violin plots showing the Polysome/Input RPKM values for the indicated transcripts (n=3 each condition). (L) Violin plots showing expression values for the indicated proteins (n=3 each condition). See also Figure S6 and Table S3.
Figure 6.
Figure 6.. DDX6 depletion impacts chromatin organization of PSCs and adult progenitor cells.
(A) Scatter plot showing correlation of ATAC-seq data for sgCTRL (n=2) and sgDDX6 #5 (n=2) hiPSCs. Blue dots indicate genomic regions showing significantly decreased chromatin accessibility in DDX6 depleted cells (>1.5-fold change, P-value<0.001; n=3999); red dots indicate genomic regions showing significantly increased chromatin accessibility in DDX6 depleted cells (1.5-fold change, P-value<0.001; n=7420). (B) TF motif enrichment on sgDDX6 gained and lost ATAC-seq peaks. (C) Scatter plot showing H3K27ac ChIP-seq data for sgDDX6 #5 (n=2) and sgCTRL (n=2) hiPSCs. Red dots indicate genomic regions with significant decreased H3K27ac signal in DDX6 depleted cells (>2-fold change; n=712); green dots indicate genomic regions with significant increased H3K27ac signal in DDX6 depleted cells (2-fold change; n=3528). (D) H3K27ac signal at pluripotency-specific super-enhancers (n=684) in sgCTRL (n=2) and sgDDX6 (n=2) hiPSCs. Statistical significance was determined using a Student’s t-test. (E) Gene tracks of individual genes based on RNA-seq, ChIP-seq and ATAC-seq data. (F) Scatter plot showing H3K9me3 ChIP-seq data for sgCTRL (n=2) and sgDDX6 #5 (n=2) hiPSCs. Red dots indicate genomic regions showing significantly decreased H3K9me3 coverage in DDX6 depleted cells (>2-fold change; n=1494); green dots indicate genomic regions with significantly increased H3K9me3 signal in DDX6 depleted cells (2-fold change; n=1279). (G) Scatter plot showing correlation of ATAC-seq data for shCTRL- (n=2) and shDDX6-infected (n=2) human myoblasts. Blue dots indicate genomic regions with significantly decreased chromatin accessibility in DDX6 depleted cells (>1.5-fold change, P-value<0.001; n=1099); red dots indicate genomic regions with significantly increased chromatin accessibility in DDX6 depleted cells (1.5-fold change, P-value<0.001; n=1864). (H) Heatmaps showing enrichment of the indicated histone modifications for regions that gained and lost ATAC-seq peaks in shDDX6 myoblasts relative to control. (I) TF motif enrichment for regions that gained and lost ATAC-seq peaks in shDDX6 myoblasts relative to control. (J) Violin plots showing the Polysome/Input RPKM values for KDM4B (n=3 each condition) in hiPSCs. (K) KDM4B mRNA (n=2, mean ± s.d.) and protein expression levels in hiPSCs (n=3, mean ± s.d.), unpaired Student’s t-test, **P<0.01. (L) Immunofluorescence images showing MyHC protein expression (left panel). Quantification of MyHC+ cells (right panel). n=4, mean ± s.d., unpaired Student’s t-test, **P<0.01 (scale: 100μm, left panel). (M) QRT-PCR analysis for the indicated genes in differentiating myoblast cultures. n=3, mean ± s.d., unpaired Student’s t-test, **P<0.01, ***P<0.001. (N) Flow cytometric quantification of OCT4-GFP+ hESCs infected with the empty retroviral vector PCLP or PCLP-KDM4B and cultured in mTeSR1 and mTeSR1 lacking bFGF and TGFβ. See also Figure S7 and Table S4.
Figure 7.
Figure 7.. P-body assembly controls stem cell potency.
(A) Summary of phenotypes in DDX6 depleted stem cell populations. (B) Model proposing how DDX6 impacts cell fate through modulation of P-body homeostasis.

Comment in

References

    1. Anders S, Pyl PT, and Huber W (2015). HTSeq--a Python framework to work with high-throughput sequencing data. Bioinformatics 31, 166–169. - PMC - PubMed
    1. Apostolou E, and Hochedlinger K (2013). Chromatin dynamics during cellular reprogramming. Nature 502, 462–471. - PMC - PubMed
    1. Ayache J, Benard M, Ernoult-Lange M, Minshall N, Standart N, Kress M, and Weil D (2015). P-body assembly requires DDX6 repression complexes rather than decay or Ataxin2/2L complexes. Mol Biol Cell 26, 2579–2595. - PMC - PubMed
    1. Bailey TL, Boden M, Buske FA, Frith M, Grant CE, Clementi L, Ren J, Li WW, and Noble WS (2009). MEME SUITE: tools for motif discovery and searching. Nucleic Acids Res 37, W202–208. - PMC - PubMed
    1. Batista PJ, Molinie B, Wang J, Qu K, Zhang J, Li L, Bouley DM, Lujan E, Haddad B, Daneshvar K, et al. (2014). m(6)A RNA modification controls cell fate transition in mammalian embryonic stem cells. Cell stem cell 15, 707–719. - PMC - PubMed

Publication types

MeSH terms