. 2019 Jun 7;10(29):7111-7118.
doi: 10.1039/c9sc02301a. eCollection 2019 Aug 7.

Intracellular MicroRNA imaging using telomerase-catalyzed FRET ratioflares with signal amplification

Affiliations

Intracellular MicroRNA imaging using telomerase-catalyzed FRET ratioflares with signal amplification

Liman Xian et al. Chem Sci. .

Abstract

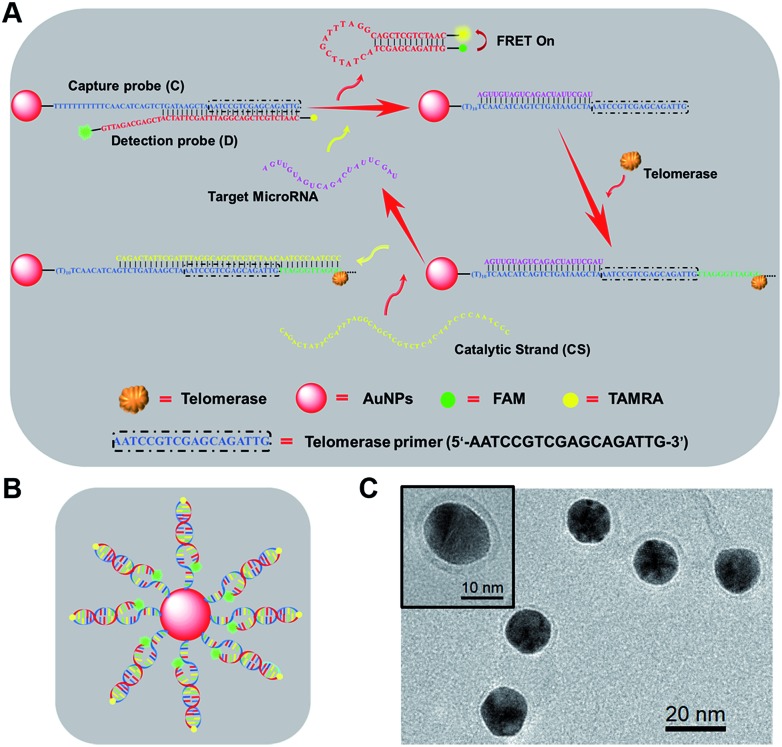
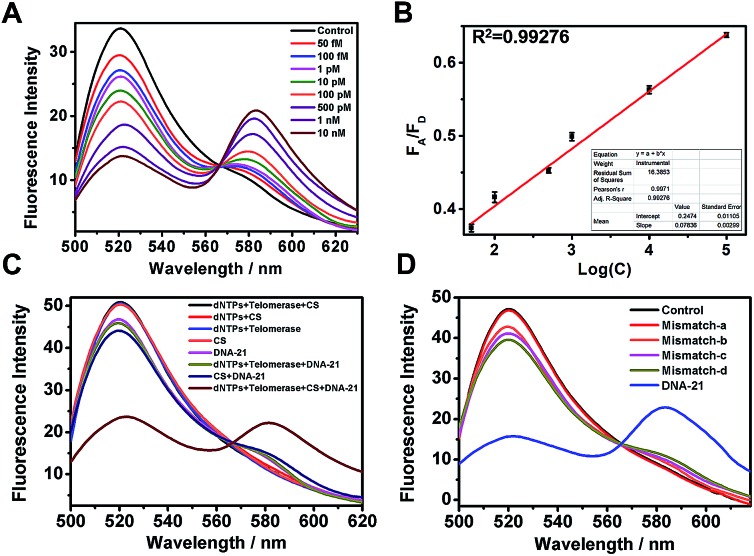
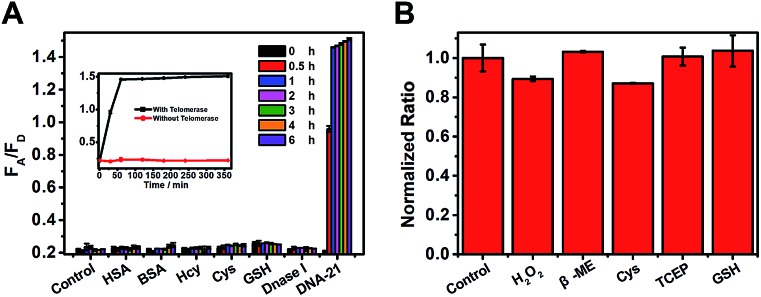
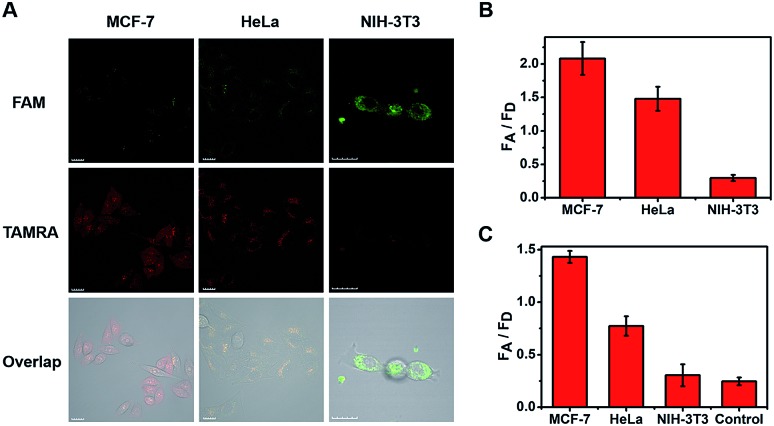
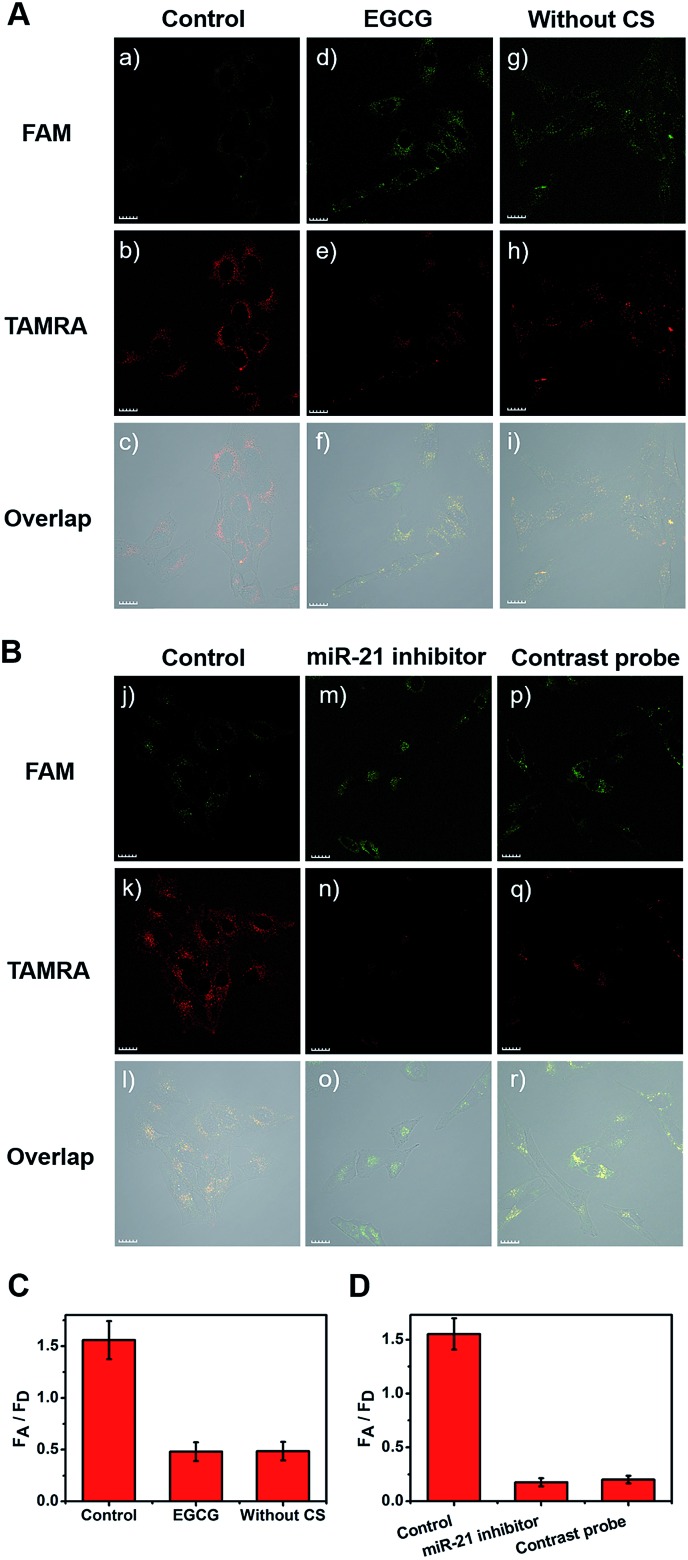
Intracellular microRNA (miRNA) detection has attracted increasing attention, resulting in significant achievements. However, the development of an available tool that possesses a satisfactory signal-to-background ratio and high sensitivity for miRNA detection remains challenging. Herein, a class of telomerase-catalyzed FRET (fluorescence resonance energy transfer) ratioflares has been developed for the accurate sensing of low-abundance cancer-related miRNA both in a fluorescence assay and living cell imaging with signal amplification capacity. In this work, endogenous telomerase is led in a miRNA test system with signal amplification for the first time, wherein telomerase extends hexamer telomeric repeats (TTAGGG) using the 3' end of the capture probe as the primer. The synergetic work of telomerase and the catalyst strand (CS) makes the target miRNA circulate in the system, resulting in high sensitivity and an enhanced FRET signal an improved detection limit of 2.27 × 10⁻¹⁵ M. Meanwhile, telomerase-catalyzed FRET ratioflares allow the difference between cancer cells and normal cells to be increased reliably. Furthermore, low false positive signals resulting from chemical interference and minimized system fluctuations are achieved through ratiometric measurements.


Figures

Scheme 1
Scheme 1. (A) Working principle of telomerase-catalyzed FRET ratioflares with signal amplification based on specific sequence responsive. (B) Design of telomerase-catalyzed FRET ratioflares. (C) Transmission electron microscopy (TEM) of telomerase-catalyzed FRET ratioflares.
Fig. 1
Fig. 1. (A) Fluorescence spectra determination at various DNA template concentrations from 50 fM to 10 nM. (B) Linear relationship between FA/FD signal and log concentration (Log(C)) of the DNA template. (C) Fluorescence spectra determination with or without each component of the testing system when DNA template was presence or absent. Ratioflare concentration was fixed at 2 nM in each group. (D) Distinguishing middle-mismatched templates (mismatch-a and mismatch-b) and terminal-mismatched templates (mismatch-c and mismatch-d) from complementary target DNA-21. No template was added in the control group. Error bars show standard deviations of three replicates. λex = 492 nm, λem(FAM) = 520 nm, λem(TAMRA) = 580 nm.
Fig. 2
Fig. 2. (A) FRET fluorescence signal toward various analytes. 10 nM for DNA-21 template and 5 mM (500 equiv.) for all other analytes. Each bar represents relative responses at 0 h (black), 0.5 h (red), 1 h (blue), 2 h (pink), 3 h (green), 4 h (orange), and 6 h (purple) after adding the appropriate analytes. (B) Normalized fluorescence emission signal of telomerase-catalyzed FRET ratioflares (2 nM) after 12 h of incubation with different reactive additives, showing the stability of the probes with respect to the reactive additives. Error bars show standard deviations of three replicates. λex = 492 nm, λem(FAM) = 520 nm, λem(TAMRA) = 580 nm.
Fig. 3
Fig. 3. (A) One-photon confocal fluorescence imaging of miR-21 in MCF-7, HeLa, and NIH-3T3 cells after incubation with ratioflares for 120 min. λex = 488 nm, λem(FAM) = 500–540 nm, λem(TAMRA) = 560–600 nm. Scale bar = 20 μm. (B) Average fluorescence intensity ratio between FAM channel and TAMRA channel after incubation for 120 min with ratioflares in three types of living cell. (C) FA/FD signal from cell-derived lysates of MCF-7, HeLa, and NIH-3T3 cells. Only telomerase-catalyzed FRET ratioflares were added to the control group.
Fig. 4
Fig. 4. One-photon confocal fluorescence imaging of miR-21 in HeLa cells after incubation with telomerase-catalyzed FRET ratioflares for 120 min. (A) group (a–c) was a control group, group (d–f) was treated with EGCG to inhibit the telomerase activity, group (g–i) did not contain catalyst strand. (B) group (j–l) was a control group, group (m–o) was treated with anti-miR-21 sequence to inhibit the miR-21 concentration, and group (p–r) was treated with contrastive probes. (C) Average fluorescence intensity ratio between FAM channel and TAMRA channel after incubating with EGCG and without CS. (D) Average fluorescence intensity ratio between FAM channel and TAMRA channel after incubating with anti-miR-21 sequence and contrastive probes. λex = 488 nm, λem(FAM) = 500–540 nm, λem(TAMRA) = 560–600 nm. Scale bar = 20 μm.

References

    1. Xia Y. Q., Zhang R. L., Wang Z. L., Tian J., Chen X. Y. Chem. Soc. Rev. 2017;46:2824. - PMC - PubMed
    1. Almeida M. I., Reis R. M., Calin G. A. Mutat. Res., Fundam. Mol. Mech. Mutagen. 2011;717:1. - PubMed
    1. Lu J., Getz G., Miska E. A., Alvarez-Saavedra E., Lamb J., Peck D., Sweet-Cordero A., Ebert B. L., Mak R. H., Ferrando A. A., Downing J. R., Jacks T., Horvitz H. R., Golub T. R. Nature. 2005;435:834. - PubMed
    1. He L., Thomson J. M., Hemann M. T., Hernando-Monge E., Mu D., Goodson S., Powers S., Cordon-Cardo C., Lowe S. W., Hannon G. J., Hammond S. M. Nature. 2005;435:828. - PMC - PubMed
    1. Bartel D. P. Cell. 2004;116:281. - PubMed