

Towards Reliable and Quantitative Surface-Enhanced Raman Scattering (SERS): From Key Parameters to Good Analytical Practice
- PMID: 31588641
- PMCID: PMC7154527
- DOI: 10.1002/anie.201908154
Towards Reliable and Quantitative Surface-Enhanced Raman Scattering (SERS): From Key Parameters to Good Analytical Practice
Abstract
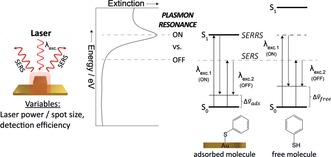
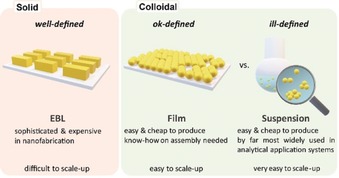
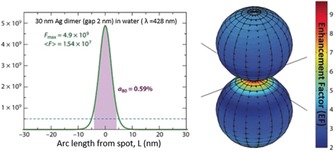
Experimental results obtained in different laboratories world-wide by researchers using surface-enhanced Raman scattering (SERS) can differ significantly. We, an international team of scientists with long-standing expertise in SERS, address this issue from our perspective by presenting considerations on reliable and quantitative SERS. The central idea of this joint effort is to highlight key parameters and pitfalls that are often encountered in the literature. To that end, we provide here a series of recommendations on: a) the characterization of solid and colloidal SERS substrates by correlative electron and optical microscopy and spectroscopy, b) on the determination of the SERS enhancement factor (EF), including suitable Raman reporter/probe molecules, and finally on c) good analytical practice. We hope that both newcomers and specialists will benefit from these recommendations to increase the inter-laboratory comparability of experimental SERS results and further establish SERS as an analytical tool.
Keywords: Raman spectroscopy; SERS; enhancement factor; quantitative analysis.
© 2019 The Authors. Published by Wiley-VCH Verlag GmbH & Co. KGaA.
Conflict of interest statement
The authors declare no conflict of interest.
Figures
References
-
- Le Ru E. C., Etchegoin P. G., Principles of Surface-Enhanced Raman Spectroscopy and Related Plasmonic Effects, Elsevier, Amsterdam, Boston, 2009.
-
- None
-
- Schlücker S., Angew. Chem. Int. Ed. 2014, 53, 4756; - PubMed
- Angew. Chem. 2014, 126, 4852;
-
- Procházka M., Surface-enhanced Raman Spectroscopy. Bioanalytical, biomolecular and medical applications, Springer, Cham, 2016;
-
- Zhan C., Chen X.-J., Yi J., Li J.-F., Wu D.-Y., Tian Z.-Q., Nat. Rev. Chem. 2018, 2, 216;
Publication types
LinkOut - more resources
Full Text Sources
Other Literature Sources
Miscellaneous
