. 2019 Oct 7:8:e49631.
doi: 10.7554/eLife.49631.

Stimulation of Piezo1 by mechanical signals promotes bone anabolism

Affiliations

Stimulation of Piezo1 by mechanical signals promotes bone anabolism

Xuehua Li et al. Elife. .

Abstract

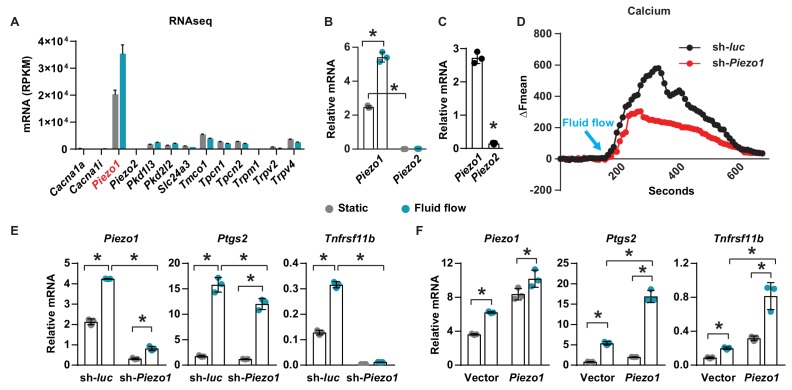
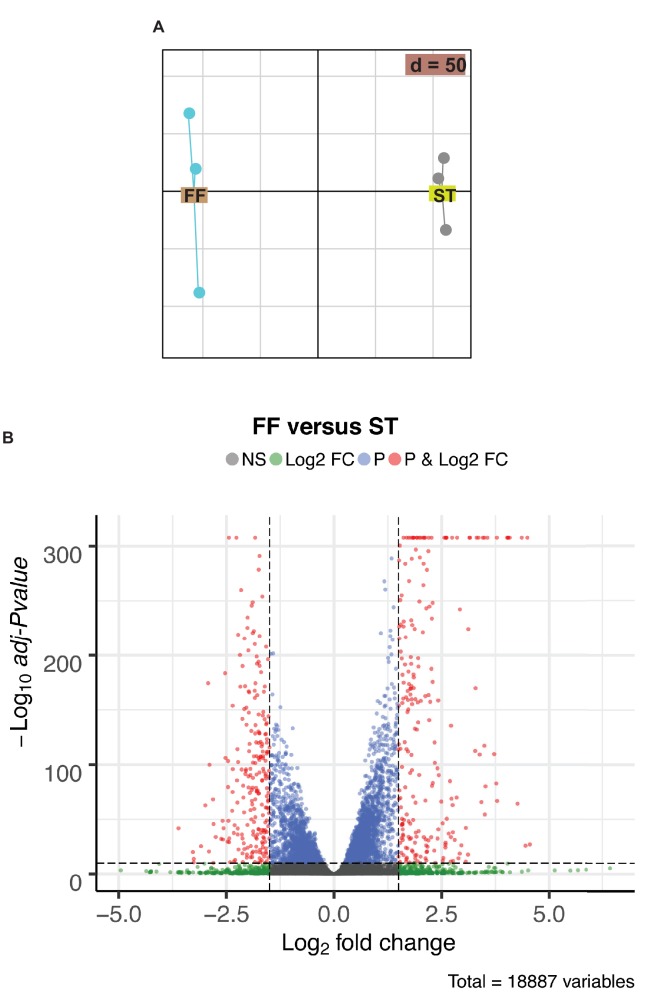
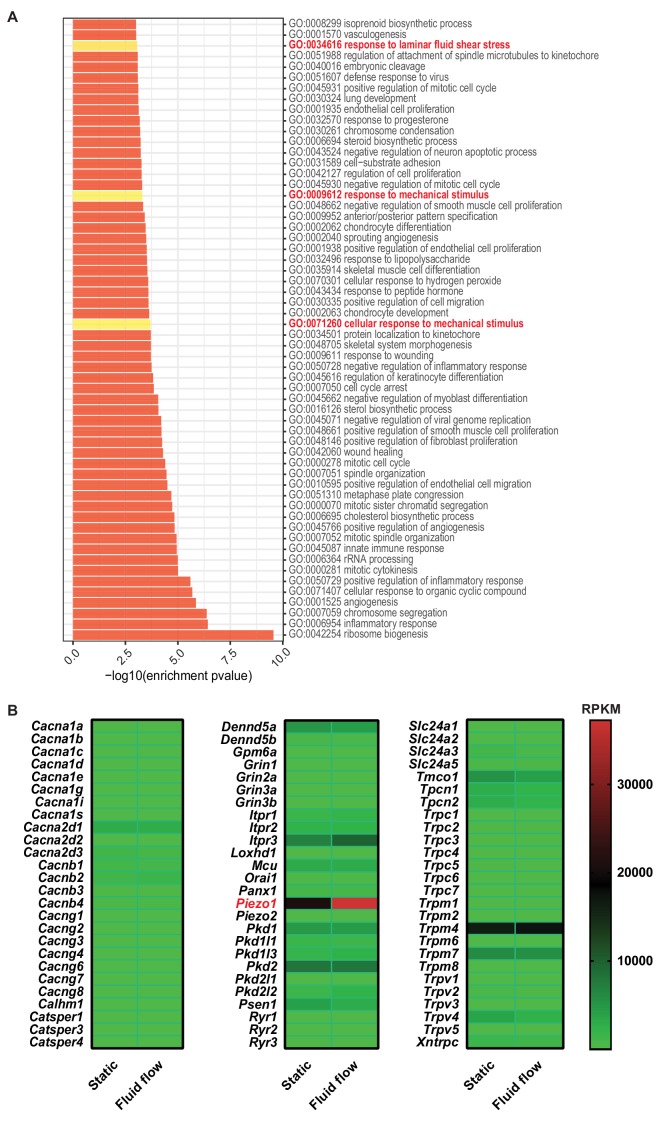
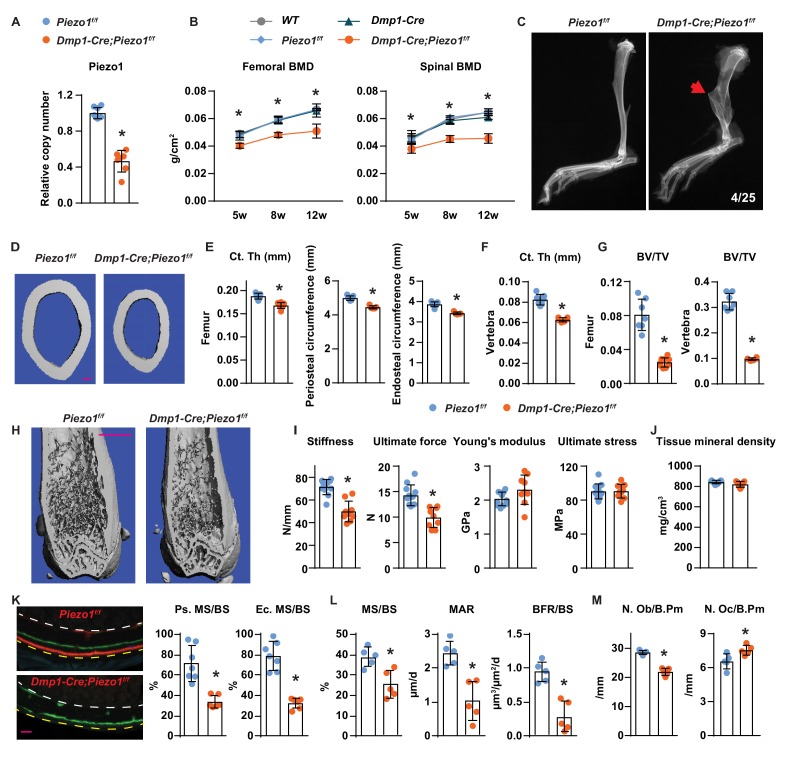
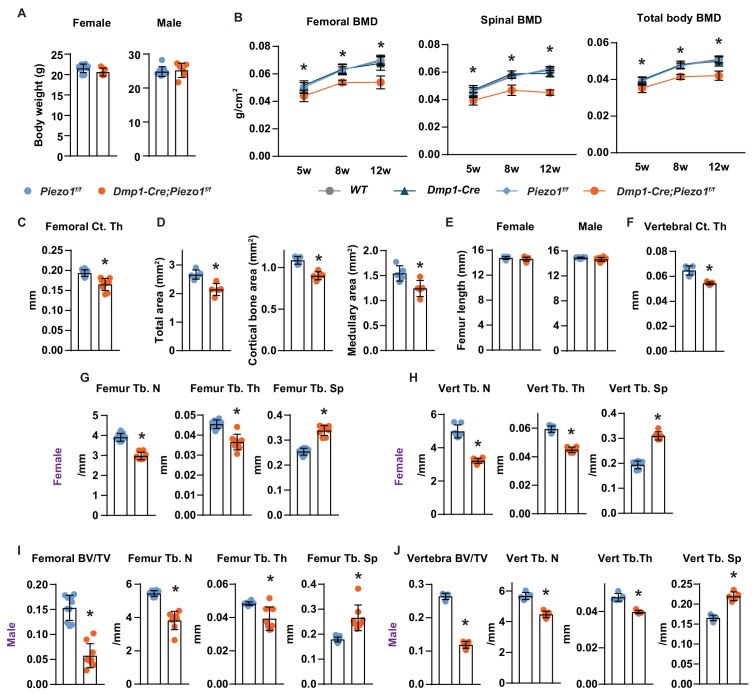
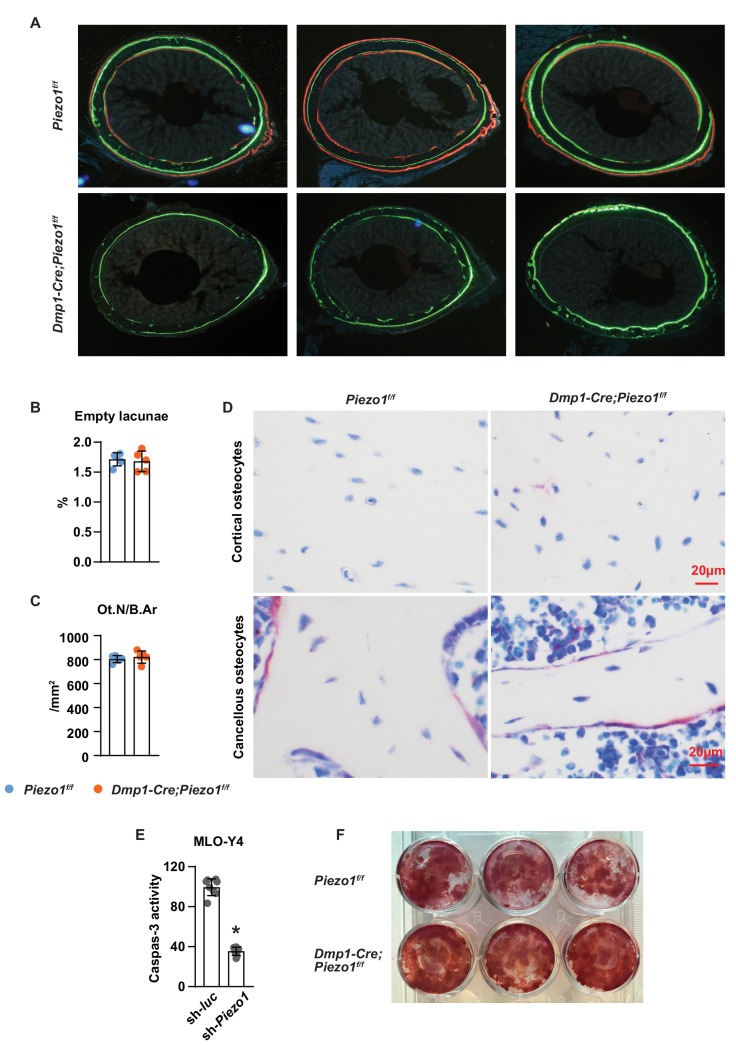
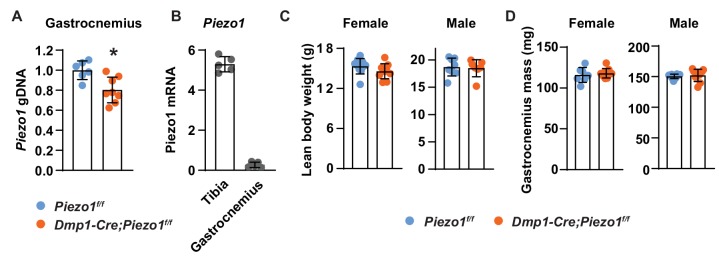
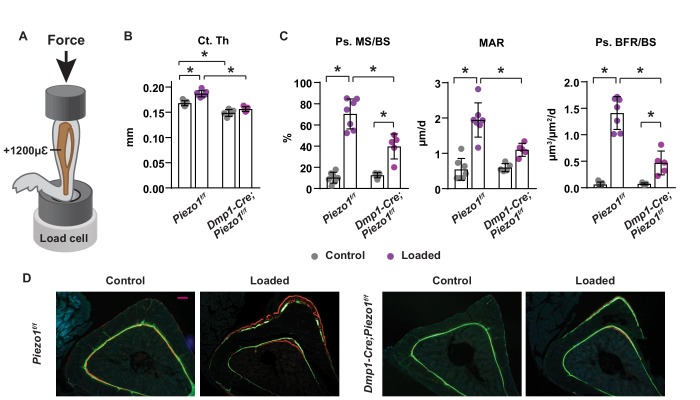
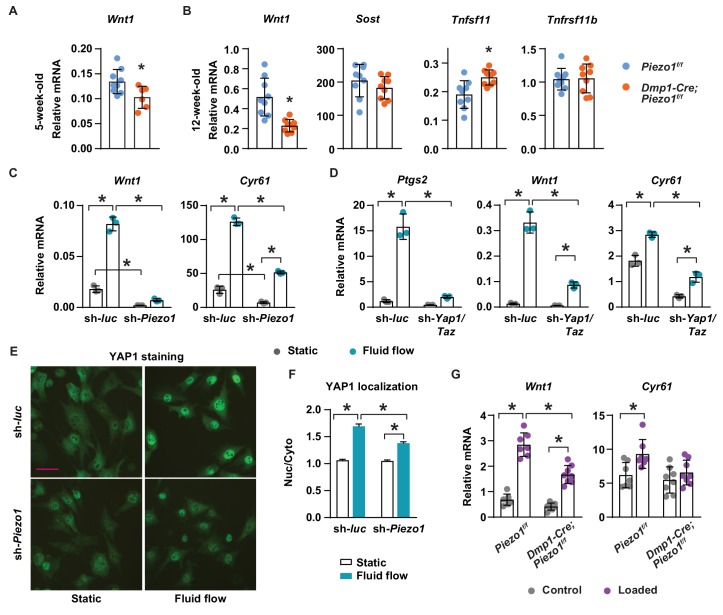
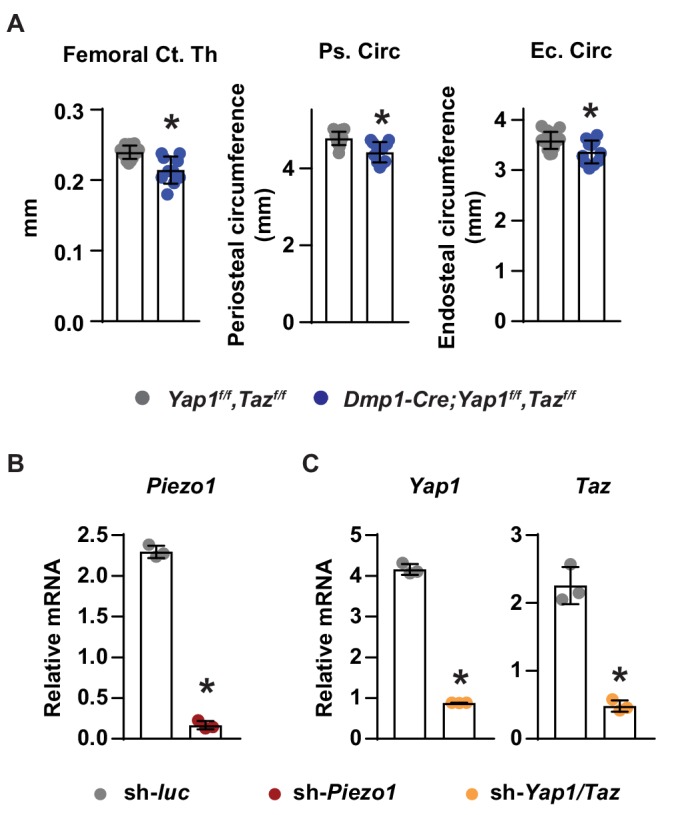
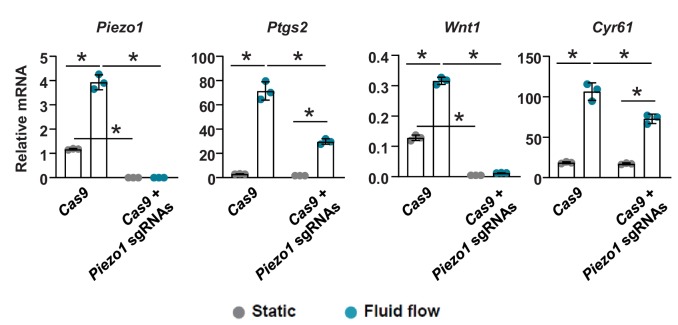
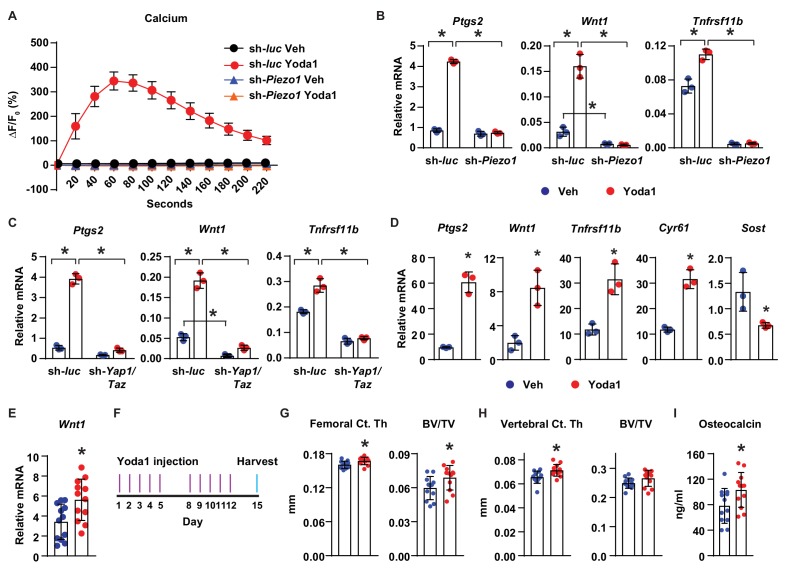
Mechanical loading, such as caused by exercise, stimulates bone formation by osteoblasts and increases bone strength, but the mechanisms are poorly understood. Osteocytes reside in bone matrix, sense changes in mechanical load, and produce signals that alter bone formation by osteoblasts. We report that the ion channel Piezo1 is required for changes in gene expression induced by fluid shear stress in cultured osteocytes and stimulation of Piezo1 by a small molecule agonist is sufficient to replicate the effects of fluid flow on osteocytes. Conditional deletion of Piezo1 in osteoblasts and osteocytes notably reduced bone mass and strength in mice. Conversely, administration of a Piezo1 agonist to adult mice increased bone mass, mimicking the effects of mechanical loading. These results demonstrate that Piezo1 is a mechanosensitive ion channel by which osteoblast lineage cells sense and respond to changes in mechanical load and identify a novel target for anabolic bone therapy.

Keywords: Piezo1; bone homeostasis; human biology; mechanosensation; medicine; mouse; osteocytes.


Conflict of interest statement

XL, LH, IN, EM, MS, MA, JX No competing interests declared

Figures

Figure 1.
Figure 1.. Piezo1 mediates mechanotransduction in an osteocyte cell line.
(A) mRNA levels of calcium channels regulated by fluid shear stress in MLO-Y4 cells determined by RNA-seq (here and throughout, values are the mean ± s.d.). (B) qPCR of Piezo1 and Piezo2 mRNA in MLO-Y4 cells cultured under static or fluid shear stress conditions for 2 hr. *p<0.05 versus static, using Student’s t-test. (C) Piezo1 and Piezo2 mRNA levels in cortical bone of 3-month-old wildtype C57BL/6J mice. (D) Intracellular calcium concentration measured in control or Piezo1 knock-down MLO-Y4 cells before and after the start of fluid flow. Arrow indicates the time when fluid flow starts. (E) qPCR of Piezo1, Ptgs2, and Tnfrsf11b in control or Piezo1 knock-down MLO-Y4 cells cultured under static or fluid shear stress conditions for 2 hr. n = 3 per group. (F) qPCR of Piezo1, Ptgs2, and Tnfrsf11b in control or Piezo1 overexpressed MLO-Y4 cells cultured under static or fluid shear stress conditions for 2 hr. n = 3 per group. *p<0.05 with the comparisons indicated by the brackets using 2-way ANOVA. Gray indicates the static condition and teal indicates fluid shear stress.
Figure 1—figure supplement 1.
Figure 1—figure supplement 1.. Sequencing analysis of mRNA isolated from MLO-Y4 cells cultured under static or fluid shear stress conditions.
(A) PCA analysis of RNAseq. (B) Volcano plot of differentially expressed transcripts in MLO-Y4 cells cultured under fluid shear stress (FF) versus static (ST) conditions.
Figure 1—figure supplement 2.
Figure 1—figure supplement 2.. Sequencing analysis of mRNA isolated from MLO-Y4 cells cultured under static or fluid shear stress conditions.
(A) GO-enrichment analysis of genes isloated from MLO-Y4 cells cultured under fluid shear stress (FF) and static (ST) conditions. (B) Calcium channels expressed in MLO-Y4 cells.
Figure 2.
Figure 2.. Loss of Piezo1 in osteoblasts and osteocytes decreases bone formation and bone mass.
(A) qPCR of loxP-flanked Piezo1 genomic DNA isolated from tibial cortical bone of Dmp1-Cre;Piezo1f/f (n = 6) and Piezo1f/f (n = 6) littermates. *p<0.05 using Student’s t-test. (B) Serial BMD of female Dmp1-Cre;Piezo1f/f mice and their littermate controls at 5, 8, and 12 weeks of age. *p<0.05 using 2-way ANOVA at a given age. (C) X-ray images of tibia from 12-week-old Dmp1-Cre;Piezo1f/f and Piezo1f/f littermate. Arrowhead indicates the location of fracture. (D, E) Representative µCT images (scale bar, 0.1 mm) (D) and cortical thickness, periosteal circumference, and endocortical circumference analysis (E) of the femoral diaphysis in Dmp1-Cre;Piezo1f/f (n = 9) and Piezo1f/f (n = 9) littermates. (F) Cortical thickness measured in the 4th lumbar vertebra of 12-week-old female Dmp1-Cre;Piezo1f/f (n = 9) and Piezo1f/f (n = 9) littermates. (G) Bone volume per tissue volume (BV/TV) measured in the femur and the L4 vertebra of 12-week-old female Dmp1-Cre;Piezo1f/f (n = 9) and Piezo1f/f (n = 7) mice. (H) Representative µCT images of the distal femur. Scale bar, 1 mm. (I) Stiffness, ultimate force, Young’s modulus, and ultimate stress measured in the femurs of Dmp1-Cre;Piezo1f/f (n = 9) and Piezo1f/f (n = 9) littermates. (J) Tissue mineral density measured in cortical bone in femoral diaphysis of Dmp1-Cre;Piezo1f/f (n = 9) and Piezo1f/f (n = 9) littermates. (K) Representative histological cross sections (left, yellow dotted line indicates periosteal surface and white dotted line indicates endocortical surface; scale bar = 100 µm) and quantification of mineralizing surface in periosteal and endocortical surface (right) at the femoral diaphysis of 5-week-old female Dmp1-Cre;Piezo1f/f (n = 7) and Piezo1f/f (n = 5) littermates. (L, M) Mineralizing surface per bone surface (MS/BS), mineral apposition rate (MAR), and bone formation rate per bone surface (BFR/BS) (L), Osteoblast number (N.Ob/B.Pm), and osteoclast number (N.Oc/B.Pm) (M) measured in cancellous bone of lumbar vertebra 1–3 from 12-week-old female Dmp1-Cre;Piezo1f/f (n = 5) and Piezo1f/f (n = 5) littermates. *p<0.05 using Student’s t-test.
Figure 2—figure supplement 1.
Figure 2—figure supplement 1.. Loss of Piezo1 in osteoblasts and osteocytes decreases bone mass.
(A) Body weight of female and male Dmp1-Cre;Piezo1f/f (n = 9 f, 8 m) and Piezo1f/f (n = 9 f, 9 m) mice at 12 weeks of age. (B) Femoral, spinal, and total body bone mineral density of male mice of indicated genotypes at 5, 8, and 12 weeks of age. (C) Femoral cortical thickness of 12-week-old male Dmp1-Cre;Piezo1f/f (n = 8) and Piezo1f/f mice (n = 9). (D) Total cross sectional area, cortical bone area, medullary area in the midshaft of femur in 12-week-old female Dmp1-Cre;Piezo1f/f (n = 5) and Piezo1f/f (n = 5) mice. (E) Femur length of 12-week-old female and male Dmp1-Cre;Piezo1f/f (n = 9 f, 8 m) and Piezo1f/f (n = 9 f, 9 m) mice. *p<0.05 using 2-way ANOVA. (F) Vertebral cortical thickness of 12-week-old male Dmp1-Cre;Piezo1f/f (n = 8) and Piezo1f/f (n = 9) mice. (G,H) Trabecular number (Tb. N), trabecular thickness (Tb. Th), and trabecular separation (Tb. Sp) measured in the femur (G) and the L4 vertebra (H) of 12-week-old female Dmp1-Cre;Piezo1f/f (n = 9) and Piezo1f/f (n = 9) mice. (I,J) Bone volume per tissue volume (BV/TV), trabecular number, trabecular thickness, and trabecular separation measured in the femur (I) and the L4 vertebra (J) of 12-week-old male Dmp1-Cre;Piezo1f/f (n = 8) and Piezo1f/f (n = 9) mice. *p<0.05 using Student’s t-test.
Figure 2—figure supplement 2.
Figure 2—figure supplement 2.. Deletion of Piezo1 in osteoblasts and osteocytes decreases cortical bone.
(A) Representative images of cross sections of femoral diaphysis from 5-week-old Dmp1-Cre;Piezo1f/f and Piezo1f/f mice. (B,C) Empty lacunae (B) and osteocyte number (C) measured in the longitudinal section of L1-3 vertebrae in 12-week-old female Dmp1-Cre;Piezo1f/f (n = 5) and Piezo1f/f (n = 5) mice. (D) Representative histological images of osteocytes in vertebral cortical and cancellous bone of 12-week-old female Dmp1-Cre;Piezo1f/f and Piezo1f/f mice. (C) Caspase three activity measured in Piezo1 knock-down MLO-Y4 and control cells. (D) Alizarin Red staining of bone marrow stromal cells isolated from 5-week-old female Dmp1-Cre;Piezo1f/f (n = 3) and Piezo1f/f (n = 3) mice and cultured for 21 days in osteoblast differentiation medium (n = 3 wells/group).
Figure 2—figure supplement 3.
Figure 2—figure supplement 3.. Deletion of Piezo1 from Dmp1-Cre-targeted cells does not affect muscle mass.
(A) Abundance of Piezo1 genomic DNA measured by qRT-PCR in gastrocnemius of Dmp1-Cre;Piezo1f/f and Piezo1f/f mice. (B) Piezo1 mRNA in tibia and gastrocnemius muscle in male wild type mice (n = 5). (C,D) Lean body weight (C) and gastrocnemius muscle mass (D) measured in 12-week-old Dmp1-Cre;Piezo1f/f (n = 9 f, 8 m) and Piezo1f/f (n = 9 f, 9 m) mice. *p<0.05 using Student’s t-test.
Figure 3.
Figure 3.. Loss of Piezo1 in osteoblasts and osteocytes blunts the skeletal response to mechanical loads.
(A) Schematic illustration of anabolic loading on mouse tibia. (B) Cortical thickness (Ct.Th) in the tibial shaft of 4-month-old loaded or control Dmp1-Cre;Piezo1f/f (n = 5) and Piezo1f/f (n = 7) littermates. (C) Mineralizing surface (MS/BS), mineral apposition rate (MAR), and bone formation rate (BFR/BS) in periosteal surface of the tibia of 4-month-old female Dmp1-Cre;Piezo1f/f (n = 5) and Piezo1f/f (n = 7) littermates. (D) Representative histological cross section images of the tibial shaft of 4-month-old female Dmp1-Cre;Piezo1f/f and Piezo1f/f littermates. Scale bar, 100 µm. *p<0.05 with the comparisons indicated by the brackets using 2-way ANOVA.
Figure 4.
Figure 4.. Piezo1 controls Wnt1 expression via YAP1 and TAZ.
(A) qPCR of Wnt1 mRNA in tibial cortical bone of 5-week-old female Piezo1f/f (n = 6) and Dmp1-Cre;Piezo1f/f mice (n = 6). *p<0.05 using Student’s t-test. (B) Relative mRNA levels of Wnt1, Sost, Tnfsf11 (RANKL), and Tnfrsf11b (OPG) in tibia cortical bone of 12-week-old female Piezo1f/f (n = 9) and Dmp1-Cre;Piezo1f/f (n = 9) mice. *p<0.05 using Student’s t-test. (C) Wnt1 and Cyr61 mRNA levels in control or Piezo1 knock-down MLO-Y4 cells cultured under static or fluid shear stress conditions. *p<0.05 with the comparisons indicated by the brackets using 2-way ANOVA. (D) Ptgs2, Wnt1, and Cyr61 mRNA levels in control or Yap1/Taz knock-down MLO-Y4 cells cultured under static or fluid shear stress conditions. *p<0.05 with the comparisons indicated by the brackets using 2-way ANOVA. (E) YAP1 immunofluorescence in control or Piezo1 knock-down MLO-Y4 cells cultured under static or fluid shear stress conditions. Scale bar, 100 µm. (F) Quantification of mean fluorescence intensity in nucleus versus cytoplasm in the cells described in (E). (G) Wnt1 and Cyr61 mRNA levels measured in tibia of female Dmp1-Cre;Piezo1f/f (n = 8) and Piezo1f/f (n = 7) mice loaded with one bout of compressive loading. Mice were harvested 5 hr after loading. *p<0.05 with the comparisons indicated by the brackets using 2-way ANOVA.
Figure 4—figure supplement 1.
Figure 4—figure supplement 1.. Loss of YAP1 and TAZ in osteoblasts and osteocytes decreases cortical bone.
(A) Cortical thickness (left), periosteal circumference (middle), and endocortical circumference (right) at the femoral diaphysis of Dmp1-Cre;Yap1f/f,Tazf/f (n = 10) and Yap1f/f,Tazf/f (n = 12) littermates. (B) mRNA of Piezo1 in control and Piezo1 knock-down MLO-Y4 cells. (C) mRNA levels of Yap1 and Taz in control and Yap1/Taz knock-down MLO-Y4 cells. *p<0.05 using Student’s t-test.
Figure 4—figure supplement 2.
Figure 4—figure supplement 2.. Deletion of Piezo1 in osteoblastic cells blunts their response to fluid flow.
qRT-PCR of Piezo1, Ptgs2, Wnt1, and Cyr61 in control (Cas9) and Piezo1 knockout (Cas9 + Piezo1 sgRNAs) UAMS-32 cells cultured under static and fluid flow conditions. *p<0.05 using 2-way ANOVA. Osteoblastic UAMS-32 cells were transfected with Cas9 or Cas9 with two sgRNAs targeting introns 3 and 4 of the Piezo1 gene. Single Cells were then flow-sorted into 96-well plates for screening. Cells with homologous deletion of the exon 4 of Piezo1 were pooled together for analysis.
Figure 5.
Figure 5.. Activation of Piezo1 mimics the effects of mechanical stimulation on osteocytes.
(A) Intracellular calcium concentration measured in control or Piezo1 knock-down MLO-Y4 cells immediately after the treatment of DMSO or 10 µM Yoda1. (B) qPCR of Ptgs2, Wnt1, and Tnfrsf11b in control or Piezo1 knock-down MLO-Y4 cells treated with DMSO or 10 µM Yoda1 for 2 hr. n = 3 per group. *p<0.05 versus vehicle treated controls of the same genotype by 2-way ANOVA. (C) qPCR of Ptgs2, Wnt1, and Tnfrsf11b in control or Yap1/Taz knock-down MLO-Y4 cells treated with DMSO or 10 µM Yoda1 for 2 hr. n = 3 per group. *p<0.05 versus vehicle treated controls of the same genotype by 2-way ANOVA. (D) qPCR of Ptgs2, Wnt1, Tnfrsf11b, Cyr61, and Sost in ex vivo cultured femoral cortical bone from 5-week-old mice treated with DMSO or 10 µM Yoda1 for 4 hr. n = 3 per group. (E) qPCR of Wnt1 in tibia of C57BL/6J mice treated with Veh or Yoda1 for 4 hr. n = 12 per group. (F) Schedule of in vivo Yoda1 administration. (G, H) Cortical thickness and cancellous BV/TV in distal femur (G) and the 4th lumbar (H) of 4-month-old vehicle or Yoda1 treated female C57BL/6J mice (n = 12 per group). (I) Circulating osteocalcin levels in the serum of 4-month-old vehicle or Yoda1 treated female C57BL/6J mice (n = 12 per group). *p<0.05 versus vehicle treated controls by Student’s t-test.
Figure 5—figure supplement 1.
Figure 5—figure supplement 1.. Yoda1 does not affect body weight and serum bone resorption marker.
(A) Body weight of C57BL/6J mice before and after 2 weeks of vehicle or Yoda1 administration (n = 12 mice per group). (B) Serum CTX measured by ELISA in mice as described in (A).
Author response image 1.
Author response image 1.. Gene expression analysis of Piezo1-deficient cells.
(A) RT-qPCR analysis of Sost, Dkk1, Wnt1, Wnt7b, Bmp2, and Tgfb1 in tibia cortical bone of12-week-old female Piezo1f/f (n = 9) and Dmp1-Cre;Piezo1f/f (n = 9) mice. *p < 0.05 using Student’s t-test. (B) Wnt1, Dkk1, and Tgfb1 mRNA levels in control or Piezo1 knock-down MLO-Y4 cells cultured under static or fluid shear stress conditions. *p < 0.05 with the comparisons indicated by the brackets using 2-way ANOVA.

Comment in

  • Sensing the load.
    Haelterman N, Lim J. Haelterman N, et al. Elife. 2019 Oct 7;8:e50210. doi: 10.7554/eLife.50210. Elife. 2019. PMID: 31588900 Free PMC article.

References

    1. Abed E, Labelle D, Martineau C, Loghin A, Moreau R. Expression of transient receptor potential (TRP) channels in human and murine osteoblast-like cells. Molecular Membrane Biology. 2009;26:146–158. doi: 10.1080/09687680802612721. - DOI - PubMed
    1. Bivi N, Condon KW, Allen MR, Farlow N, Passeri G, Brun LR, Rhee Y, Bellido T, Plotkin LI. Cell autonomous requirement of connexin 43 for osteocyte survival: consequences for endocortical resorption and periosteal bone formation. Journal of Bone and Mineral Research. 2012;27:374–389. doi: 10.1002/jbmr.548. - DOI - PMC - PubMed
    1. Bonewald LF. The amazing osteocyte. Journal of Bone and Mineral Research. 2011;26:229–238. doi: 10.1002/jbmr.320. - DOI - PMC - PubMed
    1. Cahalan SM, Lukacs V, Ranade SS, Chien S, Bandell M, Patapoutian A. Piezo1 links mechanical forces to red blood cell volume. eLife. 2015;4:e07370. doi: 10.7554/eLife.07370. - DOI - PMC - PubMed
    1. Choi D, Park E, Jung E, Cha B, Lee S, Yu J, Kim PM, Lee S, Hong YJ, Koh CJ, Cho CW, Wu Y, Li Jeon N, Wong AK, Shin L, Kumar SR, Bermejo-Moreno I, Srinivasan RS, Cho IT, Hong YK. Piezo1 incorporates mechanical force signals into the genetic program that governs lymphatic valve development and maintenance. JCI Insight. 2019;4:125068. doi: 10.1172/jci.insight.125068. - DOI - PMC - PubMed

Publication types