. 2019 Nov 1;129(11):4797-4816.
doi: 10.1172/JCI122313.

Proximal tubule ATR regulates DNA repair to prevent maladaptive renal injury responses

Affiliations

Proximal tubule ATR regulates DNA repair to prevent maladaptive renal injury responses

Seiji Kishi et al. J Clin Invest. .

Abstract

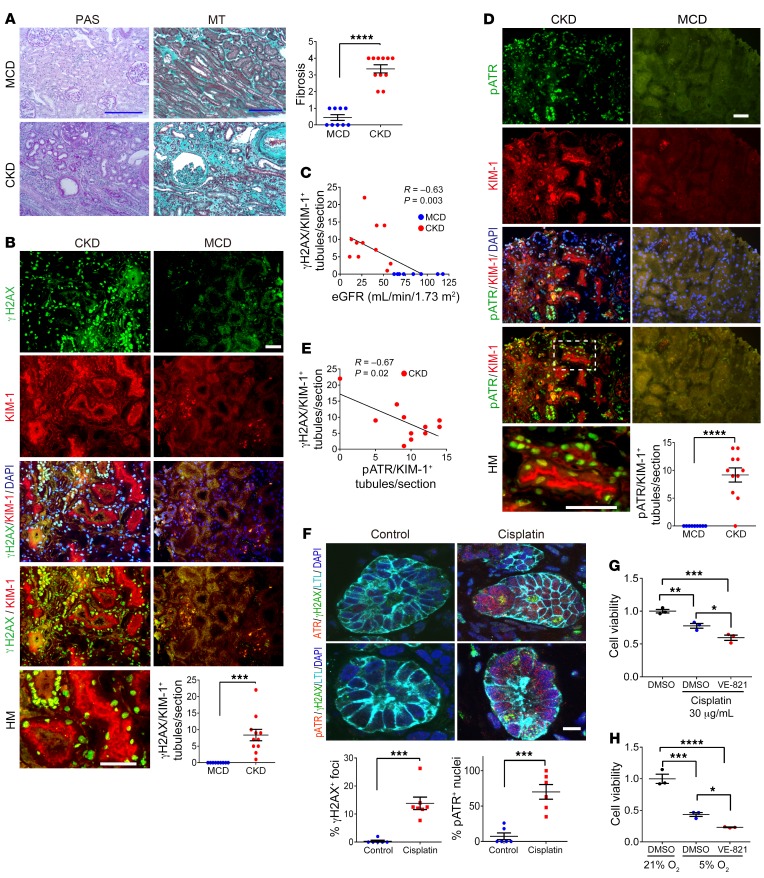
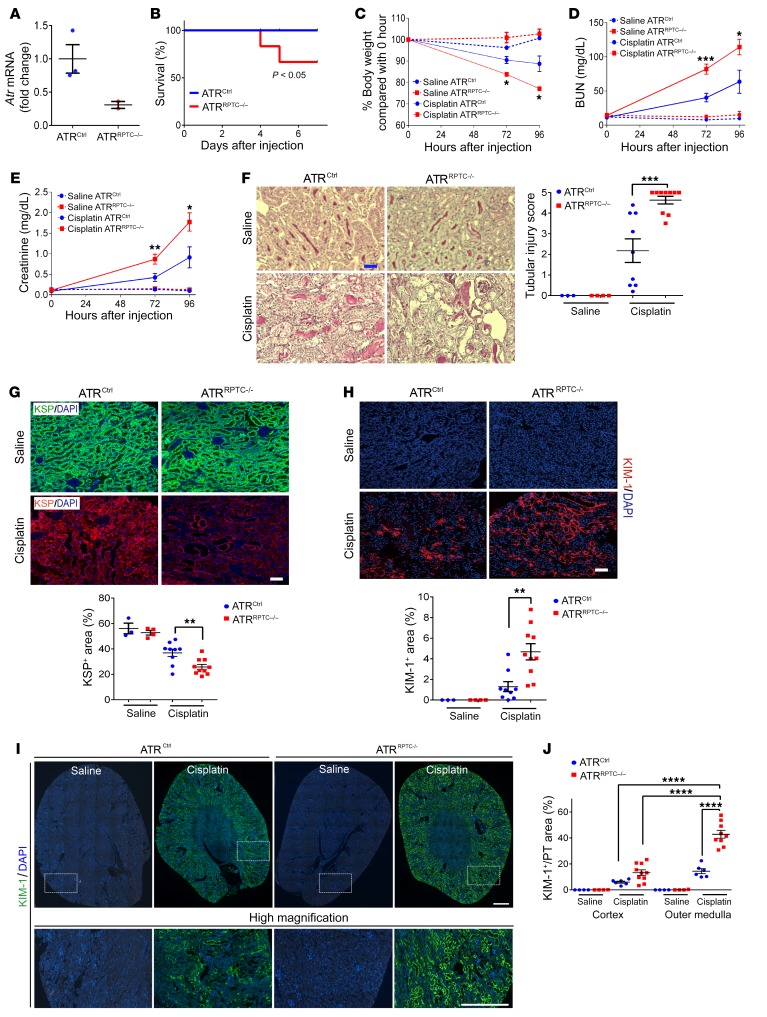
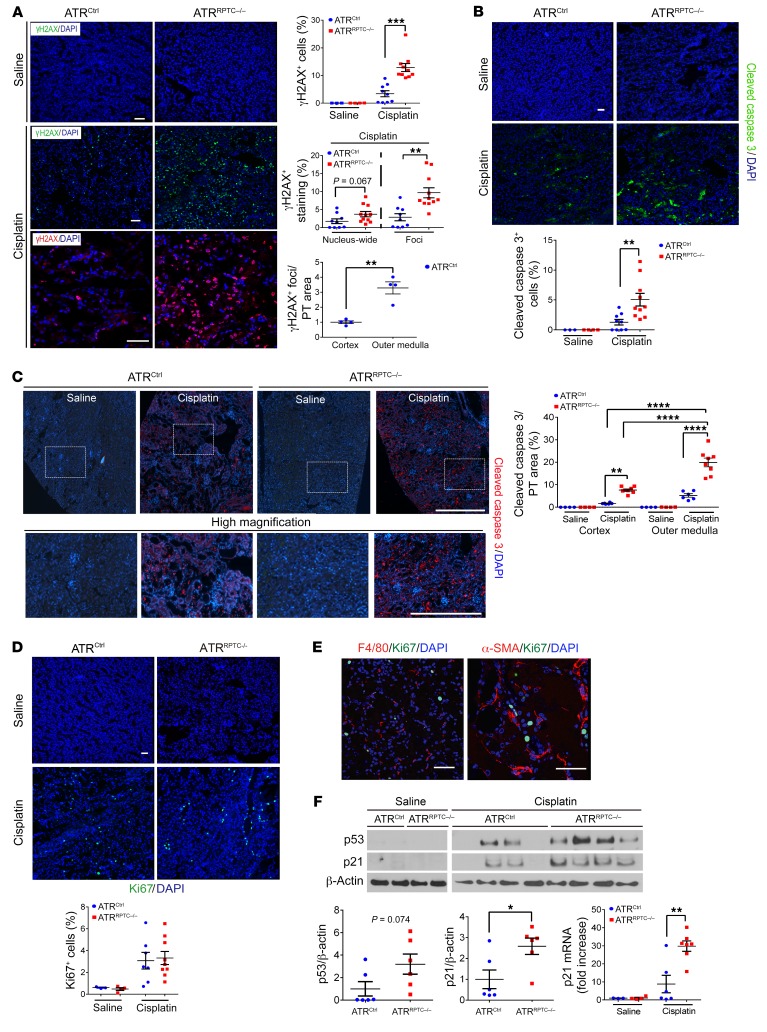
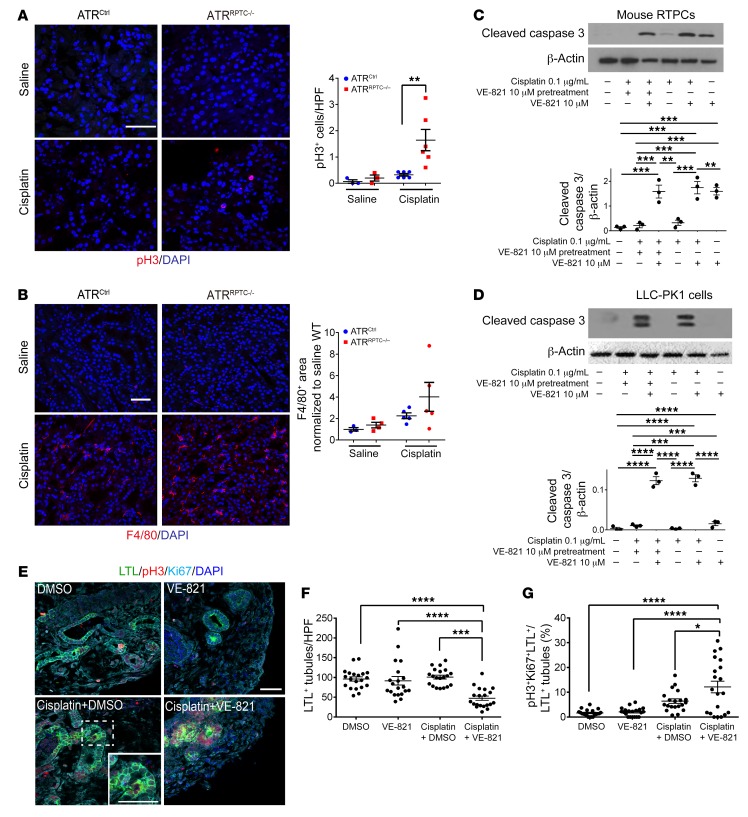
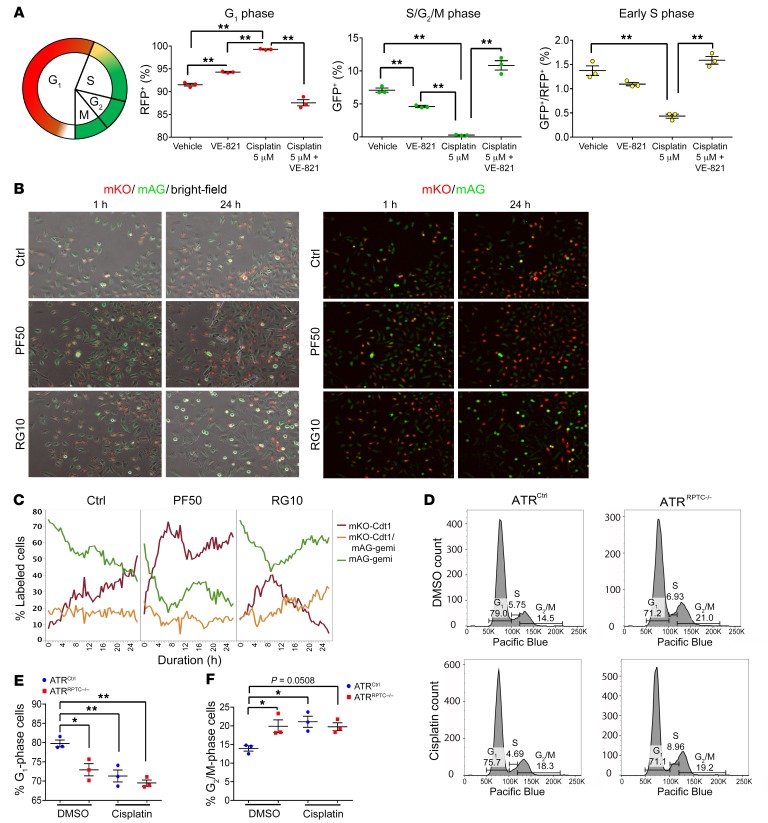
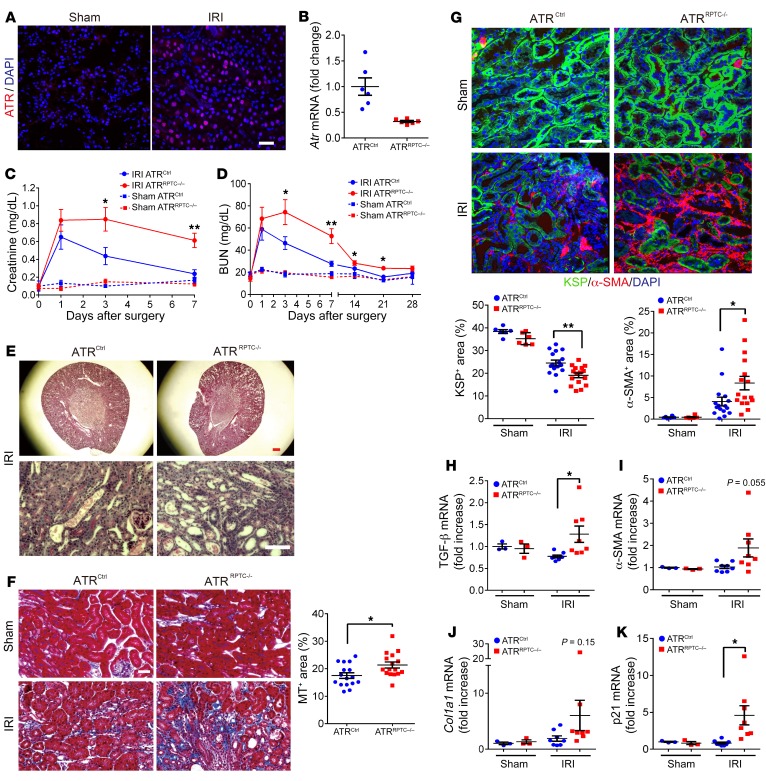
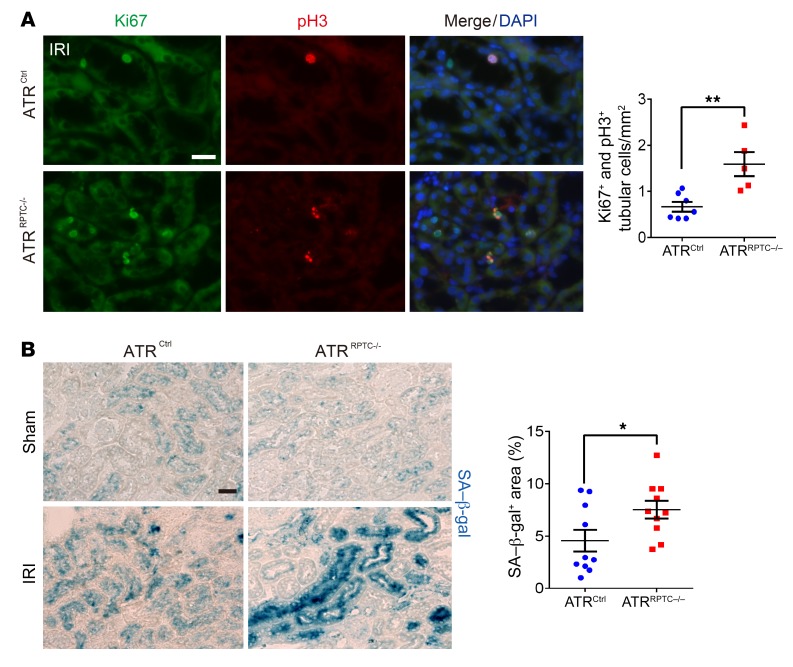
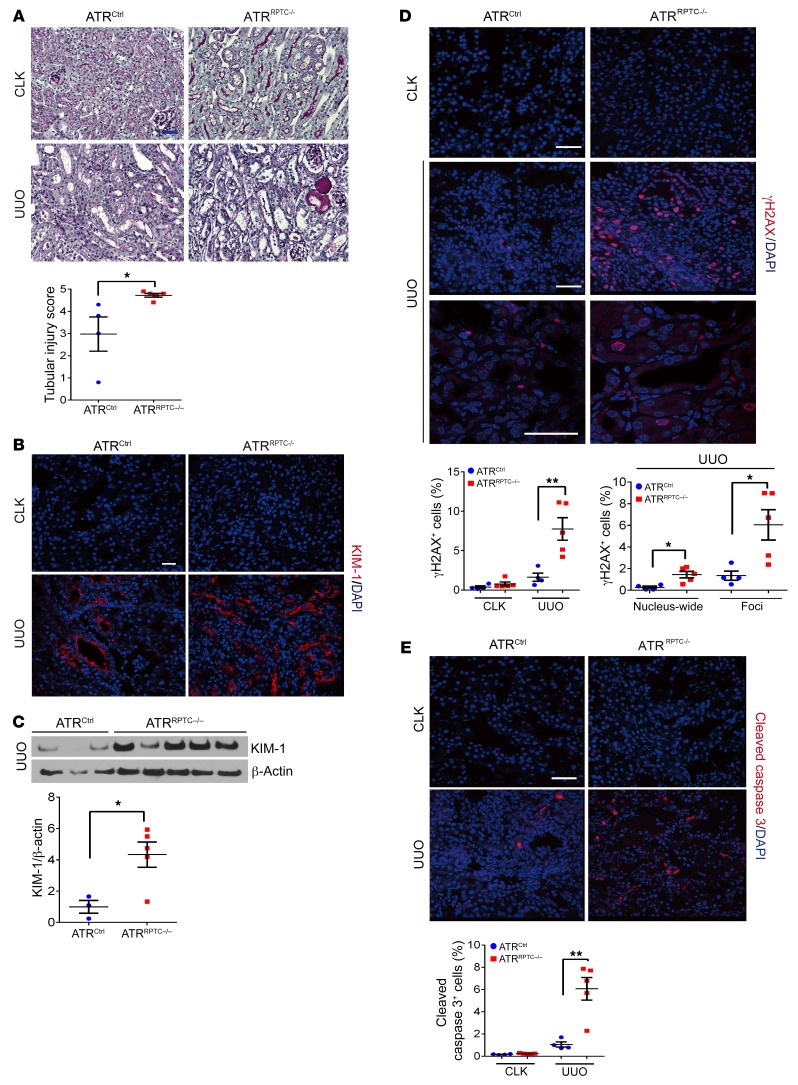
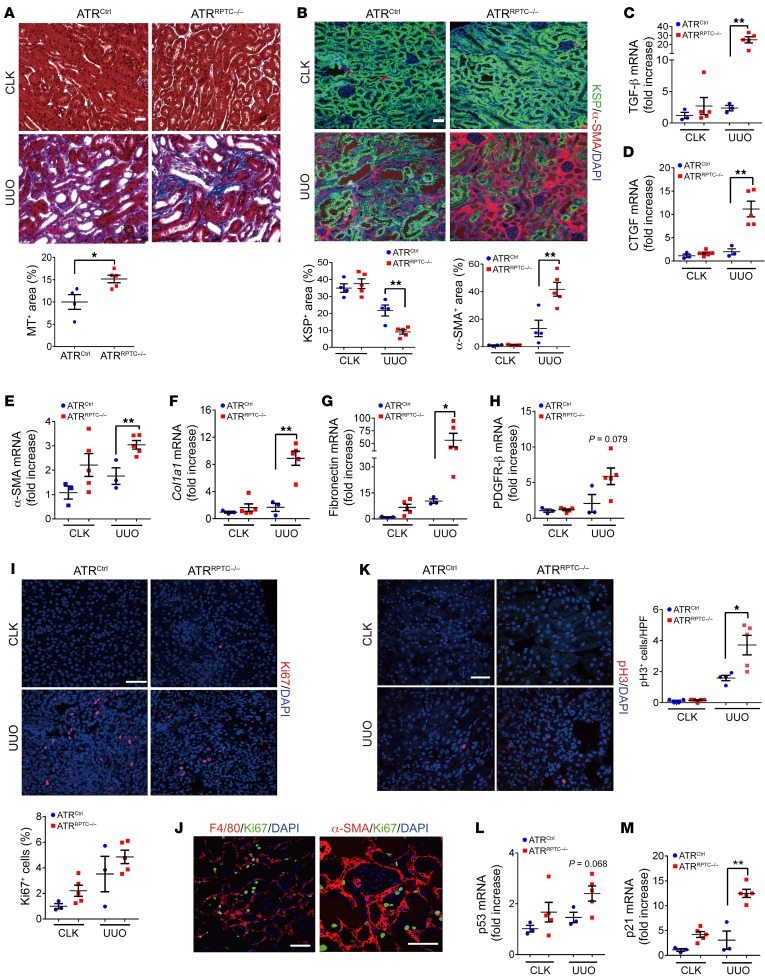
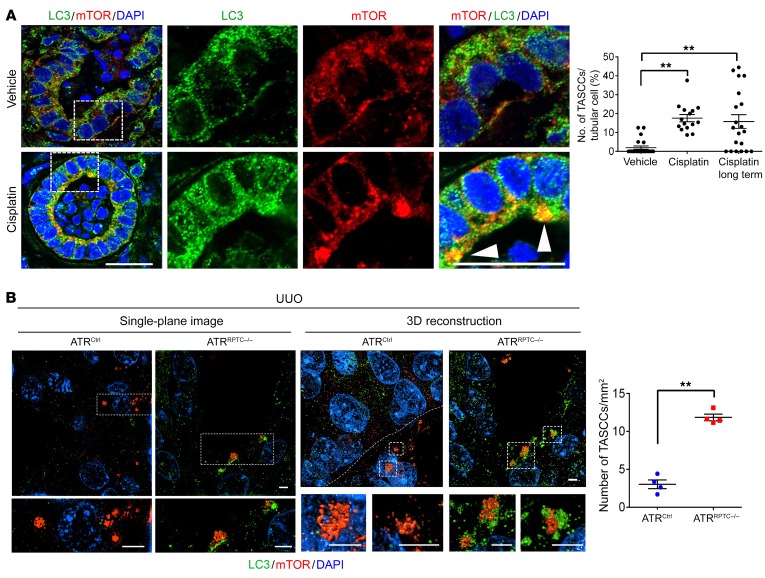
Maladaptive proximal tubule (PT) repair has been implicated in kidney fibrosis through induction of cell-cycle arrest at G2/M. We explored the relative importance of the PT DNA damage response (DDR) in kidney fibrosis by genetically inactivating ataxia telangiectasia and Rad3-related (ATR), which is a sensor and upstream initiator of the DDR. In human chronic kidney disease, ATR expression inversely correlates with DNA damage. ATR was upregulated in approximately 70% of Lotus tetragonolobus lectin-positive (LTL+) PT cells in cisplatin-exposed human kidney organoids. Inhibition of ATR resulted in greater PT cell injury in organoids and cultured PT cells. PT-specific Atr-knockout (ATRRPTC-/-) mice exhibited greater kidney function impairment, DNA damage, and fibrosis than did WT mice in response to kidney injury induced by either cisplatin, bilateral ischemia-reperfusion, or unilateral ureteral obstruction. ATRRPTC-/- mice had more cells in the G2/M phase after injury than did WT mice after similar treatments. In conclusion, PT ATR activation is a key component of the DDR, which confers a protective effect mitigating the maladaptive repair and consequent fibrosis that follow kidney injury.

Keywords: Cell cycle; Chronic kidney disease; Fibrosis; Nephrology.


Conflict of interest statement

Conflict of interest: JVB and TI are co-inventors on KIM-1 patents (Molecules and methods for inhibiting shedding of KIM-1, patent no. 7696321; Kidney injury–related molecules, patent no. 6664385), which have been assigned to Partners Healthcare and licensed to several companies. JVB and RM are co-inventors on patents (PCT/US16/52350) on organoid technologies that are assigned to Partners Healthcare. JVB is a consultant to Aldeyra, Angion, Goldilocks, and Medimmune. He is also a consultant to and holds equity in MediBeacon, Sentien Biotech, Thrasos Therapeutics, and Goldfinch Bio and has received grant support from Boehringer Ingelheim.

Figures

Figure 1
Figure 1. ATR and DNA activation in human kidneys and organoids.
(A) Representative images of periodic acid–Schiff (PAS) and MT staining of human kidney tissue and the corresponding quantitation of MT+ areas. Scale bars: 10 μm. (B) Representative images of γH2AX- and KIM-1–stained sections of human kidneys and the corresponding quantitation of γH2AX+/KIM-1+ tubules. Scale bars: 10 μm. (C) Correlation between the number of γH2AX+/KIM-1+ tubules and eGFR. (D) Representative images of pATR- and KIM-1–stained sections of human kidney and the corresponding quantitation of pATR/KIM-1+ tubules. Scale bar: 10 μm. (E) Relationship between γH2AX and pATR expression in KIM-1+ chronically injured RPTECs. (F) Representative images of H9 cell–derived day-49 organoids treated with either cisplatin (5 μM) or vehicle (RPMI) for 24 hours. Sections of the organoids were stained for ATR, pATR, γH2AX, and LTL. Scale bar: 20 μm. Dot plots show quantitation of pATR+ nuclei (n = 6, control; n = 6, cisplatin) and γH2AX+ nuclei in the organoids (n = 6, control; n = 7, cisplatin). (G) Viability of HKC-8 cells assessed 24 hours after cisplatin treatment, with or without 10 μM VE-821 pretreatment. Viability was determined using the MTT assay. Data are expressed as a percentage of the control MTT value (n = 3). (H) Viability of HKC-8 cells was assessed by MTT assay immediately following culturing under 21% or 5% O2 for 24 hours, with or without 10 μM VE-821 pretreatment. n = 9, MCD; n = 11, CKD (AE). Data are presented as the mean ± SEM. A 2-tailed, unpaired t test (A, B, D, and F), 1-way ANOVA with Tukey’s post hoc test (G and H), and Pearson’s correlation analysis (C and E) were used to determine statistical significance. *P < 0.05, **P < 0.01, ***P < 0.001, and ****P < 0.0001. HM, high-magnification.
Figure 2
Figure 2. PT Atr gene deletion exacerbates cisplatin-induced AKI.
(A) Real-time PCR analysis of Atr mRNA levels in ATRCtrl and ATRRPTC–/– kidneys 96 hours after cisplatin administration. ATRCtrl (n = 3); ATRRPTC–/– (n = 2). (B) Survival after cisplatin injection was monitored until day 7. ATRCtrl (n = 18), ATRRPTC–/– (n = 18). (C) Body weight (vs. 0 hour), (D) BUN, and (E) serum creatinine levels over time, 72 and 96 hours after saline or cisplatin administration. Saline (72 h): ATRCtrl (n = 3), ATRRPTC–/– (n = 4); cisplatin (72 h): ATRCtrl (n = 18), ATRRPTC–/– (n = 18). Saline (96 h): ATRCtrl (n = 3), ATRRPTC–/– (n = 4); cisplatin (96 h): ATRCtrl (n = 9), ATRRPTC–/– (n = 10). (F) Representative kidney histology as shown by PAS staining 96 hours after saline or cisplatin injection. Scale bar: 50 μm. Dot plot shows the corresponding quantification of tubular injury score. Saline: ATRCtrl (n = 3), ATRRPTC–/– (n = 4); cisplatin: ATRCtrl (n = 9), ATRRPTC–/– (n = 10). (G) Representative images of KSP-stained sections of injured kidneys from ATRCtrl and ATRRPTC–/– mice 96 hours after cisplatin injection. Scale bar: 50 μm. Dot plot shows the corresponding quantification of KSP+ areas. Saline: ATRCtrl (n = 3), ATRRPTC–/– (n = 4); cisplatin: ATRCtrl (n = 9), ATRRPTC–/– (n = 10). (H) Representative images of KIM-1–stained sections of injured kidneys from ATRCtrl and ATRRPTC–/– mice 96 hours after cisplatin injection. Scale bar: 50 μm. Dot plots shows the corresponding quantification of KIM-1+ areas. Saline: ATRCtrl (n = 3), ATRRPTC–/– (n = 4); cisplatin: ATRCtrl (n = 9), ATRRPTC–/– (n = 10). (I) Coimmunostaining for KIM-1 and DAPI in kidneys from ATRCtrl and ATRRPTC–/– mice 96 hours after saline or cisplatin injection. Top panels: Stitched images of whole kidney cross-sectional area (original magnification, ×200). Bottom panels: Higher-magnification images from the boxed regions in the stitched images. Scale bars: 500 μm. (J) Quantification of KIM-1 staining in cortex or outer medulla from whole kidney section images in I, normalized to control LTL staining. Saline: ATRCtrl (n = 4), ATRRPTC–/– (n = 4); cisplatin: ATRCtrl (n = 6), ATRRPTC–/– (n = 10). Data are presented as the mean ± SEM. Kaplan-Meier method with comparison using the log-rank test (B), a 2-tailed, unpaired t test (CH, cisplatin ATRCtrl vs. cisplatin ATRRPTC–/–), and 1-way ANOVA followed by Tukey’s post hoc test (J) were used to determine statistical significance. *P < 0.05, **P < 0.01, and ***P < 0.001, ****P < 0.0001.
Figure 3
Figure 3. ATRRPTC–/– mice have enhanced DNA damage and apoptosis after cisplatin injection.
(A) Representative images of γH2AX-stained kidney sections from ATRCtrl and ATRRPTC–/– mice 96 hours after saline or cisplatin injection. Scale bars: 50 μm. Dot plots show quantification of γH2AX+ cells, percentage of cells with nucleus-wide γH2AX+ staining or γH2AX+ foci, and γH2AX+ cells in cortex versus outer medulla. Saline: ATRCtrl (n = 3), ATRRPTC–/– (n = 4); cisplatin: ATRCtrl (n = 9), ATRRPTC–/– (n = 11). (B) Representative images of cleaved caspase 3–stained kidney sections from ATRCtrl and ATRRPTC–/– mice 96 hours after saline or cisplatin injection. Scale bar: 50 μm. Dot plot shows corresponding quantification of cleaved caspase 3+ cells. Saline: ATRCtrl (n = 3), ATRRPTC–/– (n = 4); cisplatin: ATRCtrl (n = 9), ATRRPTC–/– (n = 11). (C) Immunostaining for cleaved caspase 3 and DAPI in kidneys from ATRCtrl and ATRRPTC–/– mice 96 hours after saline or cisplatin injection. Upper panels: Stitched images represent approximately 25% of the kidney cross-sectional area (original magnification, ×200). Lower panels: Higher-magnification images from the boxed regions in the stitched (upper) images (scale bar: 500 μm). Dot plot shows quantification of cleaved caspase 3 staining from the whole kidney section images in C relative to the LTL+ area of uninjured kidney tissue. Saline: ATRCtrl (n = 4), ATRRPTC–/– (n = 4); cisplatin: ATRCtrl (n = 6), ATRRPTC–/– (n = 8). (D) Representative images of Ki67-stained kidney sections from ATRCtrl and ATRRPTC–/– mice 96 hours after saline or cisplatin injection. Scale bar: 50 μm. Dot plot shows corresponding quantification of Ki67+ cells. Saline: ATRCtrl (n = 3), ATRRPTC–/– (n = 4); cisplatin: ATRCtrl (n = 7), ATRRPTC–/– (n = 9). (E) Representative images of F4/80- and Ki67-stained and α-SMA– and Ki67-stained sections of injured kidneys from ATRRPTC–/– mice 96 hours after cisplatin injection. Scale bar: 50 μm. (F) Representative Western blot. Each lane represents 1 sample from an individual mouse. Dot plots show quantification of Western blot band intensity for p53 and p21, 96 hours after cisplatin injection. ATRCtrl (n = 6), ATRRPTC–/– (n = 6). Also shown is a dot plot of quantitative RT-PCR analysis of p21 mRNA levels in ATRCtrl and ATRRPTC–/– kidneys. Saline: ATRCtrl (n = 3), ATRRPTC–/– (n = 4); cisplatin: ATRCtrl (n = 6), ATRRPTC–/– (n = 7). Data are presented as the mean ± SEM. Statistical significance was determined by 2-tailed, unpaired t test (A, B, D, and F, for cisplatin ATRCtrl vs. cisplatin ATRRPTC–/–) and 1-way ANOVA followed by Tukey’s post-hoc test (C). *P < 0.05, **P < 0.01, ***P <0.001, and ****P < 0.0001. See the complete unedited blots in the supplemental material.
Figure 4
Figure 4. Atr gene deletion in RPTCs leads to increased cleaved caspase 3 and G2/M-phase cells after cisplatin injection.
(A) Representative images of pH3-stained kidney sections from ATRCtrl and ATRRPTC–/– mice 96 hours after saline or cisplatin injection and the corresponding quantification of pH3+ nuclei. Scale bar: 50 μm. Saline: ATRCtrl (n = 3), ATRRPTC–/– (n = 4); cisplatin: ATRCtrl (n = 6), ATRRPTC–/– (n = 6). (B) Representative images of F4/80-stained kidney sections from ATRCtrl and ATRRPTC–/– mice 96 hours after saline or cisplatin injection. Scale bar: 50 μm. Dot plot shows corresponding quantification of F4/80+ area. Saline: ATRCtrl (n = 3), ATRRPTC–/– (n = 4); cisplatin: ATRCtrl (n = 5), ATRRPTC–/– (n = 5). Representative Western blots of cleaved caspase 3 expression in mouse RPTCs (C) and LLC-PK1 cells (D) treated with cisplatin, VE-821, or a combination of both. n = 3 independent experiments. (E) Representative images of H9 cell–derived day-64 organoids treated with either cisplatin (5 μM) or vehicle (DMSO) for 24 hours, with or without 10 μM VE-821 pretreatment. Sections of the organoids were stained for LTL, pH3, Ki67, and DAPI. Scale bar: 50 μm; inset shows a high-power magnification of a triple-positive tubule. (F) Quantitation of LTL+ tubules and (G) percentage of pH3+, Ki67+, and LTL+ cells to LTL+ cells (n = 2 ×10 high-power fields [HPF] in each treatment group). Data are presented as the mean ± SEM. Statistical significance was determined by 2-tailed, unpaired t test (A and B, cisplatin ATRCtrl vs. cisplatin ATRRPTC–/–) and 1-way ANOVA followed by Tukey’s post-hoc test (C, D, F, and G) *P < 0.05, **P < 0.01, ***P < 0.001, and ****P < 0.0001.
Figure 5
Figure 5. Atr deletion promotes G2/M arrest in cisplatin injured RPTECs.
(A) Schematic diagram showing the timing of the FUCCI2a fluorescence reporters. Red indicates mCherry; green indicates mVenus. Dot plots show the cell-cycle profile and proportion of FUCCI RPTECs in G1, early S, and S/G2/M phases, as analyzed by flow cytometry. Primary RPTECs from FUCCI2a-gGT-Cre mice were synchronized in 1% FBS PTC media and then treated with cisplatin, with or without VE-821, or were left untreated for 48 hours. Cells were then fixed and analyzed by flow cytometry. Red and green colors in the graph indicate G1 and S/G2/M phases, respectively, and double-positive cells were considered to be in the early S phase. RFP, red fluorescent protein; GFP, green fluorescent protein. (B and C) Cell-cycle assessment by live microscopy of HK2 cells expressing the FUCCI system in control conditions (Ctrl, n = 4), or incubated with 50 nM pifithrin-α (PF50, n = 2) or 10 nM rigosertib (RG10, n = 2). (B) Representative images of the cells at 1 hour and 24 hours after incubation are shown. Images on the left show overlays of bright-field, monomeric Kusabira-Orange (mKO), and monomeric Azami-Green (mAG) channels. Images on the right show mKO and mAG channels (original magnification, ×10). (C) Graph shows the quantification over time of the cells in G1 (mKO-Cdt1, red), G2 (mAG-geminin, green), and S (mKO-Cdt1+ mAG-geminin, orange) phases of the cell cycle. (D) Cell-cycle analysis by propidium iodide staining and flow cytometry of mouse primary cells at baseline (top 2 graphs) and after treatment with cisplatin at 0.2 μg/mL for 48 hours (bottom 2 graphs). (E and F) Results of the cell-cycle analysis for 3 independent experiments. Data are presented as the mean ± SEM. Statistical significance was determined by 1-way ANOVA followed by Tukey’s post hoc test. *P < 0.05 and **P < 0.01.
Figure 6
Figure 6. Atr gene depletion in RPTECs results in increased profibrotic changes after IRI.
(A) Representative images of ATR-stained sections of kidneys 48 hours after IRI or sham operation. Scale bar: 50 μm. (B) Real-time PCR analysis of Atr mRNA levels in ATRCtrl and ATRRPTC–/– kidneys on day 28 after IRI. ATRCtrl (n = 6), ATRRPTC–/– (n = 6). (C and D) Changes in serum creatinine and BUN following IRI. Sham operation: ATRCtrl (n = 3), ATRRPTC–/– (n = 3); IRI: ATRCtrl (n = 8), ATRRPTC–/– (n = 8). (E) Representative images of PAS-stained kidneys from ATRCtrl and ATRRPTC–/– mice on day 7 after IRI. Scale bars: 300 μm (top) and 50 μm (bottom). (F) Representative images of MT-stained kidneys from ATRCtrl and ATRRPTC–/– mice on day 28 after IRI or sham operation. Dot plot shows the quantification of the MT+ area. Scale bar: 100 μm. (G) Representative images of KSP- and α-SMA–stained kidney sections from ATRCtrl and ATRRPTC–/– mice 28 days after IRI or sham operation. Dot plots show the quantification of KSP+ and α-SMA+ areas. Scale bar: 50 μm. (F and G) Sham: ATRCtrl (n = 3 mice, 6 kidneys), ATRRPTC–/– (n = 3 mice, 6 kidneys); IRI: ATRCtrl (n = 8 mice, 16 kidneys), ATRRPTC–/– (n = 8 mice, 16 kidneys). (HK) RT-PCR analysis of TGF-β, α-SMA, Col1a1, and p21 mRNA levels in ATRCtrl and ATRRPTC–/– kidneys on day 28 following IRI. Sham operation: ATRCtrl (n = 3), ATRRPTC–/– (n = 3); IRI: ATRCtrl (n = 8), ATRRPTC–/– (n = 8). Data are presented as the mean ± SEM. Statistical significance was determined by 2-tailed, unpaired t test (IRI ATRCtrl vs. IRI ATRRPTC–/–). *P < 0.05 and **P < 0.01.
Figure 7
Figure 7. Atr gene depletion in RPTECs results in G2/M arrest and cellular senescence after IRI.
(A) Representative images of coimmunostaining with antibodies against Ki67 and pH3 in cells from ATRCtrl and ATRRPTC–/– mice on day 28 following IRI and the corresponding quantification of Ki67+ and pH3+ nuclei. ATRCtrl (n = 7), ATRRPTC–/– (n = 5). Scale bar: 50 μm. (B) Representative images of SA–β-gal–stained kidney sections from ATRCtrl and ATRRPTC–/– mice 28 days after IRI or sham operation. Scale bar: 50 μm. Dot plots shows the quantification of SA–β-gal+ areas. IRI: ATRCtrl and ATRRPTC–/– mice (n = 5 mice and 10 kidneys). Data are presented as the mean ± SEM. Statistical significance was determined by 2-tailed, unpaired t test (IRI ATRCtrl vs. IRI ATRRPTC–/–). *P < 0.05 and **P < 0.01.
Figure 8
Figure 8. Deletion of RPTEC Atr results in more severe kidney injury and increased DNA damage and cleaved caspase 3 after UUO.
(A) Representative kidney histological images of PAS-stained kidney sections 7 days after UUO. Scale bar: 50 μm. Dot plot shows quantified tubular injury score. ATRCtrl (n = 4), ATRRPTC–/– (n = 5). (B) Representative images of KIM-1–stained kidneys from ATRCtrl and ATRRPTC–/– mice 7 days after UUO. Scale bar: 50 μm. (C) Western blotting was performed on UUO-injured kidney lysates to determine KIM-1 expression. Each lane represents 1 sample from an individual mouse. Dot plot shows the corresponding quantification of band intensity. ATRCtrl (n = 3), ATRRPTC–/– (n = 5). (D) Representative images of γH2AX-stained sections of CLKs and injured kidneys from ATRCtrl and ATRRPTC–/– mice 7 days after UUO. Dot plots show the corresponding quantification of γH2AX+ cells and of nucleus-wide γH2AX+ and γH2AX+ foci. ATRCtrl (n = 4), ATRRPTC–/– (n = 5). Scale bars: 50 μm. (E) Representative images of cleaved caspase 3–stained sections of CLKs and injured kidneys from ATRCtrl and ATRRPTC–/– mice 7 days after UUO. Scale bar: 50 μm. Dot plot shows the corresponding quantification of cleaved caspase 3+ cells. ATRCtrl (n = 4), ATRRPTC–/– (n = 5). Data are presented as the mean ± SEM. Statistical significance was determined by 2-tailed, unpaired t test (UUO ATRCtrl vs. ATRRPTC–/–). *P < 0.05 and **P < 0.01. The complete unedited blots are provided in the supplemental material.
Figure 9
Figure 9. The increase in fibrosis and G2/M phase cell cycle is greater in ATRRPTC–/– mouse kidneys after UUO.
(A) Representative kidney histological images of MT-stained sections 7 days after UUO and corresponding quantification of MT+ areas. ATRCtrl (n = 4), ATRRPTC–/– (n = 5). Scale bar: 50 μm. (B) Representative images of KSP- and α-SMA–stained sections of CLKs and injured kidneys from ATRCtrl and ATRRPTC–/– mice on day 7. Scale bar: 50 μm. Dot plots show quantification of KSP+ and α-SMA+ areas. ATRCtrl (n = 4), ATRRPTC–/– (n = 5). (CH) Quantitative RT-PCR analysis of TGF-β, CTGF, α-SMA, Col1a1, fibronectin, PDGFR-β, p53, and p21 mRNA levels in kidneys from ATRCtrl and ATRRPTC–/– mice on day 7. ATRCtrl (n = 3), ATRRPTC–/– (n = 5). (I) Representative images of Ki67-stained sections of CKLs and injured kidneys from ATRCtrl and ATRRPTC–/– mice on day 7. Scale bar: 50 μm. Dot plot shows the corresponding quantification of Ki67+ cells. ATRCtrl (n = 4), ATRRPTC–/– (n = 5). (J) Representative images of F4/80- and Ki67-stained and α-SMA– and Ki67-stained sections of injured kidneys from ATRRPTC–/– mice on day 7. Scale bars: 50 μm. (K) Representative images of pH3-stained sections of CLKs and injured kidneys from ATRCtrl and ATRRPTC–/– mice on day 7. Scale bar: 50 μm. Dot plot shows the corresponding quantification of pH3+ nuclei. ATRCtrl (4), ATRRPTC–/– (n = 5). (L and M) Quantitative RT-PCR analysis of p53 and p21 mRNA levels in kidneys from ATRCtrl and ATRRPTC–/– mice on day 7. ATRCtrl (n = 3), ATRRPTC–/– (n = 5). Data are presented as the mean ± SEM. Statistical significance was determined by 2-tailed, unpaired t test (UUO ATRCtrl vs. UUO ATRRPTC–/–). *P < 0.05 and **P < 0.01.
Figure 10
Figure 10. Atr deletion increases the formation of TASCCs in RPTECs in human kidney organoids exposed to cisplatin and mice after UUO.
(A) Representative images of H9 cell–derived day-64 organoids treated with either cisplatin (5 μM for 24 hours and analyzed 24 hours or 120 hours after cisplatin removal [long term]) or vehicle (DMSO). Sections of the organoids were stained for LC3, mTOR, and DAPI. Arrowheads point to TASCCs. The right 6 panels are enlarged images of the boxed areas. n = 2× 8–11 HPF in each treatment group. Scale bars: 10 μm. (B) Super-resolution SIM images of kidney tissue from ATRCtrl and ATRRPTC–/– mice 7 days after UUO, stained for LC3, mTOR, and DAPI. Shown are representative single-plane and 3D reconstruction images. Scale bars: 2 μm (all panels). Dot plot shows the quantification of TASCCs. ATRCtrl (n = 4), ATRRPTC–/– (n = 4). Data are presented as the mean ± SEM. Statistical significance was determined by 1-way ANOVA with Tukey’s post hoc test (A) and 2-tailed, unpaired t test (B). **P < 0.01.

Comment in

References

    1. Chertow GM, Burdick E, Honour M, Bonventre JV, Bates DW. Acute kidney injury, mortality, length of stay, and costs in hospitalized patients. J Am Soc Nephrol. 2005;16(11):3365–3370. doi: 10.1681/ASN.2004090740. - DOI - PubMed
    1. Bonventre JV, Yang L. Cellular pathophysiology of ischemic acute kidney injury. J Clin Invest. 2011;121(11):4210–4221. doi: 10.1172/JCI45161. - DOI - PMC - PubMed
    1. Palomba H, Castro I, Yu L, Burdmann EA. The duration of acute kidney injury after cardiac surgery increases the risk of long-term chronic kidney disease. J Nephrol. 2017;30(4):567–572. doi: 10.1007/s40620-016-0351-0. - DOI - PubMed
    1. [No authors listed]. Chronic kidney disease fact sheet. World Kidney Day. https://www.worldkidneyday.org/facts/chronic-kidney-disease/ Accessed August 14, 2019.
    1. Ferenbach DA, Bonventre JV. Acute kidney injury and chronic kidney disease: From the laboratory to the clinic. Nephrol Ther. 2016;12(Suppl 1):S41–S48. - PMC - PubMed

Publication types

MeSH terms

Substances