. 2020 Jul 1;116(8):1446-1457.
doi: 10.1093/cvr/cvz257.

Cell atlas of the foetal human heart and implications for autoimmune-mediated congenital heart block

Affiliations

Cell atlas of the foetal human heart and implications for autoimmune-mediated congenital heart block

Hemant Suryawanshi et al. Cardiovasc Res. .

Abstract

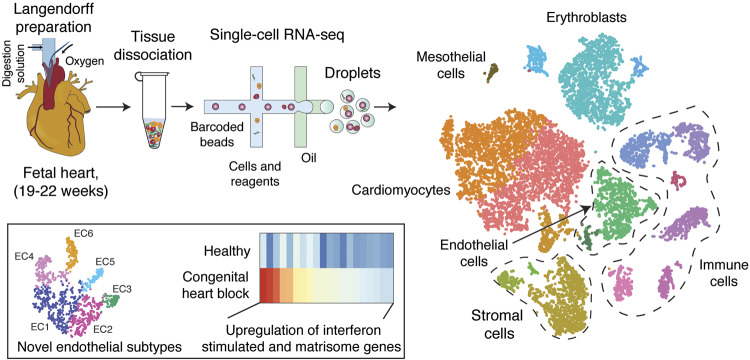
Aims: Investigating human heart development and applying this to deviations resulting in disease is incomplete without molecular characterization of the cell types required for normal functioning. We investigated foetal human heart single-cell transcriptomes from mid-gestational healthy and anti-SSA/Ro associated congenital heart block (CHB) samples.

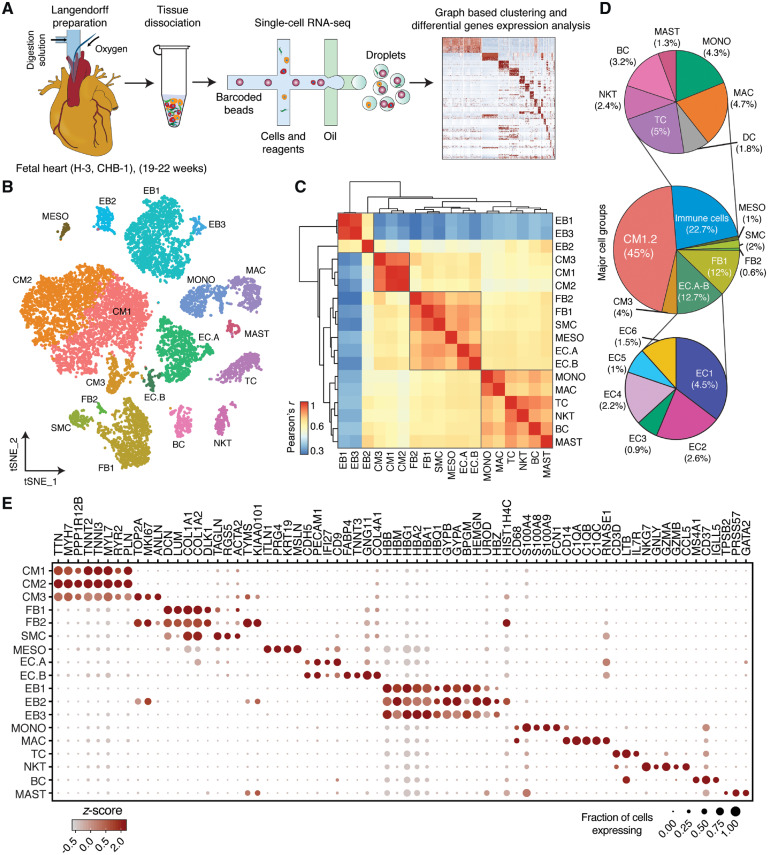
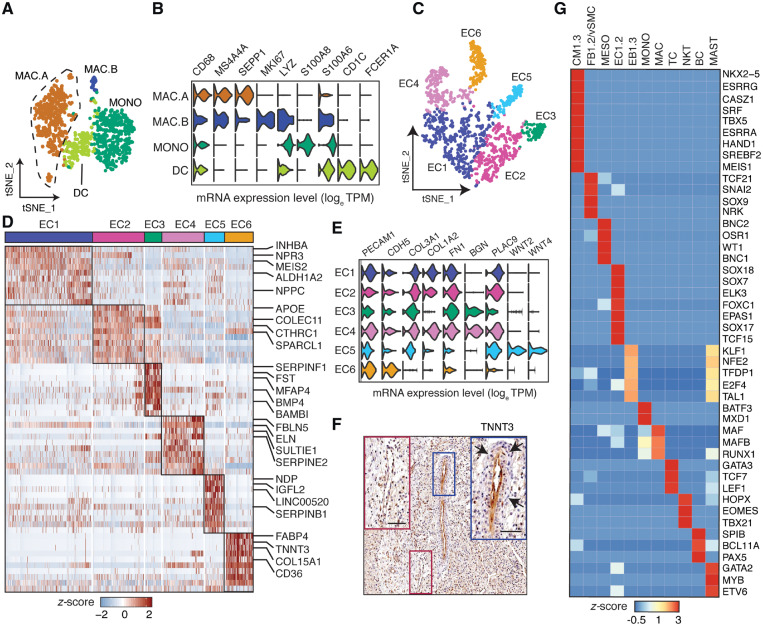
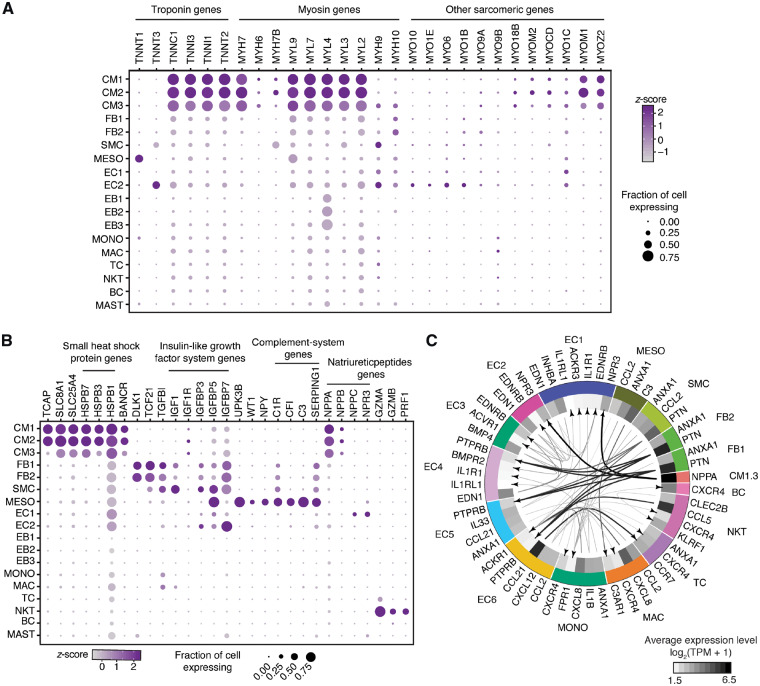
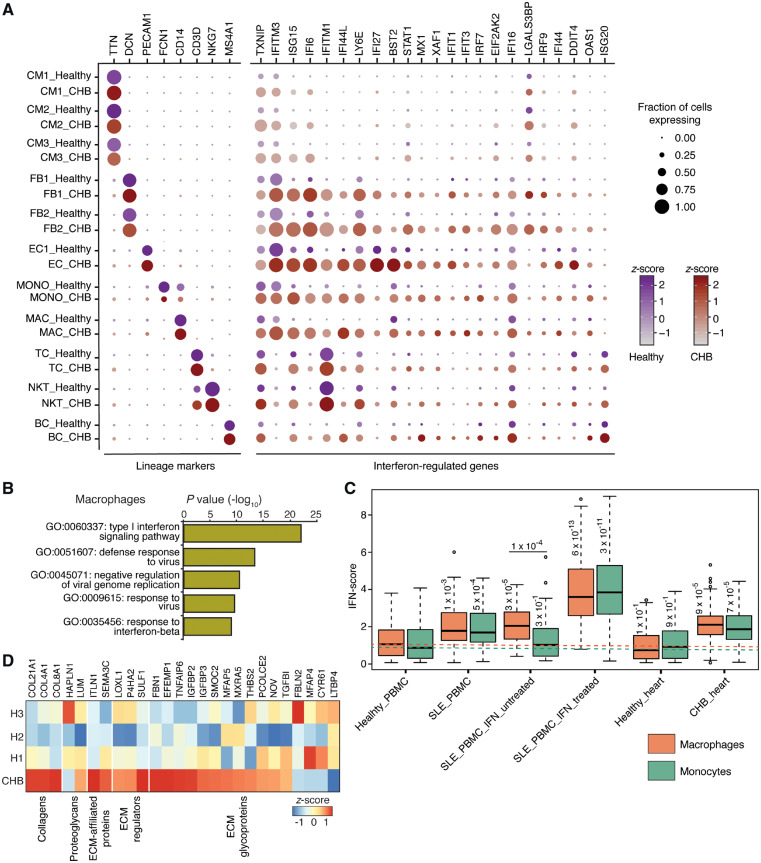
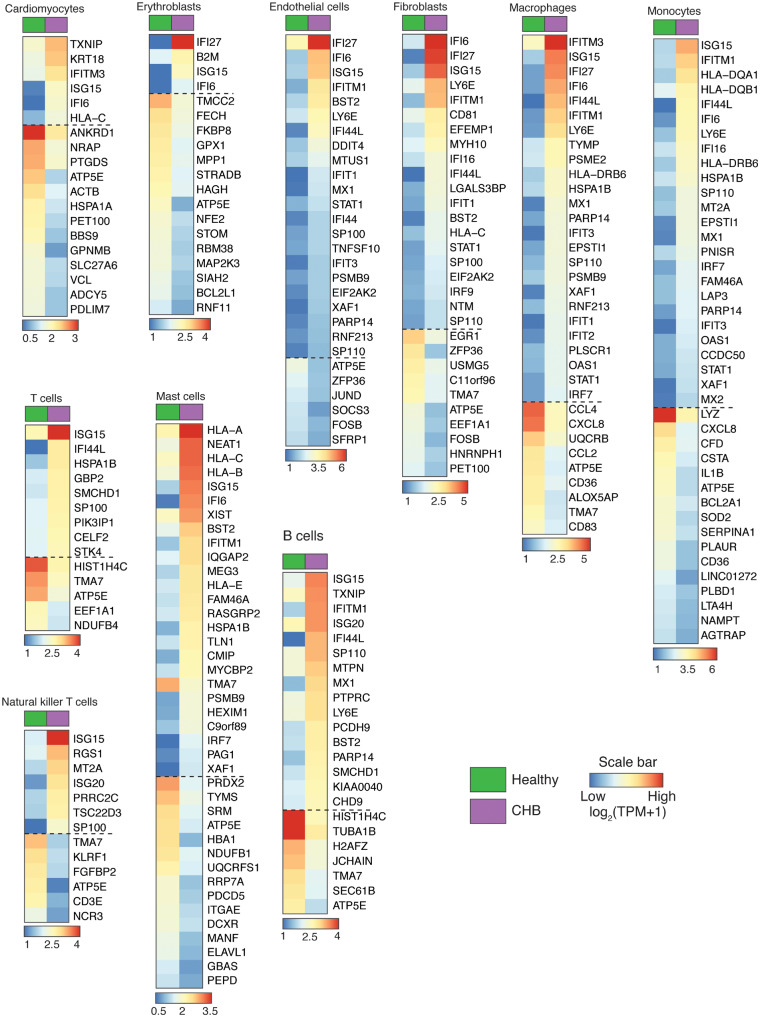
Methods and results: Three healthy foetal human hearts (19th to 22nd week of gestation) and one foetal heart affected by autoimmune-associated CHB (21st week of gestation) were subjected to enzymatic dissociation using the Langendorff preparation to obtain single-cell suspensions followed by 10× Genomics- and Illumina-based single-cell RNA-sequencing (scRNA-seq). In addition to the myocytes, fibroblasts, immune cells, and other minor cell types, previously uncharacterized diverse sub-populations of endothelial cells were identified in the human heart. Differential gene expression analysis revealed increased and heterogeneous interferon responses in varied cell types of the CHB heart compared with the healthy controls. In addition, we also identified matrisome transcripts enriched in CHB stromal cells that potentially contribute to extracellular matrix deposition and subsequent fibrosis.

Conclusion: These data provide an information-rich resource to further our understanding of human heart development, which, as illustrated by comparison to a heart exposed to a maternal autoimmune environment, can be leveraged to provide insight into the pathogenesis of disease.

Keywords: Congenital heart block; Endothelial cells; Foetal heart; Single-cell RNA-seq.


Figures

Graphical Abstract
Graphical Abstract
Figure 1
Figure 1
Identification of cell types in human foetal heart. (A) Workflow for single-cell transcriptome profiling of foetal hearts. Numbers in parentheses indicate the number of healthy (H) and disease (CHB) samples analysed. (B) Clustering for 12 461 cells from three healthy samples based on established lineage markers and visualized using t-SNE. (C) Pearson’s correlation coefficient (r, for values see colour scale) comparing averaged gene expression of each cell type. (D) Averaged proportion of all cell types (except EBs) contributing to foetal human hearts. Middle panel indicates major cell groups with subgroups of immune cells (top panel) and endothelial cells (bottom panel) and number in parenthesis indicates percentage contribution to foetal heart cells. (E) Dot plots showing expression of known lineage markers and co-expressed lineage-specific genes.
Figure 2
Figure 2
Sub-clustering and TF enrichment analysis of foetal heart cell types. (A) t-SNE visualization of 1093 myeloid-derived cells as four subgroups. (B) Violin plots showing expression for different myeloid-derived cell lineage markers and other co-expressed genes. (C) t-SNE visualization of 1263 EC cells sub-clustered into six subgroups. (D) Differentially expressed genes of EC sub-populations using Wilcoxon rank sum test. (E) Violin plots for EC lineage markers. (F) Immunohistochemical staining of a foetal human heart for TNNT3. Blue inset: EC6 endothelium and red inset: non-EC6 endothelium. Arrows indicate perivascular density surrounding the TNNT3-positive endothelium. Scale bar, 50 μm. (G) TF enrichment analysis showing the most abundant (maximum of 10) and specific TFs of major cell groups.
Figure 3
Figure 3
Dot plots showing expression of selected genes. (A) Troponin, myosin and other sarcomeric genes expression in healthy heart cell types. (B) Expression of other important genes in major cell types of foetal heart. (C) Putative signalling within foetal heart cell types with size of the arrow stem proportionate to expression levels of the ligands. All the arrows are pointing to the receptors. Only ligands with >5 TPM and receptors with >1.8 TPM average expression were used for interaction analysis display. MDK–PTPRB interactions were excluded, and provided as a separate figure (Supplementary material online, Figure S2B).
Figure 4
Figure 4
Gene expression differences between healthy and CHB heart cell types. (A) Dotplot of lineage markers and differentially expressed IFN-regulated genes (Wilcoxon rank sum test, expressed by >30% of cells of a given cell type, log fold change >1.5 in at least one cell type) between healthy and CHB cell types. (B) Gene ontology (GO) terms enriched in DAVID analysis performed on the top 25 up-regulated genes of CHB macrophages. (C) IFN-score plot of macrophages and monocytes obtained from various sources including healthy and systemic lupus PBMCs in the absence and presence of treatment with exogenous IFN beta. The Healthy_PBMC data was acquired from 10x Genomics (see methods section) and SLE_PBMC data was obtained from Der et al. study. Both the SLE_PBMC_IFN_untreated and treated datasets were acquired from Kang et al. study. The Healthy_heart and CHB_heart macrophages and monocytes belong to the present study. Dotted lines highlight median IFN-score of macrophages (orange) and monocytes (green) obtained from PBMCs obtained from healthy donors. Numbers on the boxplots indicate P-values from a Wilcoxon rank sum test. (D) Heatmap showing differential expression and enrichment of matrisome genes between CHB and healthy (H1, H2, and H3) stromal cells (FB and SMC). Only genes with expression >1 TPM and fold change (CHB vs. healthy) of 1.5 TPM were considered for the analysis.
Figure 5
Figure 5
Gene expression differences between healthy and CHB heart cell types. Heatmap reporting averaged expression level [log2(TPM + 1)] of differentially expressed genes (Wilcoxon rank sum test, >1.5 log fold change, expressed by >30% cells in a given cell type) between healthy and CHB cell types. Note that genes below the dashed line represent a subset of down-regulated genes of CHB vs. healthy cell types.

Comment in

  • Single-cell cardiovascular research.
    Engelhardt S, Engel FB. Engelhardt S, et al. Cardiovasc Res. 2020 Jul 1;116(8):1399-1401. doi: 10.1093/cvr/cvaa079. Cardiovasc Res. 2020. PMID: 32232428 No abstract available.

References

    1. Srivastava D. Making or breaking the heart: from lineage determination to morphogenesis. Cell 2006;126:1037–1048. - PubMed
    1. Meilhac SM, Buckingham ME.. The deployment of cell lineages that form the mammalian heart. Nat Rev Cardiol 2018;15:705–724. - PubMed
    1. Ivanovitch K, Esteban I, Torres M.. Growth and morphogenesis during early heart development in amniotes. J Cardiovasc Dev Dis 2017;4:20. - PMC - PubMed
    1. Cao J, Poss KD.. The epicardium as a hub for heart regeneration. Nat Rev Cardiol 2018;15:631–647. - PMC - PubMed
    1. Suryawanshi H, Morozov P, Straus A, Sahasrabudhe N, Max KEA, Garzia A, Kustagi M, Tuschl T, Williams Z.. A single-cell survey of the human first-trimester placenta and decidua. Sci Adv 2018;4:eaau4788.. - PMC - PubMed

Publication types

Supplementary concepts