. 2020 Jan;598(1):189-205.
doi: 10.1113/JP278612. Epub 2019 Nov 2.

Differential impact of two critical respiratory centres in opioid-induced respiratory depression in awake mice

Affiliations

Differential impact of two critical respiratory centres in opioid-induced respiratory depression in awake mice

Adrienn G Varga et al. J Physiol. 2020 Jan.

Abstract

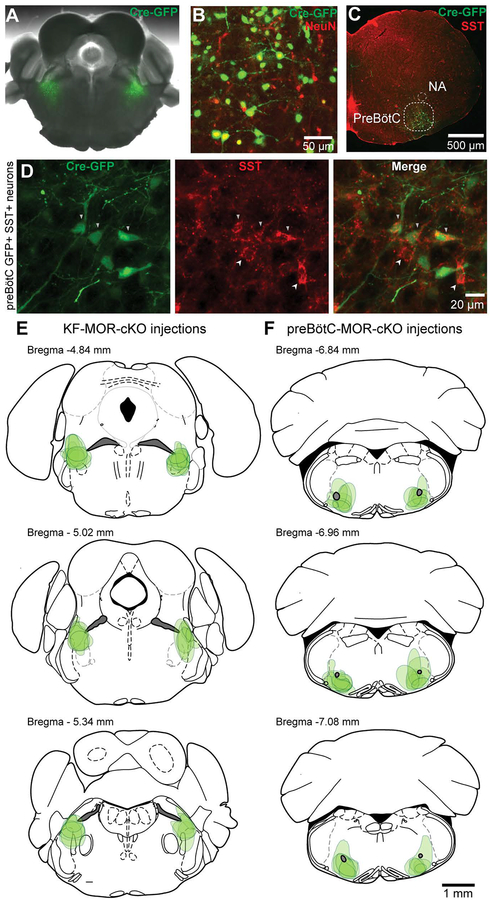
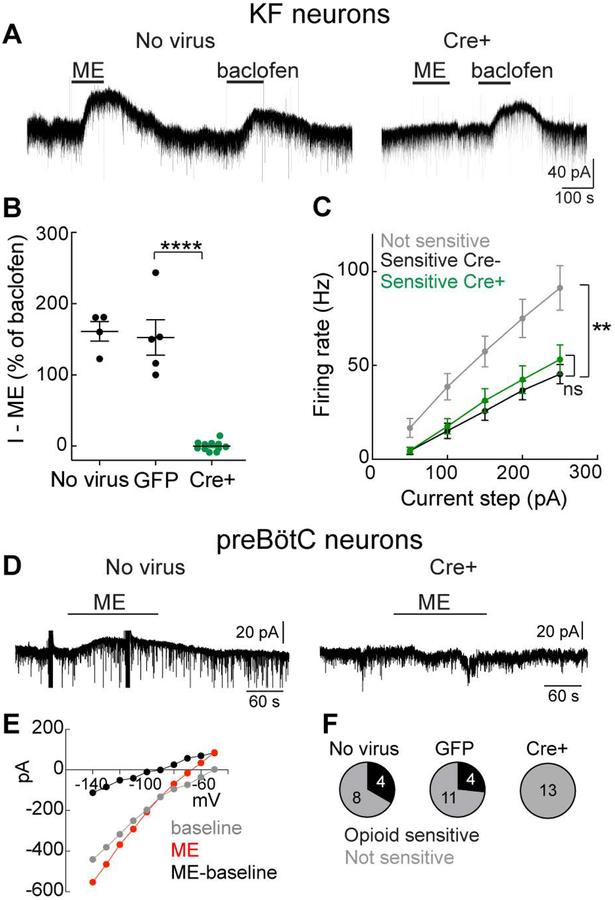
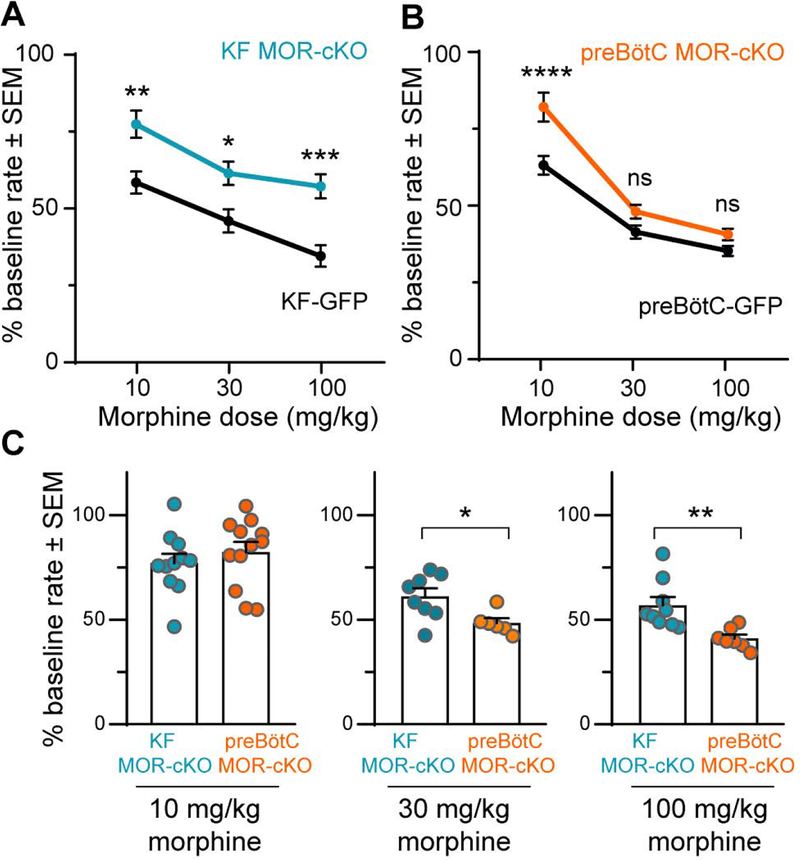
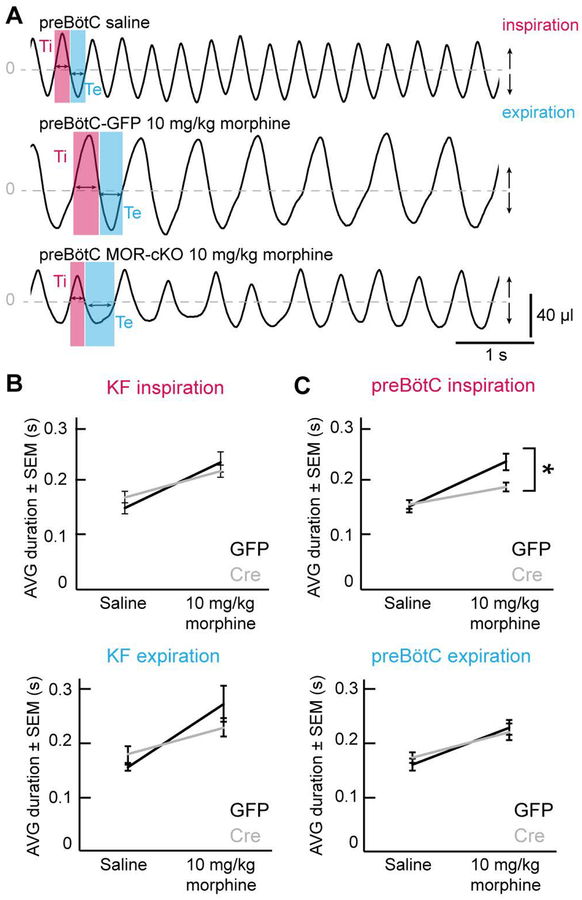
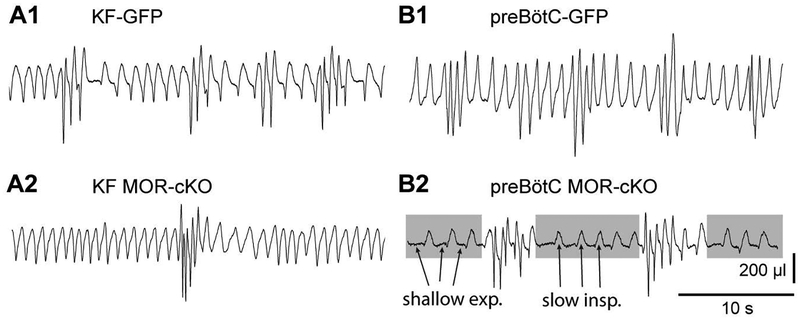
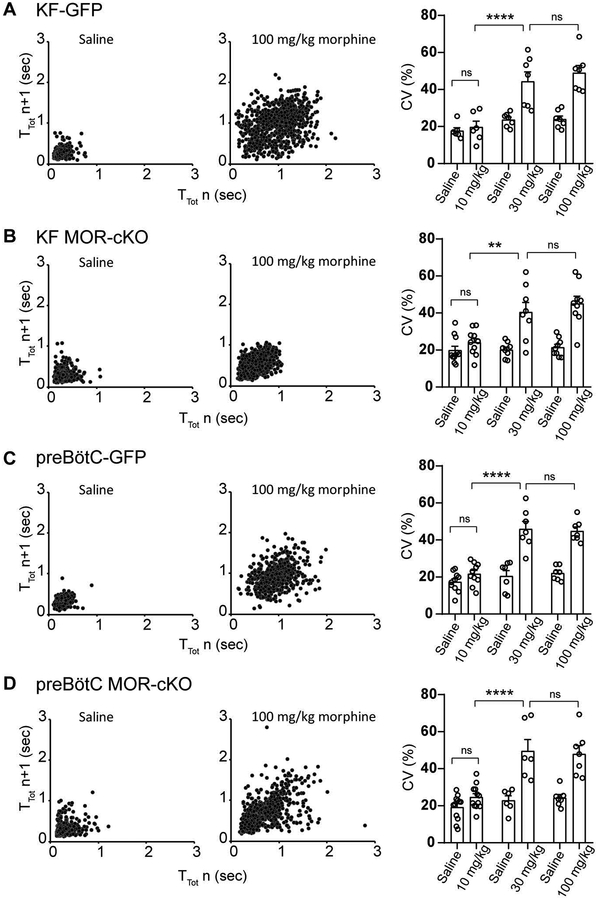
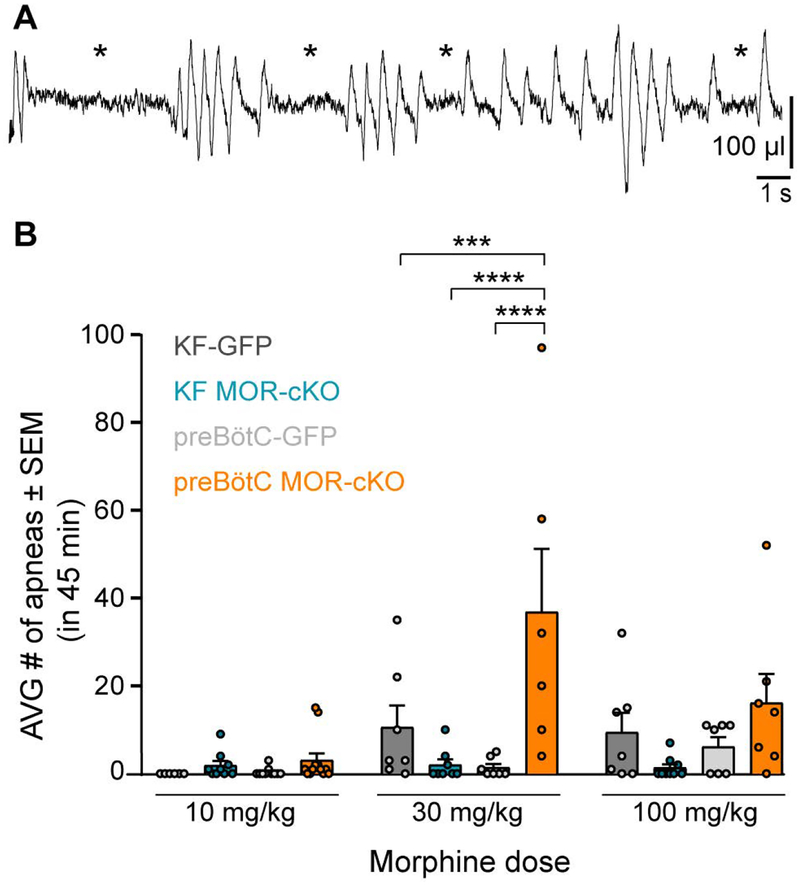
Key points: The main cause of death from opioid overdose is respiratory depression due to the activation of µ-opioid receptors (MORs). We conditionally deleted MORs from neurons in two key areas of the brainstem respiratory circuitry (the Kölliker-Fuse nucleus (KF) and pre-Bötzinger complex (preBötC)) to determine their role in opioid-induced respiratory disturbances in adult, awake mice. Deletion of MORs from KF neurons attenuated respiratory rate depression at all doses of morphine. Deletion of MORs from preBötC neurons attenuated rate depression at the low dose, but had no effect on rate following high doses of morphine. Instead, high doses of morphine increased the occurrence of apnoeas. The results indicate that opioids affect distributed key areas of the respiratory network in a dose-dependent manner and countering the respiratory effects of high dose opioids via the KF may be an effective approach to combat overdose.

Abstract: The primary cause of death from opioid overdose is respiratory failure. High doses of opioids cause severe rate depression and increased risk of fatal apnoea, which correlate with increasing irregularities in breathing pattern. µ-Opioid receptors (MORs) are widely distributed throughout the brainstem respiratory network, but the mechanisms underlying respiratory depression are poorly understood. The medullary pre-Bötzinger complex (preBötC) and the pontine Kölliker-Fuse nucleus (KF) are considered critical for inducing opioid-related respiratory disturbances. We used a conditional knockout approach to investigate the roles and relative contribution of MORs in KF and preBötC neurons in opioid-induced respiratory depression in awake adult mice. The results revealed dose-dependent and region-specific opioid effects on the control of both respiratory rate and pattern. Respiratory depression induced by an anti-nociceptive dose of morphine was significantly attenuated following deletion of MORs from either the KF or the preBötC, suggesting cumulative network effects on respiratory rate control at low opioid doses. Deletion of MORs from KF neurons also relieved rate depression at near-maximal respiratory depressant doses of morphine. Meanwhile, deletion of MORs from the preBötC had no effect on rate following administration of high doses of morphine. Instead, a severe ataxic breathing pattern emerged with many apnoeas. We conclude that opioids affect distributed areas of the respiratory network and opioid-induced respiratory depression cannot be attributed to only one area in isolation. However, countering the effects of near maximal respiratory depressant doses of opioids in the KF may be a powerful approach to combat opioid overdose.

Keywords: Kolliker-Fuse nucleus; MOR conditional knockout; morphine; mu-opioid receptors; pre-Bötzinger complex; respiratory depression.


Conflict of interest statement

Conflict of Interest: The authors declare no competing financial interests.

Figures

Figure 1.
Figure 1.. Identification of injection sites by immunohistochemistry.
A, Example AAV2-CMV-Cre-GFP injection (green) in the KF of a MORfl/fl mice. B, Example of immunohistochemistry against NeuN and GFP to quantify viral expression in KF neurons. C, D, A representative example of a preBötC injection site. Correct placement of viral injections into the preBötC was verified based on anatomical landmarks (C) and somatostatin immunostaining (D). Nucleus ambiguus (NA). Arrowheads pointing down indicate GFP-SST co-expression, arrowheads pointing up indicate SST-expression only. E, F Estimated dorsal-ventral and medial-lateral borders of bilateral AAV2-CMV-Cre-GFP injection sites in the KF (E) and preBötC (F) based on visualized GFP fluorescence spread. Each green shaded shape represents a single injection site placed in the rostro-caudal plane where GFP expression was maximal. Schematics of mouse brain slices were created based upon (Paxinos & Franklin, 2008).
Figure 2.
Figure 2.. Opioid-mediated currents are abolished from KF and preBötC neurons expressing Cre-GFP.
MORfl/fl mice were injected with AAV2-CMV-Cre-GFP or AAV2-CMV-GFP into the KF or preBötC. A, Whole-cell voltage-clamp recordings from KF neurons in brain slices from MORfl/fl mice that were naïve (left) or expressing Cre-GFP (right). Opioid agonist [Met5] -enkephalin (ME, 1 μM) and GABA-B receptor agonist baclofen (30 μM) caused an outward GIRK current in the control, but not Cre-GFP+ neuron. B, Summary of the ME-mediated outward current normalized to the baclofen-mediated current. Line and error are mean ± SEM. Individual data points are from individual neurons in a separate slice (one neuron per slice, max of two slices per animal). ****p < 0.0001, by one-way ANOVA and Tukey’s post-hoc test. C, Current-clamp recordings were made from KF neurons that were opioid/baclofen insensitive (NS), opioid/baclofen sensitive and not expressing Cre-GFP (sensitive Cre-) or opioid/baclofen sensitive and expressing Cre-GFP (sensitive Cre+). Data are mean ± SEM (n = 7–18). **p = 0.0022, ns= not significant by one-way ANOVA and Tukey’s post-hoc test. D, Whole-cell voltage-clamp recordings from preBötC neurons in brain slices from MORfl/fl mice that were naïve (left) or expressing Cre-GFP (right). ME (3 μM) caused an outward current in the control, but not the Cre-GFP+ neuron. Artifact from I-V protocol is present before and during ME. E, Example I-V relationship from an ME-sensitive preBötC neuron. Voltage steps (−50 to −140 mV, 50 ms) were performed at baseline (gray) and during ME (3 μM, red). The subtracted I-V is shown in black. F, Summary of the proportion of neurons identified with ME currents (opioid sensitive). Numbers within the pie are # of neurons.
Figure 3.
Figure 3.. Dose-dependent differential contributions of the KF and preBötC to morphine-induced respiratory rate depression.
Head-out plethysmography in awake adult MORfl/fl mice expressing GFP or Cre-GFP (MOR-cKO) in KF (A,C) or preBötC (B,C). Respiratory rate following morphine (10 – 100 mg/kg, ip) was normalized to saline (ip) baseline rate. A, KF MOR-cKO mice displayed significantly faster respiratory rates following all doses of morphine. Data are mean ± SEM (n = 6–11). B, preBötC MOR-cKO mice had significantly faster respiratory rates following low dose morphine (10 mg/kg). Morphine-induced respiratory depression was similar between GFP and preBötC MOR-cKO mice following 30 mg/kg and 100 mg/kg morphine. Data are mean ± SEM (n = 6–12). *p < 0.05, **p < 0.01, ***p < 0.001, ****p < 0.0001, ns = not significant by one-way ANOVA and Tukey’s post-hoc test C, Comparison between KF MOR-cKO and preBötC MOR-cKO mice at each morphine dose. Bars are mean ± SEM, individual points are from individual mice. *p < 0.05, **p < 0.01 by unpaired t-test.
Figure 4.
Figure 4.. Attenuation of respiratory depression in preBötC MOR-cKO mice is due to changes in inspiration.
A, Example plethysmography traces demonstrating respiratory phases. preBötC-GFP mice displayed regular breathing patterns and stable, ~1:1 ratio inspiratory (Ti) and expiratory (Te) phases following saline and low dose morphine (10 mg/kg). The inspiratory phase duration was significantly shorter in preBötC MOR-cKO animals following low dose morphine (10 mg/kg). All examples are from the steady-state phase (> 30 min) following morphine or saline injection. B, Inspiratory and expiratory phase durations increased proportionately in the KF-GFP control group, as well as the KF MOR-cKO group following morphine (10 mg/kg). Data are mean ± SEM, n = 11. C, There was a significant attenuation of the low dose morphine (10 mg/kg)-induced increase in inspiratory duration in preBötC MOR-cKO mice compared to GFP injected controls. Data are mean ± SEM, n = 12. *p<0.05 by unpaired t-test.
Figure 5.
Figure 5.. Removal of MORs from the preBötC results in increased variability in the respiratory pattern following high dose morphine.
Example plethysmography traces following high-dose morphine (100 mg/kg, ip) from KF-GFP (A1), KF MOR-cKO (A2), preBötC-GFP mice (B1) showing intermixed fast and slow breathing rates with smooth inspiration and expiration phase transitions. B2, preBötC MOR-cKO example trace following morphine (100 mg/kg, ip). Gray shaded boxes indicate periods of slow rate, with arrows indicating shallow expiratory periods and triangular inspirations that resemble gasping. Periods of gasping were interrupted by faster, higher amplitude activity.
Figure 6.
Figure 6.. High dose morphine induces irregular breathing patterns.
Left columns, Representative example Poincaré plots of the respiratory cycle duration TTot for nth cycle versus TTot for the nth + 1 cycle following saline and 100 mg/kg dose morphine administration for (A) KF-GFP, (B) KF-MOR-cKO, (C) preBӧtC-GFP and (D) preBӧtC-MOR-cKO groups. Right column, summary bar graphs show that the coefficient of variation (CV %) of instantaneous breathing frequency is significantly higher following 30 mg/kg and 100 mg/kg morphine administration in every group. Between-group comparisons did not reveal statistical differences (GFP vs. MOR-cKO, KF-MOR-cKO vs. preBӧtC-MOR-cKO). Data are mean ± SEM (n = 6–12). **p < 0.01, ****p < 0.0001, ns = not significant by two-way ANOVA followed by Holm-Sidak post-hoc test.
Figure 7.
Figure 7.. MOR deletion in the preBötC, but not the KF, increases the occurrence of apneas.
A, Example plethysmography trace from a preBötC MOR-cKO animal displaying ataxic breathing patterns with multiple apneas following morphine (100 mg/kg, ip). Apneas are indicated by *. B, Summary of the average number of apneas in 45 minutes following morphine (10 – 100 mg/kg). Saline trials (not shown) had 0 – 2 apneas per animal across all groups. Medium (30 mg/kg) dose of morphine induced significantly more apneas in the preBötC MOR-cKO group compared to all groups. No between-group statistical differences were detected for the 10 mg/kg and 100 mg/kg doses. Data are mean ± SEM, individual points are from individual mice, n = 6–12. ***p < 0.001, ****p < 0.0001, by two-way ANOVA and Tukey’s post-hoc test.

Comment in

References

    1. Baertsch NA, Baertsch HC & Ramirez JM (2018). The interdependence of excitation and inhibition for the control of dynamic breathing rhythms. Nat Commun 9, 1–17. - PMC - PubMed
    1. Baesens C & MacKay RS (2013). Analysis of a scenario for chaotic quantal slowing down of inspiration. J Math Neurosci 3, 1–17. - PMC - PubMed
    1. Bouillon T, Bruhn J, Roepcke H & Hoeft A (2003). Opioid-induced respiratory depression is associated with increased tidal volume variability. Eur J Anaesthesiol 20, 127–133. - PubMed
    1. Chamberlin NL (2013). Brain circuitry mediating arousal from obstructive sleep apnea. Curr Opin Neurobiol 23, 774–779. - PMC - PubMed
    1. Cregg JM, Chu KA, Dick TE, Landmesser LT & Silver J (2017). Phasic inhibition as a mechanism for generation of rapid respiratory rhythms. Proc Natl Acad Sci 114, 12815–12820. - PMC - PubMed

Publication types