. 2020 Jan;87(1):116-131.
doi: 10.1002/ana.25611. Epub 2019 Nov 23.

Duration of American Football Play and Chronic Traumatic Encephalopathy

Affiliations

Duration of American Football Play and Chronic Traumatic Encephalopathy

Jesse Mez et al. Ann Neurol. 2020 Jan.

Abstract

Objective: Chronic traumatic encephalopathy (CTE) is a neurodegenerative disease associated with exposure to contact and collision sports, including American football. We hypothesized a dose-response relationship between duration of football played and CTE risk and severity.

Methods: In a convenience sample of 266 deceased American football players from the Veterans Affairs-Boston University-Concussion Legacy Foundation and Framingham Heart Study Brain Banks, we estimated the association of years of football played with CTE pathological status and severity. We evaluated the ability of years played to classify CTE status using receiver operating characteristic curve analysis. Simulation analyses quantified conditions that might lead to selection bias.

Results: In total, 223 of 266 participants met neuropathological diagnostic criteria for CTE. More years of football played were associated with having CTE (odds ratio [OR] = 1.30 per year played, 95% confidence interval [CI] = 1.19-1.41; p = 3.8 × 10⁻⁹ ) and with CTE severity (severe vs mild; OR = 1.14 per year played, 95% CI = 1.07-1.22; p = 3.1 × 10⁻⁴ ). Participants with CTE were 1/10th as likely to have played <4.5 years (negative likelihood ratio [LR] = 0.102, 95% CI = 0.100-0.105) and were 10 times as likely to have played >14.5 years (positive LR = 10.2, 95% CI = 9.8-10.7) compared with participants without CTE. Sensitivity and specificity were maximized at 11 years played. Simulation demonstrated that years played remained adversely associated with CTE status when years played and CTE status were both related to brain bank selection across widely ranging scenarios.

Interpretation: The odds of CTE double every 2.6 years of football played. After accounting for brain bank selection, the magnitude of the relationship between years played and CTE status remained consistent. ANN NEUROL 2020;87:116-131.


Conflict of interest statement

C.J.N. and R.A.S. receive nonfinancial support from the NFL Players Association (NFLPA) Mackey‐White Health & Safety Committee. The NFLPA is a union that looks out for the health, safety, and financial interests of current and former NFL players. C.J.N. receives nonfinancial support from Brock International, a firm that manufactures artificial turf designed to reduce football‐related head injuries from impacts with the ground.

Figures

Figure 1
Figure 1
Flowchart showing participant inclusion. Curved arrows indicate excluded participants. Of the 155 donors enrolled between 2008 and 2013, 92 (81 with CTE, 11 without CTE) were included in the analytic set. Of the 249 donors enrolled between 2014 and 2017, 163 (142 with CTE, 21 without CTE) were included in the final analytic set. CTE = chronic traumatic encephalopathy; FHS: Framingham Heart Study; VA‐BU‐CLF: Veterans Affairs–Boston University–Concussion Legacy Foundation.
Figure 2
Figure 2
Distribution of duration played and representative images of chronic traumatic encephalopathy (CTE) status and CTE severity. (A) Violin plots of duration played stratified by CTE status. The colored areas show the distribution of duration played. The interior boxplots show the median, lower and upper quartiles, and 95% confidence intervals. (B, C) Ten‐micrometer paraffin‐embedded tissue sections were immunostained with microscopic mouse monoclonal antibody for phosphorylated tau (AT8; Pierce Endogen, Waltham, MA) and counterstained with hematoxylin. Positive p‐tau immunostaining appears dark red. (B) Normal blood vessel at the sulcal depth with no CTE pathology. (C) CTE perivascular lesion: neurofibrillary tangles and dotlike and threadlike neurites surround a small blood vessel at the sulcal depth. (D) Violin plots of duration played stratified by CTE severity among participants with CTE. The colored areas show the distribution of duration played. The interior boxplots show the median, lower and upper quartiles, and 95% confidence interval. (E, F) Fifty‐micrometer hemispheric tissue sections immunostained with mouse monoclonal antibody CP‐13, directed against tau phosphoserine 202 (courtesy of Peter Davies, PhD, Feinstein Institute for Medical Research; 1:200). (E) Mild CTE pathology with multiple perivascular p‐tau CTE lesions at depths of sulci of the frontal cortex without neurofibrillary degeneration in the medial temporal lobe. (F) Severe CTE pathology with multiple large CTE lesions in the frontal cortex and insula, and diffuse neurofibrillary degeneration in the medial temporal lobe.
Figure 3
Figure 3
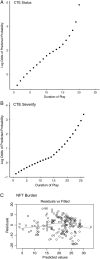
Evaluating the linearity assumption. (A) Locally estimated scatterplot smoothing (LOESS) regression plot of the log odds of the predicted probability of chronic traumatic encephalopathy (CTE) status by duration played. The plot appears visually to be relatively linear. (B) LOESS regression plot of the log odds of the predicted probability of CTE severity by duration played among participants diagnosed with CTE. The plot appears visually to be relatively linear. (C) Plot of the residuals by predicted values for the duration played–neurofibrillary tangle (NFT) burden linear regression model. The plot appears randomly scattered.
Figure 4
Figure 4
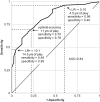
Receiver operating characteristic curve using duration played to classify chronic traumatic encephalopathy (CTE) status. Thresholds of duration played that corresponded to negative and positive likelihood ratios (LR−, LR+, respectively) closest to 0.1 and 10 were 4.5 years and 14.5 years, respectively. Diagnostic tests with these likelihood ratios may produce sizable and often conclusive shifts from pre‐ to post‐test probability.42 CTE classification sensitivity and specificity were maximized together at approximately 11 years played. AUC = area under the curve.
Figure 5
Figure 5
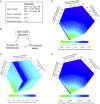
Evaluating selection bias. (A) Factors and their associations with the relative odds of brain donation status from a community‐based aging cohort that were included in the selection model (adapted from Haneuse et al12). Both education level and sex also predicted brain donation, but were excluded from the selection model because there were no women in this study and because education quality differs markedly for college and professional football players. OR = odds ratio. (B) Simplified directed acyclic graph demonstrating the relationship between duration of American football play, chronic traumatic encephalopathy (CTE) pathology, and brain bank selection. Brain bank selection will only bias the relationship between duration of American football play and CTE pathology (dotted blue arrow) if both duration played (or a cause of duration played) and CTE pathology (or a cause of CTE pathology) are related to brain bank selection. (C) Simulation analyses assessed how a range of non‐negative values for selection parameters for duration played (βD, ie, log odds of brain donation for each additional year played when CTE pathology is absent), CTE disease status (βC, ie, log odds of brain donation when CTE pathology is present compared with absent when duration played is approaching zero), and the duration played × CTE status cross product (βDC, ie, additional log odds of brain donation for each additional year played beyond βD, when CTE pathology is present) would affect the odds ratio for the relationship between duration played and CTE disease status. (D, E) Similar simulation analyses assessed how a range of non‐negative values for selection parameters would affect (D) the odds ratio for the relationship between duration played and CTE severity, and (E) the relationship between duration played and neurofibrillary tangle (NFT) burden. SD = standard deviation.

Comment in

References

    1. Corsellis JA, Bruton CJ, Freeman‐Browne D. The aftermath of boxing. Psychol Med 1973;3:270–303. - PubMed
    1. Omalu BI, DeKosky ST, Minster RL, et al. Chronic traumatic encephalopathy in a National Football League player. Neurosurgery 2005;57:128–134; discussion 128–134. - PubMed
    1. McKee AC, Stern RA, Nowinski CJ, et al. The spectrum of disease in chronic traumatic encephalopathy. Brain J Neurol 2013;136(pt 1):43–64. - PMC - PubMed
    1. Bieniek KF, Ross OA, Cormier KA, et al. Chronic traumatic encephalopathy pathology in a neurodegenerative disorders brain bank. Acta Neuropathol 2015;130:877–889. - PMC - PubMed
    1. Mez J, Daneshvar DH, Kiernan PT, et al. Clinicopathological evaluation of chronic traumatic encephalopathy in players of American football. JAMA 2017;318:360–370. - PMC - PubMed

Publication types