. 2019 Nov 7;11(11):e10547.
doi: 10.15252/emmm.201910547. Epub 2019 Oct 7.

Pyrin dephosphorylation is sufficient to trigger inflammasome activation in familial Mediterranean fever patients

Affiliations

Pyrin dephosphorylation is sufficient to trigger inflammasome activation in familial Mediterranean fever patients

Flora Magnotti et al. EMBO Mol Med. .

Abstract

Familial Mediterranean fever (FMF) is the most frequent hereditary systemic autoinflammatory syndrome. FMF is usually caused by biallelic mutations in the MEFV gene, encoding Pyrin. Conclusive genetic evidence lacks for about 30% of patients diagnosed with clinical FMF. Pyrin is an inflammasome sensor maintained inactive by two kinases (PKN1/2). The consequences of MEFV mutations on inflammasome activation are still poorly understood. Here, we demonstrate that PKC superfamily inhibitors trigger inflammasome activation in monocytes from FMF patients while they trigger a delayed apoptosis in monocytes from healthy donors. The expression of the pathogenic p.M694V MEFV allele is necessary and sufficient for PKC inhibitors (or mutations precluding Pyrin phosphorylation) to trigger caspase-1- and gasdermin D-mediated pyroptosis. In line with colchicine efficacy in patients, colchicine fully blocks this response in FMF patients' monocytes. These results indicate that Pyrin inflammasome activation is solely controlled by Pyrin (de)phosphorylation in FMF patients while a second control mechanism restricts its activation in healthy donors/non-FMF patients. This study paves the way toward a functional characterization of MEFV variants and a functional test to diagnose FMF.

Keywords: autoinflammation; caspase-1; colchicine; diagnosis; pyroptosis.


Conflict of interest statement

FM, LL, AM, AB, YJ, and TH are listed on a patent related to FMF diagnosis.

Figures

Figure 1
Figure 1. PKC inhibitors specifically trigger IL‐1β release and a fast cell death in monocytes from FMF patients
  1. A–I

    Monocytes from healthy donors (HD) or FMF patients were either primed with LPS (A–C, G–I) or not (D–F) and treated with (A, C) 1.25 μM staurosporine (Stauro), (B, D–F) 12.5 μM UCN‐01, or (G–I) 5 μM nigericin (Nig). (A, B) IL‐1β and (C) TNF level were quantified by ELISA at 90 min post stimulation. (D, G) Cell death was monitored in real time by measuring propidium iodide influx/fluorescence every 5 min. (E, H) The time required to reach 20% cell death and (F, I) the area under the curve (AUC) were computed for each HD or FMF patients.

Data information: (A–C, E–F, H, I) Each dot represents the mean value from three biological replicates for one HD or patient. The bar represents the median ± interquartile range. a.u.: arbitrary units. (D, G) Each point of the curve corresponds to the average cell death values from the indicated number of HD or FMF patients (for each individual, the value is the mean of a biological triplicate). The dotted line indicates the 20% cell death value. (A, B, F) ***P < 0.0001 by Wilcoxon rank‐sum test. (C) One‐way ANOVA with Sidak's multiple comparison tests was performed. LPS: N. S. Not significant P = 0.99; LPS + Staurosporine N.S.: P = 0.77. (E, H) Unpaired t‐tests were performed, and two‐tailed P‐values are shown. (E) ***P < 0.0001, (H) N.S.: P = 0.79. (I) N.S. P = 0.9 by Wilcoxon rank‐sum test.Source data are available online for this figure.
Figure 2
Figure 2. The PKC inhibitor, UCN‐01, triggers pyroptosis or apoptosis in monocytes from FMF patients and HD, respectively
  1. A, B

    Monocytes from HD or FMF patients were treated with 12.5 μM UCN‐01 for 40 min or primed with LPS (3 h) and treated with 5 μM nigericin (Nig) for 90 min. (A) Cells were immuno‐stained for ASC. ASC specks are indicated by red arrowheads. Representative confocal microscopy images from one HD (top panels) and one FMF patient (bottom panels) are shown. Scale bars: 10 μm and 2.5 μm in the main figures and onsets, respectively. (B) Quantification of ASC specks in HD and FMF patients’ monocytes by immunofluorescence.

  2. C

    The frequency of cells positive for active caspase‐1 was quantified by flow cytometry, using FLICA‐Caspase‐1 in HD and FMF patients.

  3. D, E

    Cell death was assessed at 90 min post‐UCN‐01 or post‐LPS + nigericin treatment by determining the percentage of Annexin‐V+/PI cells and of PI+ cells among dead cells (Annexin‐V+ and/or PI + cells) using flow cytometry. (D) Representative FACS plots from one healthy donor (HD) and one FMF patient are shown. Percentage are indicated for the two right gates. (E) Cell death modality was assessed by determining the percentage of treatment‐induced Annexin‐V+/PI cells and of PI+ cells among dead cells, using flow cytometry.

Data information: (B, C, E) Kruskal–Wallis with Dunn's multiple comparison tests were performed to compare HD and FMF responses. Adjusted P‐values are detailed below. (B) Each dot (HD)/symbol (FMF) represents the percentage of cells containing an ASC speck for one individual. Symbol to FMF patient #: square #2 (M694I/M694I), round #26 (V726A/V726A), triangle #13 (M694V/R761H), diamond #18 (M694I/M694I). UCN‐01 **P = 0.0095; LPS + nigericin N.S. P = 0.75. (C) Each dot (HD)/symbol(FMF) represents the percentage of cells stained with FLICA‐Casp1 for one individual, the bar represents the median (±interquartile range). Symbol to FMF patient #: round #26 (V726A/V726A), triangle #13 (M694V/R761H), triangle pointing down #23 (M694V/M694V), hexagon #24 (M694V/M694V), star #10 (M694V/M694V). Untreated: N.S. P = 1; UCN‐01: **P = 0.0069; LPS + nigericin: N.S. P = 1. (E) Each dot (HD)/triangle (FMF) represents the value for one individual, and the bar represents the median (± interquartile range). UCN‐01: ***P < 0.0001; LPS + nigericin N.S. P = 0.51.Source data are available online for this figure.
Figure 3
Figure 3. Colchicine blocks inflammasome activation in monocytes from FMF patients following PKC inhibitor treatment
Monocytes from healthy donors (HD) or FMF patients were primed for 3 h as indicated with LPS (A, B) or not (C–E). When indicated, (A) the NLRP3 inhibitor MCC950 (10 μM) or (B–E) colchicine (1 μM) were added 30 min before addition of 12.5 μM UCN‐01, 125 ng/ml TcdB, or 5 μM nigericin.
  1. A, B

    IL‐1β level was quantified by ELISA at 90 min post‐stimulation.

  2. C–E

    Cell death was monitored in real time by measuring propidium iodide influx/fluorescence every 5 min.

Data information: (A, B, D, E) Each symbol represents the mean value from three biological replicates for one HD or patient. The bar represents the median value (± interquartile range). (C) Each point of the curve corresponds to the average cell death values from three biological replicates of monocytes from HD or FMF patients (diamond #32 (p.M694V/p.M694V); triangle #33 (p.M694V/p.M694V); square #1 (p.M694I/p.V726A). The curves are displayed for each patient/HD. The time required to reach 20% cell death (D) and the area under the curve (AUC) (E) were computed for each HD or FMF patients. Each symbol represents the mean value from one HD or patient. The bar represents the median (± interquartile range). (D) ND indicates that the average cell death was below 20% at the end of the kinetics. (A) Wilcoxon matched‐pairs signed rank test was used to compare untreated and MCC950‐treated groups since all the groups did not contain an identical number of individuals. FMF, UCN‐01 NS : P = 0.84, HD TcdB NS: P = 0.81, FMF TcdB NS: P = 0.84, HD Nig *P = 0.039, FMF Nig *P = 0.031. Individual genotypes are presented in Appendix Figure S5A. (B) Friedman paired test with Dunn's correction for multiple comparisons was applied to compare untreated and colchicine‐treated groups. Adjusted P‐values are as follow: FMF UCN‐01 *P = 0.036; HD TcdB ***P = 0.0006; and FMF TcdB NS P = 0.28. (D, E) Wilcoxon matched‐pairs signed rank test was used to compare untreated and colchicine‐treated groups. Adjusted P‐values are as follow: (D) N.T.: not tested. FMF *P = 0.016; (E) HD N.S. P = 0.62, FMF *P = 0.016.Source data are available online for this figure.
Figure EV1
Figure EV1. Nocodazole and colchicine, the latter in a dose‐dependent manner, inhibit UCN‐01‐mediated responses
  1. A

    Primary human monocytes from FMF patient were primed with LPS and stimulated as indicated with UCN‐01 in the presence of paclitaxel (Taxol, 5 μM), nocodazole (5 μM), or colchicine (1 μM).

  2. B

    Propidium iodide incorporation was monitored every 5 min post‐UCN‐01 addition in the presence of Taxol (5 μM), nocodazole (5 μM), or colchicine (1 μM). PI incorporation was normalized using TX‐100 cells (total PI incorporation). (A, C, D) IL‐1β concentration in the supernatant was quantified by ELISA.

  3. C, D

    Primary human monocytes from the indicated healthy donor (HD) or FMF patient were primed with LPS and stimulated as indicated with (C) UCN‐01 or (D) TcdA (1 μg/ml) in the presence of the indicated concentration of colchicine.

Data information: (A) Each symbol corresponds to the mean of a biological triplicate for one FMF patient (square, triangle, and round, patients #35, 36, 37 (all M694V/M694V), respectively), and the bar shows the median ± interquartile range. (B) Each symbol represents the mean (± SD) of a biological triplicate for one FMF patient. (C, D) Each dot represents one biological replicate, and the bar shows the mean of a biological triplicate from one individual.
Figure EV2
Figure EV2. Doxycycline‐mediated expression of p.[M694V] MEFV is necessary and sufficient to confer to PKC inhibitors the ability to trigger IL‐18 release
U937 MEFVKO cells expressing the indicated plasmids were treated, when indicated, with doxycycline for the indicated time
  1. A, B

    The expression of Flag‐Pyrin was revealed by Western blotting analysis against Flag (A) or against Pyrin (B).

  2. C

    IL‐18 levels were quantified in the supernatant of PMA‐differentiated U937 cells by ELISA at 3 h post‐treatment with UCN‐01 or staurosporine (Stauro). One experiment representative of two independent experiments is shown. The bar represents the mean of a biological triplicate.

Source data are available online for this figure.
Figure 4
Figure 4. Expression of p.M694V Pyrin is necessary and sufficient to confer to PKC inhibitors the ability to activate the inflammasome
  1. A–C

    U937 cells of the indicated genotype and expressing the indicated plasmids were treated with (A, C) UCN‐01 or LPS + nigericin (Nig). Propidium iodide (PI) influx/fluorescence was monitored every 5 min for 3 h.

  2. D, E

    PMA‐differentiated U937 cells of the indicated genotype and expressing the indicated plasmids were primed with LPS for 3 h and treated with UCN‐01, staurosporine (Stauro) or nigericin as indicated. IL‐1β level in the supernatant was quantified by ELISA at 3 h post‐treatment.

  3. F

    Pyrin S242 phosphorylation was assessed by Western blot in the indicated cell lines with and without UCN‐01 treatment for 15 min.

Data information: (A–C) One experiment representative of three independent experiments is shown. Mean and standard deviations from two biological replicates are shown. (D, E) Mean and standard deviations from three independent experiments are shown.Source data are available online for this figure.
Figure EV3
Figure EV3. Expression of the p.M694I or the p.M680I, but not of the p.P369S, Pyrin variants triggers inflammasome activation in response to UCN‐01
The expression of the indicated Pyrin variants was induced in U937 cells using doxycycline (Appendix Fig S6).
  1. A–F

    Propidium iodide (PI) influx/fluorescence was monitored every 5 min for 3 h in response to UCN‐01 (A–C) or LPS + nigericin (D–F).

  2. G, H

    U937 cells were differentiated in macrophages using PMA, treated with LPS and UCN‐01 (G) or nigericin (H). IL‐1β levels were quantified by ELISA.

  3. I

    The frequency of the different MEFV alleles is shown (data extracted from gnomad).

Data information: Cell death was normalized using PI incorporation in TX‐100‐treated cells. Panels (A, B, D and E) result from two independent transduction experiments and are compared with their respective control cells. One experiment representative of 4 (B, E), 5 (D) to 8 (A) independent experiments is shown. Mean and standard deviations from three biological replicates are shown. (C, F) Area under the curve (AUC) was normalized to WT‐treated cells. One dot represents the average of a biological triplicate, and the bar represents the mean ± SD of 4–8 independent experiments as indicated. (G, H) IL‐1β concentrations were normalized to WT‐treated cell levels. One dot represents the average of a biological triplicate, and the bar represents the mean ± SD of three independent experiments. (C, F, G, H) The horizontal dotted line corresponds to the value of U937 cells expressing WT Pyrin (normalized to 100%). (C, F, G, H) Values did not pass the D'Agostino and Pearson omnibus normality test; Kruskal–Wallis analysis with Dunn's correction for multiple comparisons was applied, and two‐tailed P‐values are shown. (C) WT vs. M694V ***P < 0.0001; WT vs. M694I **P = 0.0011; WT vs. M680I **P = 0.0065 (G) WT vs. M694V *P = 0.0214; WT vs. M694I *P = 0.0476 (H) WT vs. M694I *P = 0.0431.
Figure EV4
Figure EV4. SiRNA‐mediated knock‐down of PKN2 in PKN1 KO cells expressing p.M694V Pyrin increases cell death
  1. A

    PKN1KO clones expressing p.M694V or WT Pyrin were obtained and confirmed by Western blot analysis. Four clones are shown. Clones 3 and 6 were selected.

  2. B

    Absolute transcript level of the indicated genes was quantified by RNAseq in U937 cells (Benaoudia et al, 2019) and expressed as count per million (cpm). PYCARD encodes ASC and is shown as a reference.

  3. C

    PKN2 transcript levels were assessed in U937 cells at 24 h post‐electroporation with the indicated non‐targeting (NT) siRNA or three different siRNAs targeting PKN2.

  4. D–F

    U937 cells with the indicated Pyrin variant were treated (+Dox, plain lines) or not (No Dox, dotted lines) with doxycycline (Dox) at 24 h post‐electroporation with the indicated siRNA. Cell death was monitored every 15 min. (F) SiRNA 14 did not reduce substantially PKN2 levels.

Data information: (D, E, F) Cell death was normalized to the maximal propidium iodide (PI) incorporation determined using TX‐100‐treated cells. Each dot represents the mean ± SD of a biological triplicate from one experiment representative of three independent experiments.Source data are available online for this figure.
Figure 5
Figure 5. Expression of p.M694V Pyrin is necessary and sufficient to confer to the phospho‐null p.S242R/p.S208C variants the ability to activate the inflammasome
U937 cells bearing the indicated plasmids were treated as indicated at time 0 with doxycycline (Dox) and at 20 h post‐Dox addition with UCN‐01
  1. A, B

    Propidium iodide (PI) influx/fluorescence was monitored every 15 min for 20 h and every 5 min for an additional 4 h.

  2. C, D

    Area under the curve (AUC) corresponding to Fig 5A and B was computed from = 0 to t = 20 h (C) and from 20 to 24 h (D).

  3. E, F

    IL‐18 was quantified in the supernatant of the indicated U937 cells at 15 h post‐doxycycline/PBS addition (E) or in the supernatant of U937 cells exposed to 15 h of doxycycline/PBS and an additional 3 h of incubation with UCN‐01 (F).

Data information: (A–F) One experiment representative of three independent experiments is shown. (A, B) Each dot represents the mean ± SD of a biological triplicate. Values right after UCN‐01 addition were corrected to match values right before UCN‐01 addition to correct for a reading artifact, and the correction factor was applied until the end of the experiment. Data presented in (A and B) are from the same experiment and have been split for clarity. The WT and p.M694V controls are duplicated in (A and B). (C–F) The bar represents the mean ± SD of a biological triplicate. One‐way ANOVA with Holm–Sidak's multiple comparisons test was performed to compare untreated and doxycycline‐treated samples: (C) p.S208C/S242R/M694V ***P < 0.0001 (D) p.M694V ***P < 0.0001; p.208C/M694V *P = 0.016; p.S208C/S242R/M694V ***P = 0.0004. (E) p.208C/M694V ***= 0.0001; p.S242R/M694V ***P < 0.0001; p.S208C/S242R/M694V ***P < 0.0001. (F) p.M694V ***P < 0.0001; p.208C/M694V ***P < 0.0001; p.S242R/M694V ***P < 0.0001; p.S208C/S242R/M694V ***P < 0.0001.Source data are available online for this figure.
Figure EV5
Figure EV5. Colchicine blocks cell death mediated by the expression of p.S208C/M694V, p.S242R/M694V, or p.S208C/S242R/M694V variants
U937 cells bearing the indicated plasmids were treated at time 0 with doxycycline (Dox) in the presence or not as indicated of colchicine.
  1. A

    Propidium iodide (PI) influx/fluorescence was monitored every 15 min for 20 h.

  2. B

    Area under the curve (AUC) corresponding to Fig EV5A is shown.
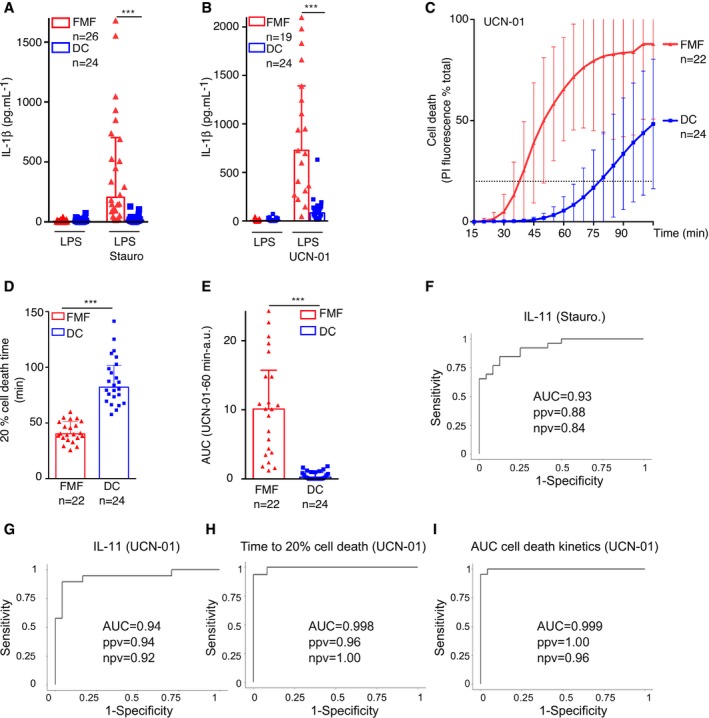
Data information: (A) Cell death was normalized using TX‐100‐treated cells. Each dot represents the mean ± SD of a biological triplicate from one experiment representative of three independent experiments. (B) The bar represents the mean ± SD of a biological triplicate from one experiment representative of three independent experiments. One‐way ANOVA with Sidak's multiple comparison test was performed to assess the effect of colchicine in each cell line. P‐values from left to right: **P = 0.0011; **P = 0.0079; ***P < 0.0001.
Figure 6
Figure 6. PKC inhibitor‐mediated inflammasome activation discriminates FMF patients from patients suffering from unrelated inflammatory conditions
Monocytes from FMF patients or from control diseases patients (DC) were either primed with LPS (A, B) or not (C–E) and treated with (A) 1.25 μM staurosporine (Stauro), (B, C–E) 12.5 μM UCN‐01.
  1. A, B

    IL‐1β level was quantified by ELISA at 90 min post‐stimulation.

  2. C–E

    Cell death was monitored in real time by measuring propidium iodide (PI) influx/fluorescence every 5 min. (D) The time required to obtain 20% of cell death and (E) the area under the kinetics curve (AUC) were computed for each patient.

  3. F–I

    Receiver operating characteristic (ROC) curves were computed for IL‐1β concentrations following (F) staurosporine or (G) UCN‐01 treatment, (H) the time to obtain 20% cell death, and (I) the area under the cell death kinetics curve. For each ROC curve, the AUC, the positive (ppv), and negative (npv) predictive values are indicated.

Data information: (A, B) Each symbol represents the mean value from three biological replicates for one patient. The bar represents the median ± interquartile range. (C) Each point of the curve corresponds to the average of the mean cell death values from three biological replicates of monocytes from the indicated number of patients. The dotted line indicates the 20% cell death value. (D–E) Each dot represents the value from one patient. The bar represents the median ± interquartile range. (A, B): ***P < 0.0001 by Wilcoxon rank‐sum test. (D, E) ***P < 0.0001 by unpaired t‐test. (A–E) Values from FMF patients are identical as the ones presented in Fig 1. The figures were not merged for clarity issues.Source data are available online for this figure.

References

    1. Benaoudia S, Martin A, Puig Gamez M, Gay G, Lagrange B, Cornut M, Krasnykov K, Claude J‐B, Bourgeois CF, Hughes S et al (2019) A genome‐wide screen identifies IRF2 as a key regulator of caspase‐4 in human cells. EMBO Rep 20: e48235 - PMC - PubMed
    1. Booty MG, Chae JJ, Masters SL, Remmers EF, Barham B, Le JM, Barron KS, Holland SM, Kastner DL, Aksentijevich I (2009) Familial Mediterranean fever with a single MEFV mutation: where is the second hit? Arthritis Rheum 60: 1851–1861 - PMC - PubMed
    1. Brinkman EK, Chen T, Amendola M, van Steensel B (2014) Easy quantitative assessment of genome editing by sequence trace decomposition. Nucleic Acids Res 42: e168 - PMC - PubMed
    1. Case CL, Roy CR (2011) Asc modulates the function of NLRC4 in response to infection of macrophages by Legionella pneumophila. mBio 2: e00117‐11 - PMC - PubMed
    1. Chae JJ, Wood G, Richard K, Jaffe H, Colburn NT, Masters SL, Gumucio DL, Shoham NG, Kastner DL (2008) The familial Mediterranean fever protein, pyrin, is cleaved by caspase‐1 and activates NF‐kappaB through its N‐terminal fragment. Blood 112: 1794–1803 - PMC - PubMed

Publication types