. 2019 Oct 21;58(20):14085-14106.
doi: 10.1021/acs.inorgchem.9b02111. Epub 2019 Oct 7.

A Heme Propionate Staples the Structure of Cytochrome c for Methionine Ligation to the Heme Iron

Affiliations

A Heme Propionate Staples the Structure of Cytochrome c for Methionine Ligation to the Heme Iron

Yunling Deng et al. Inorg Chem. .

Abstract

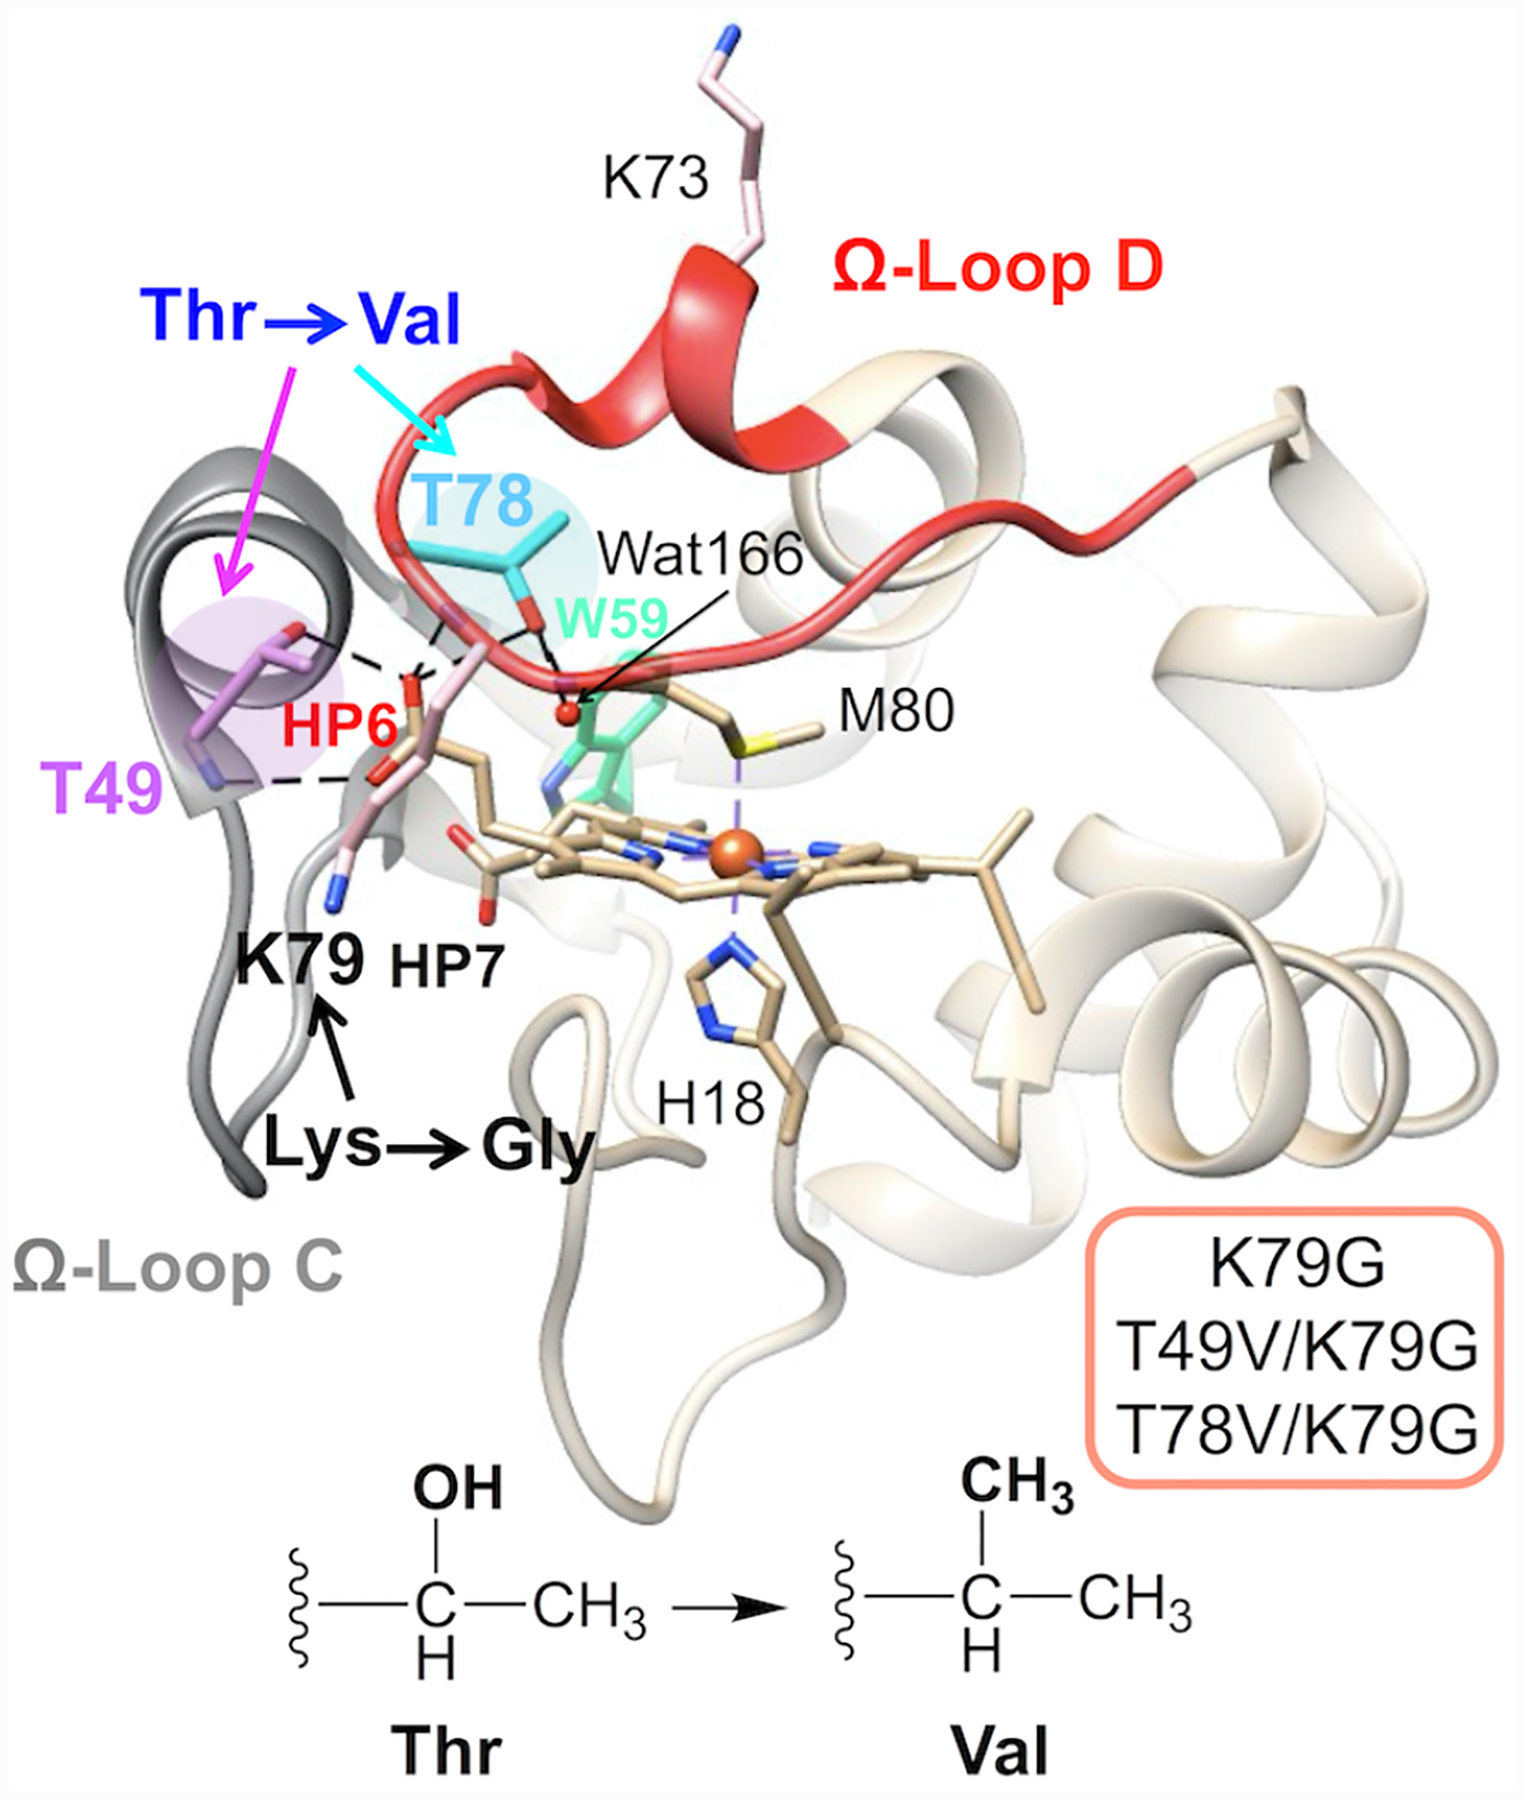
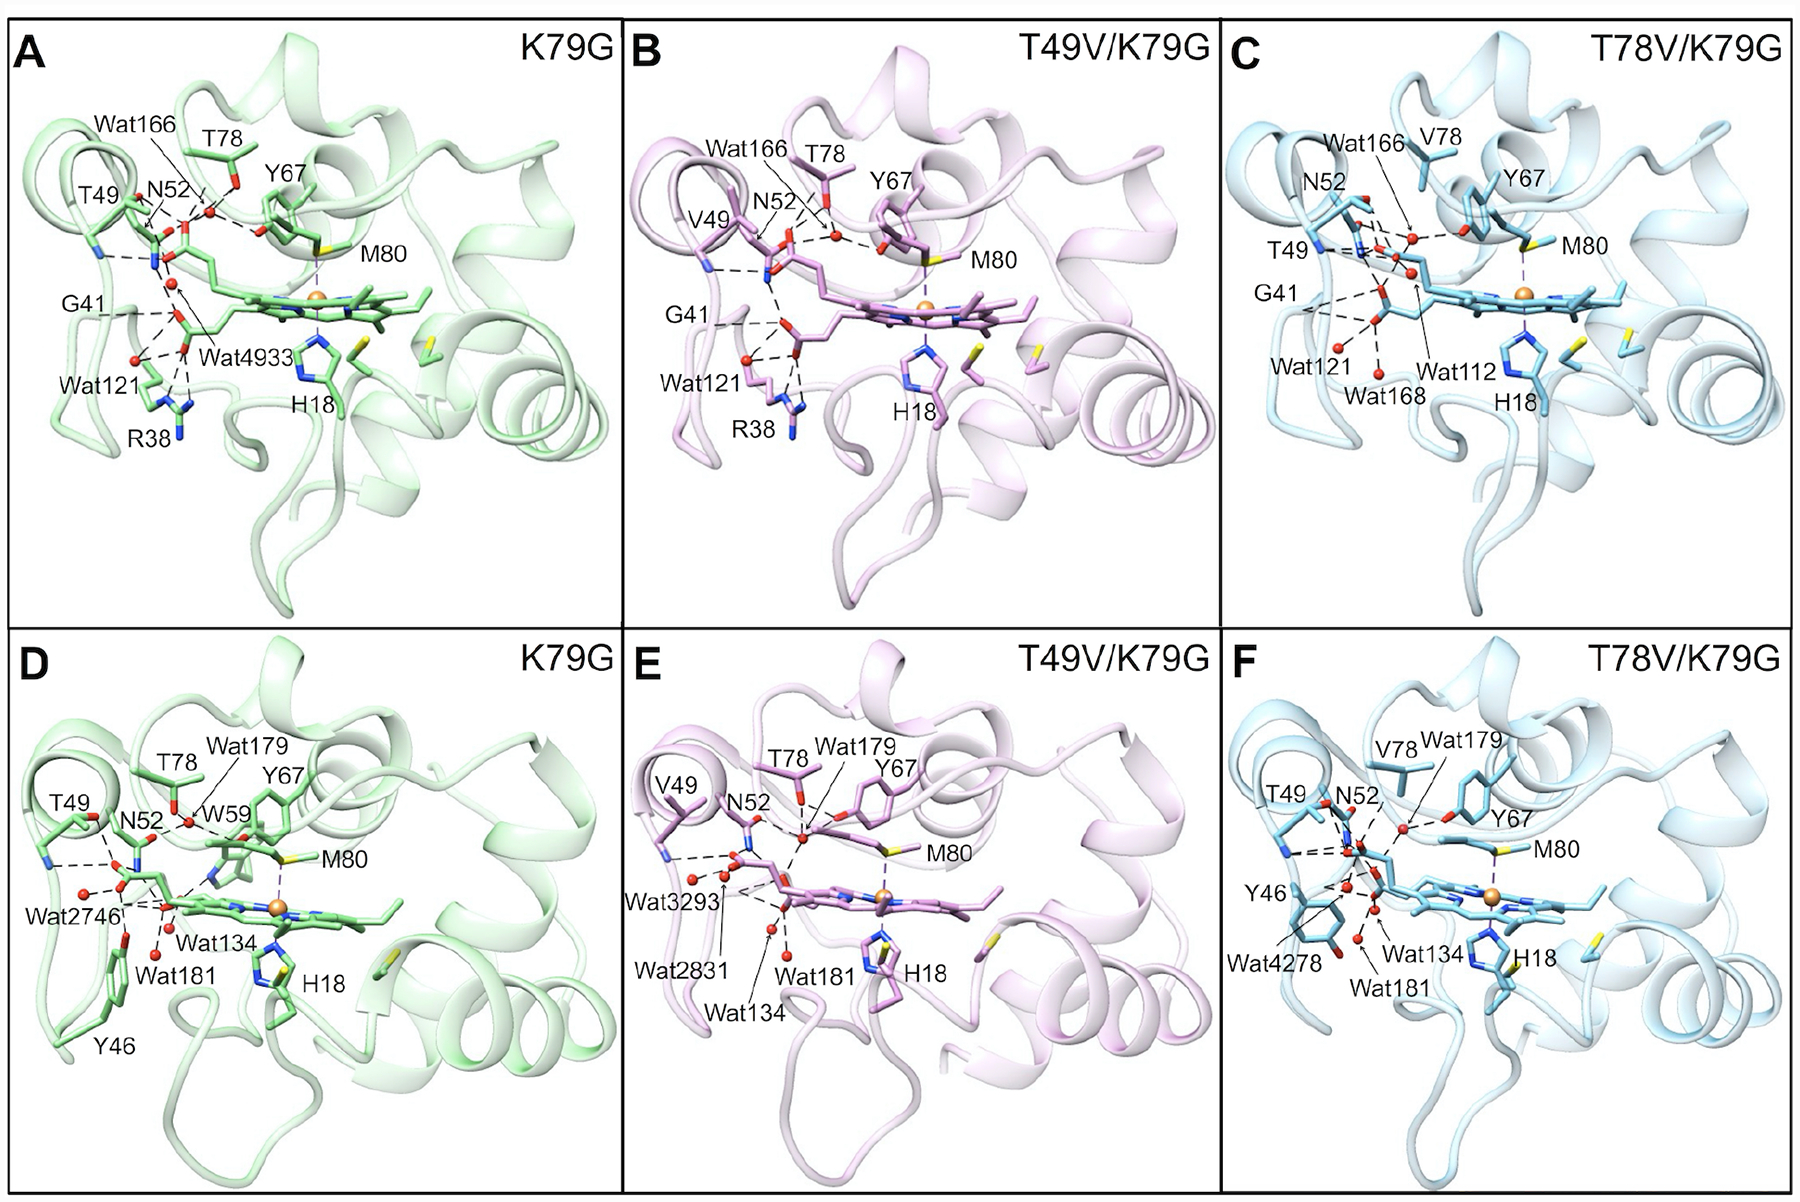
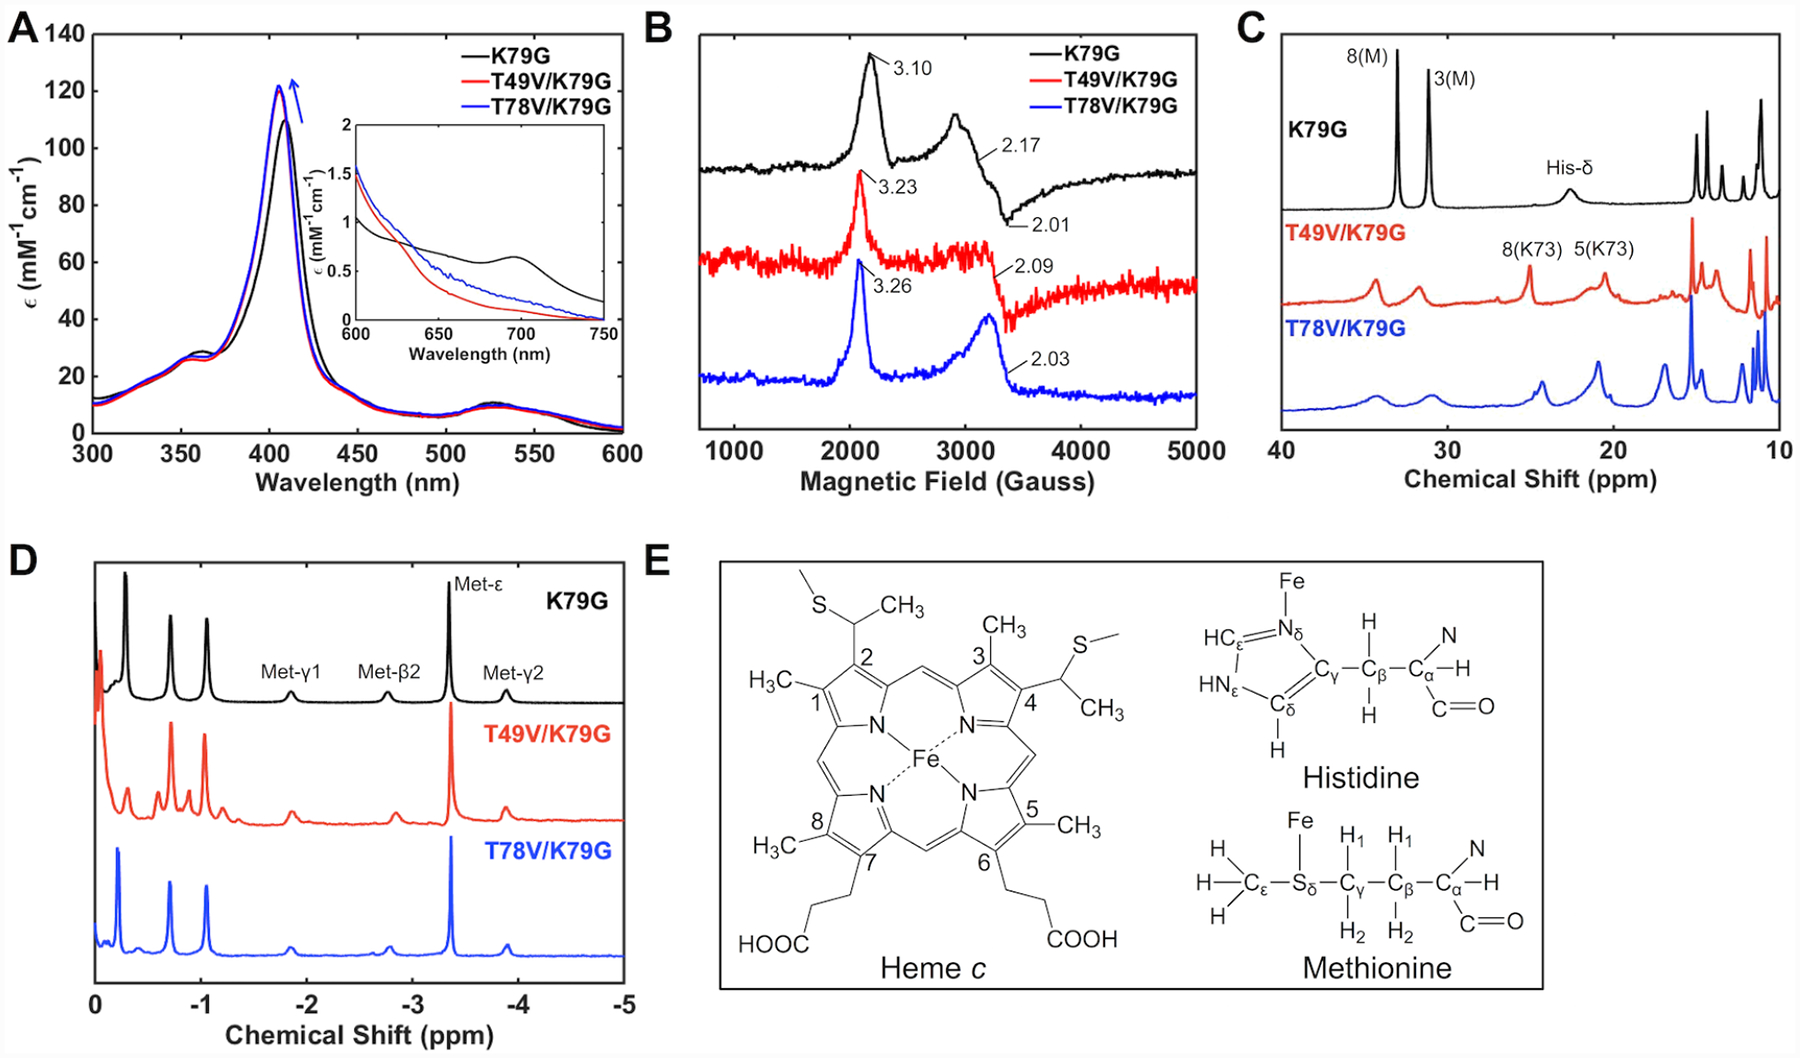
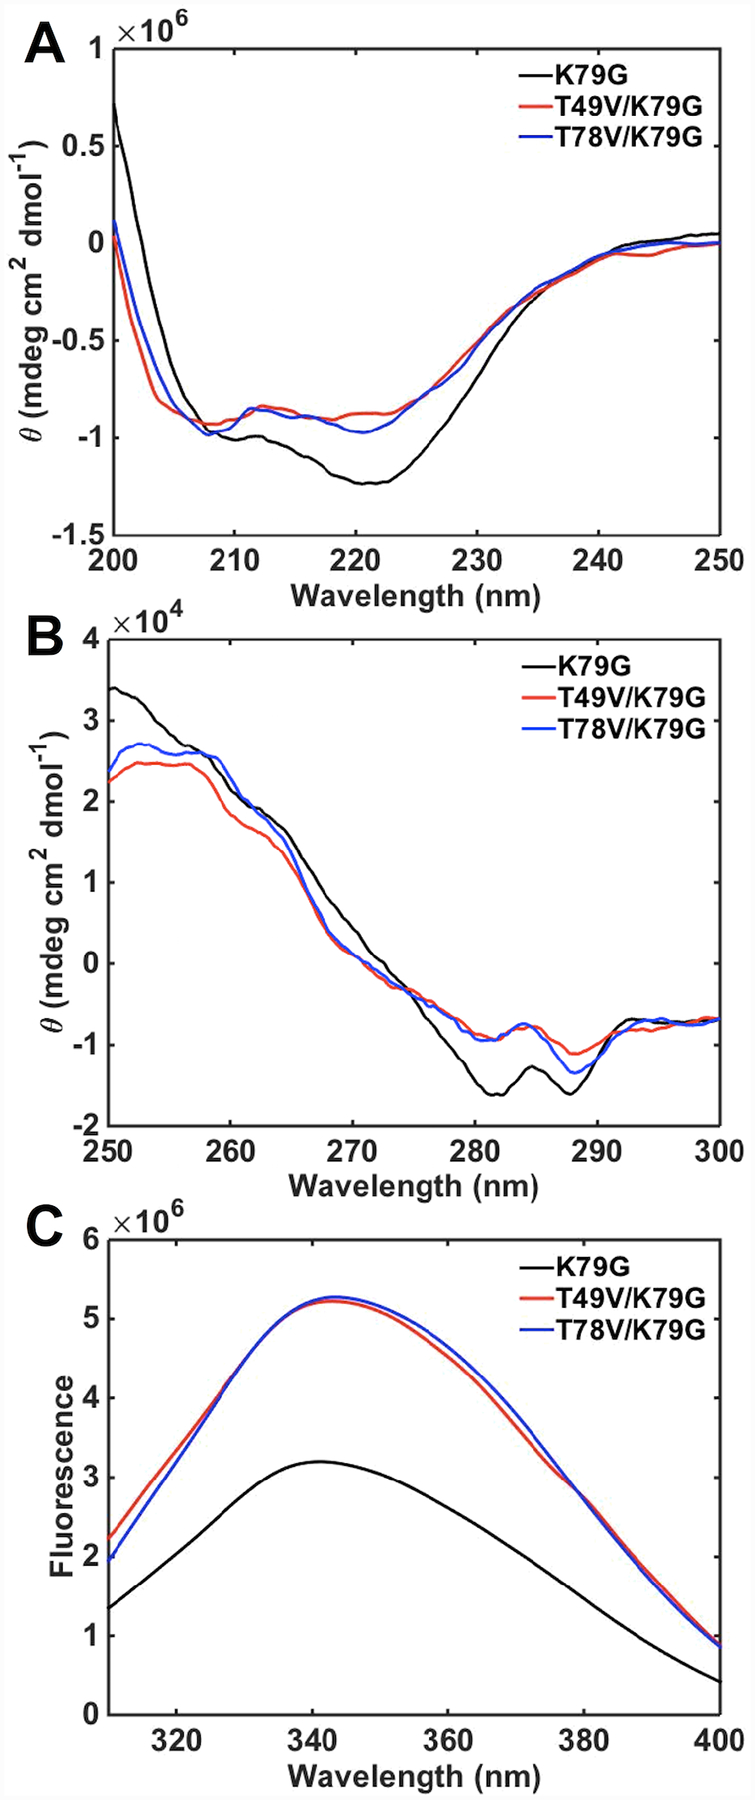
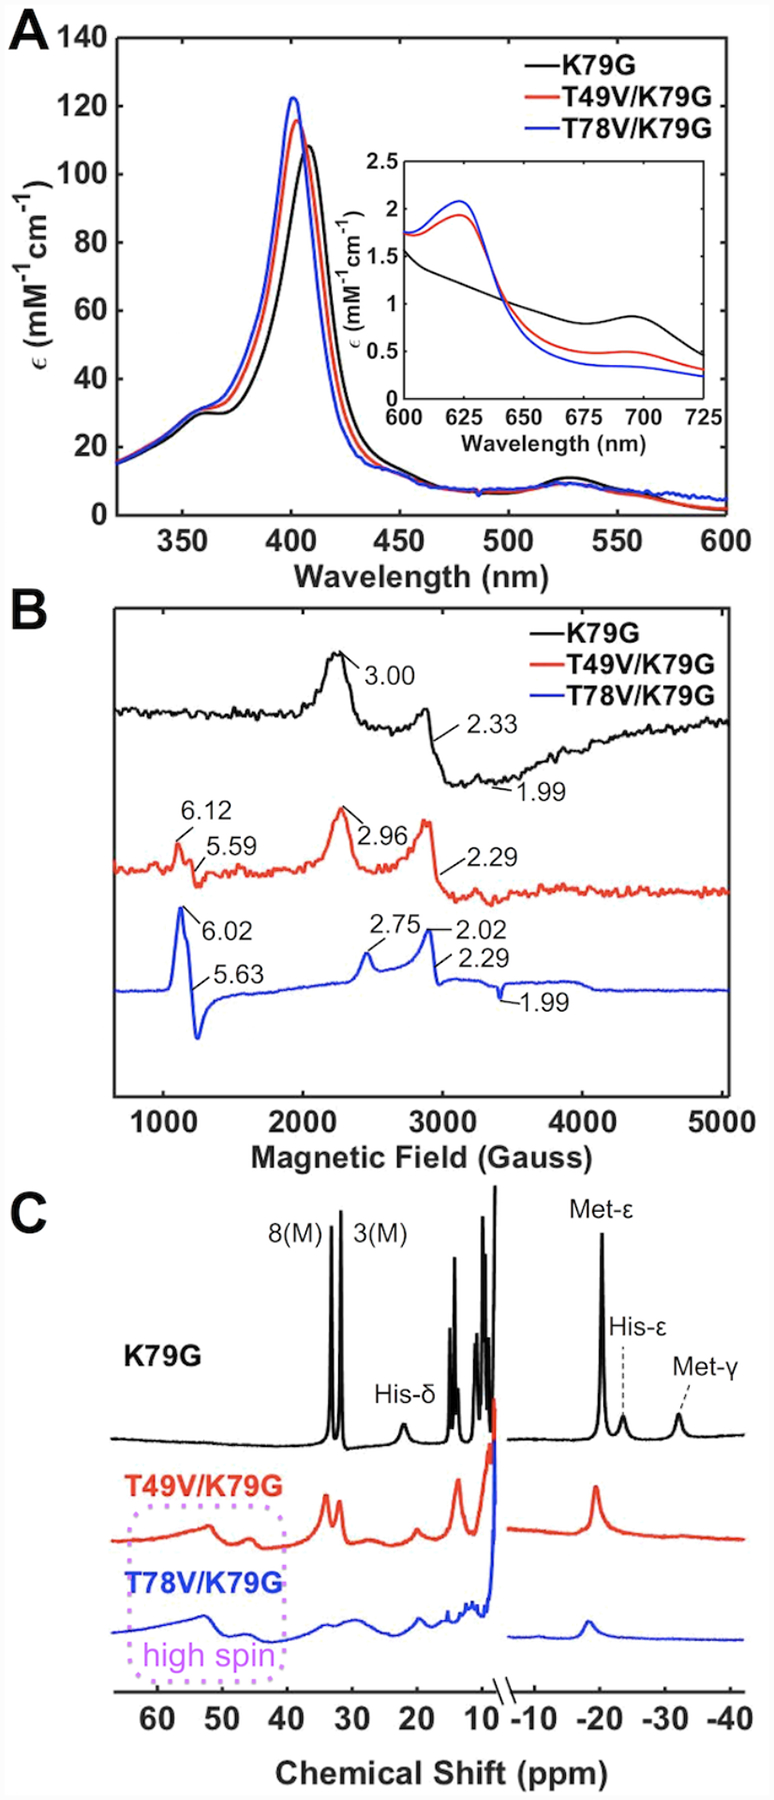
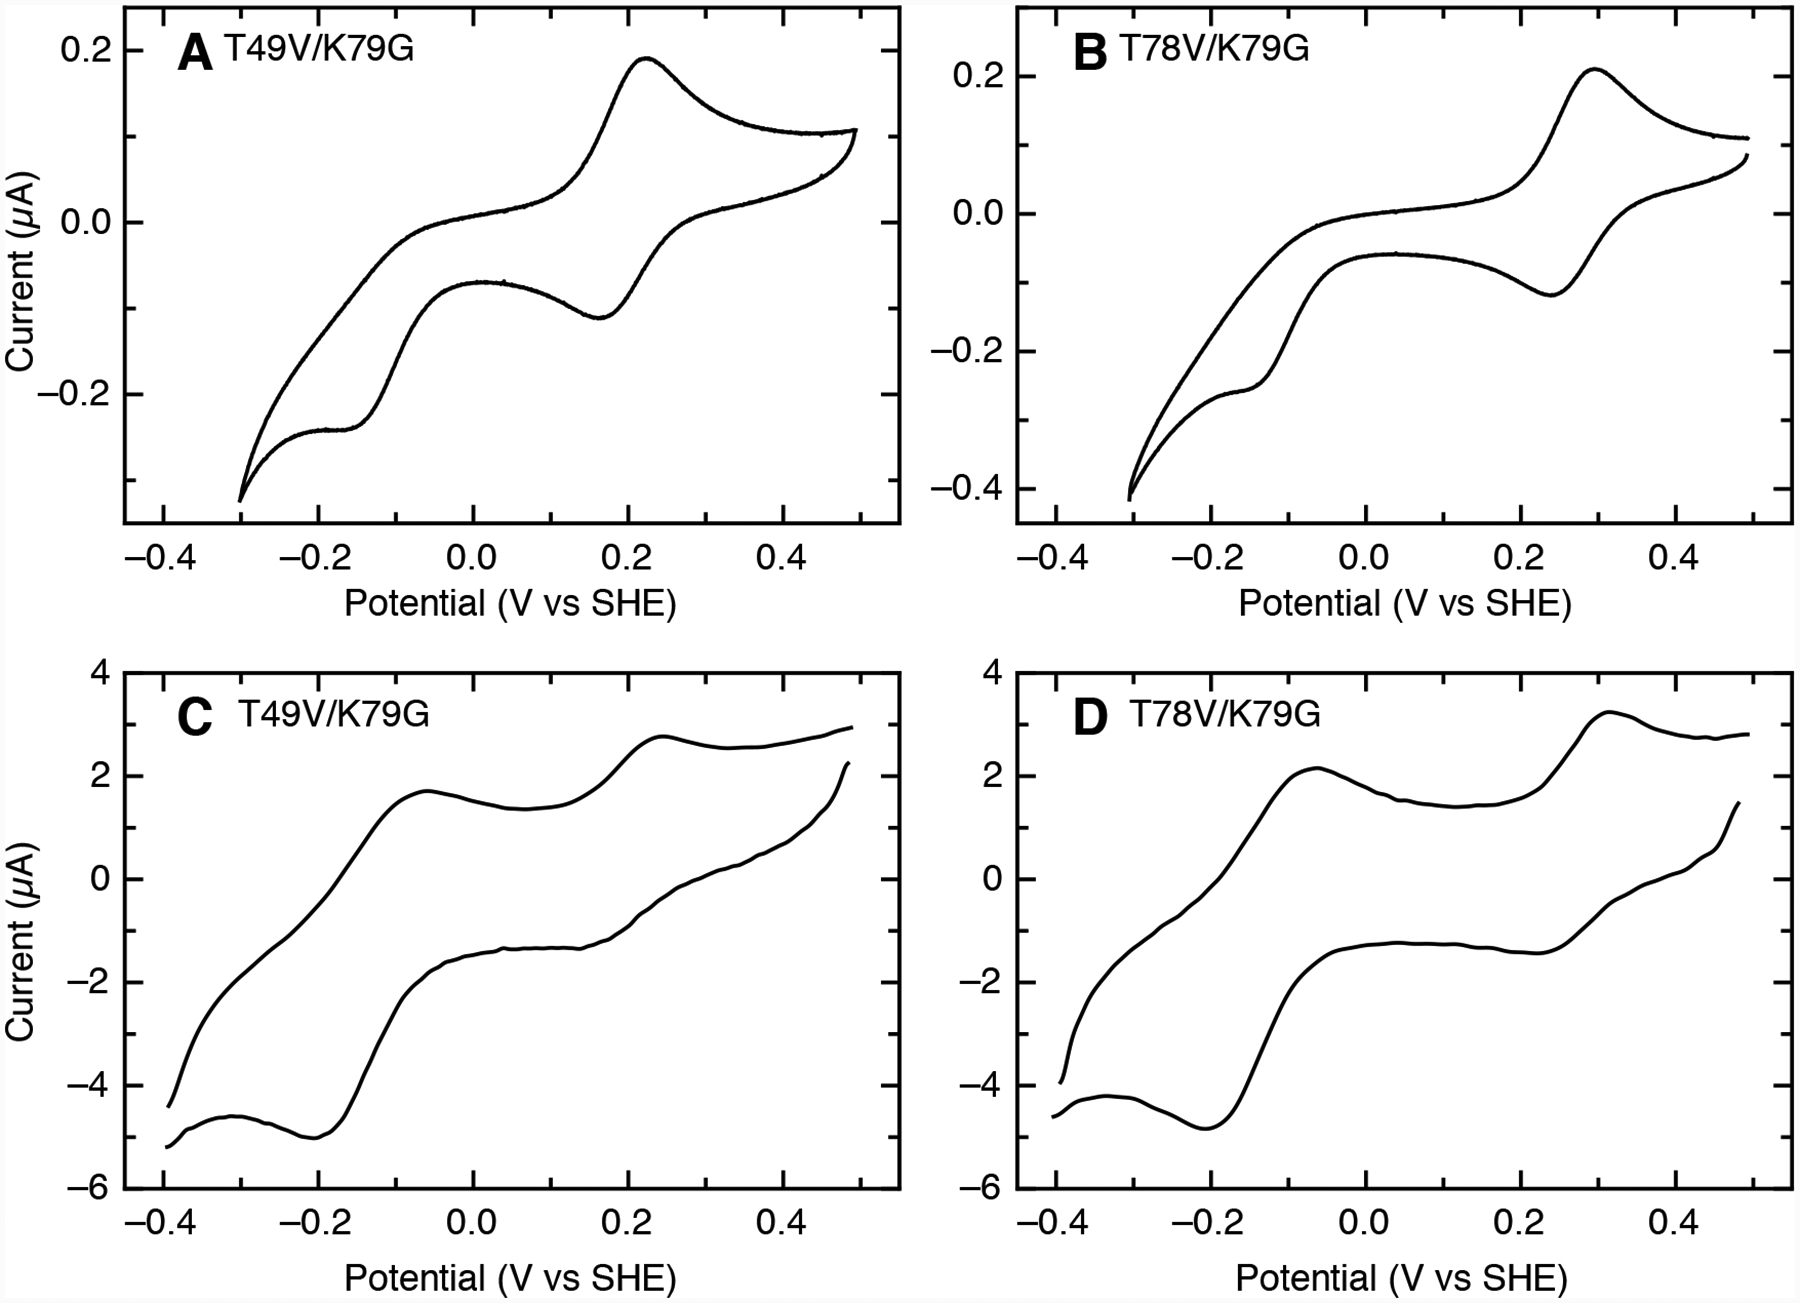
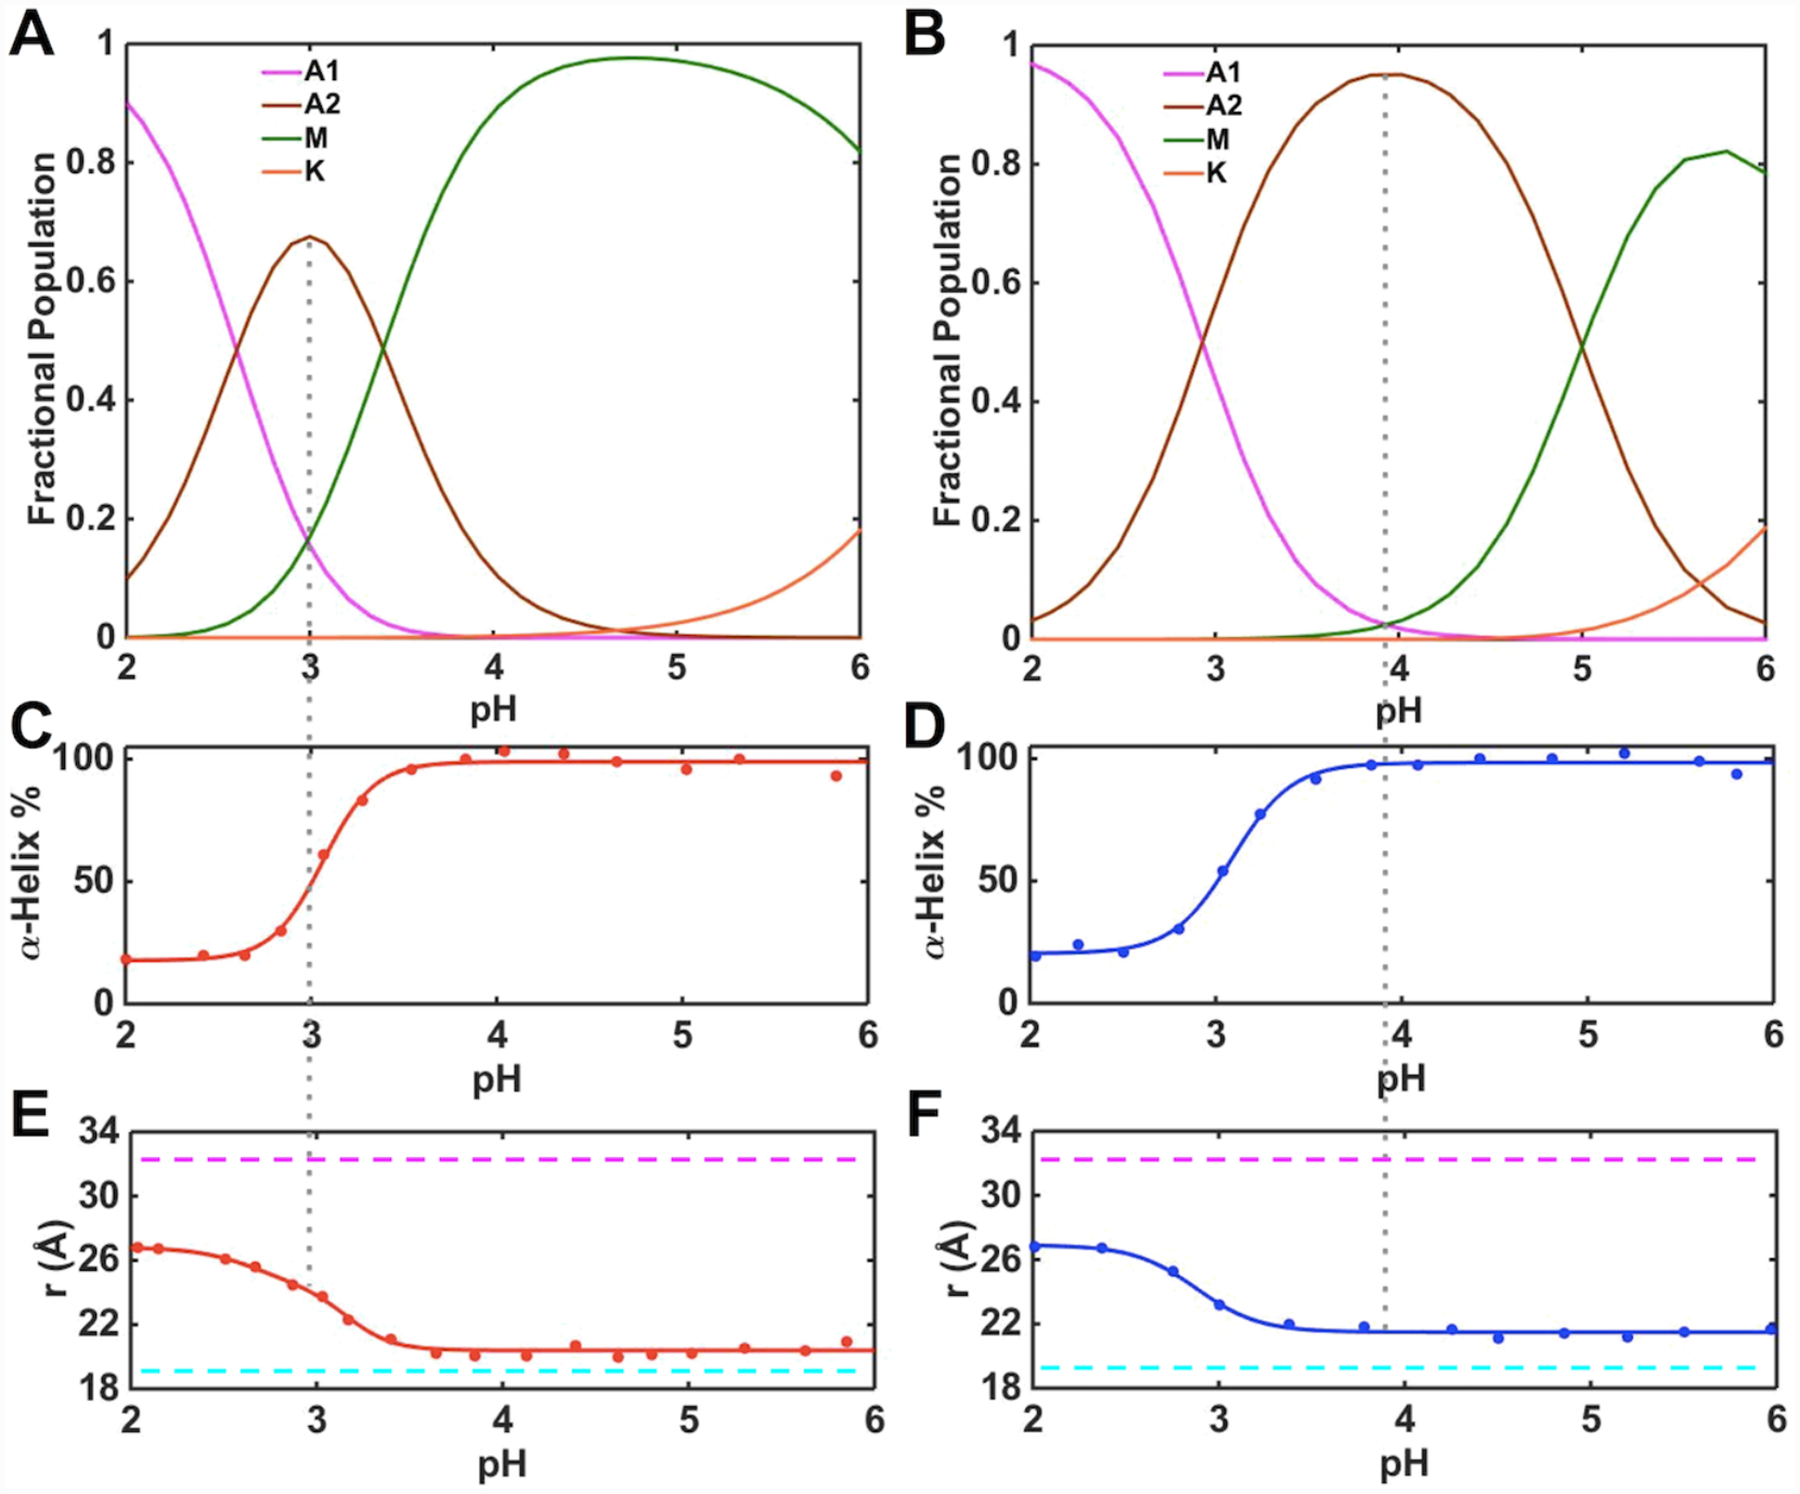
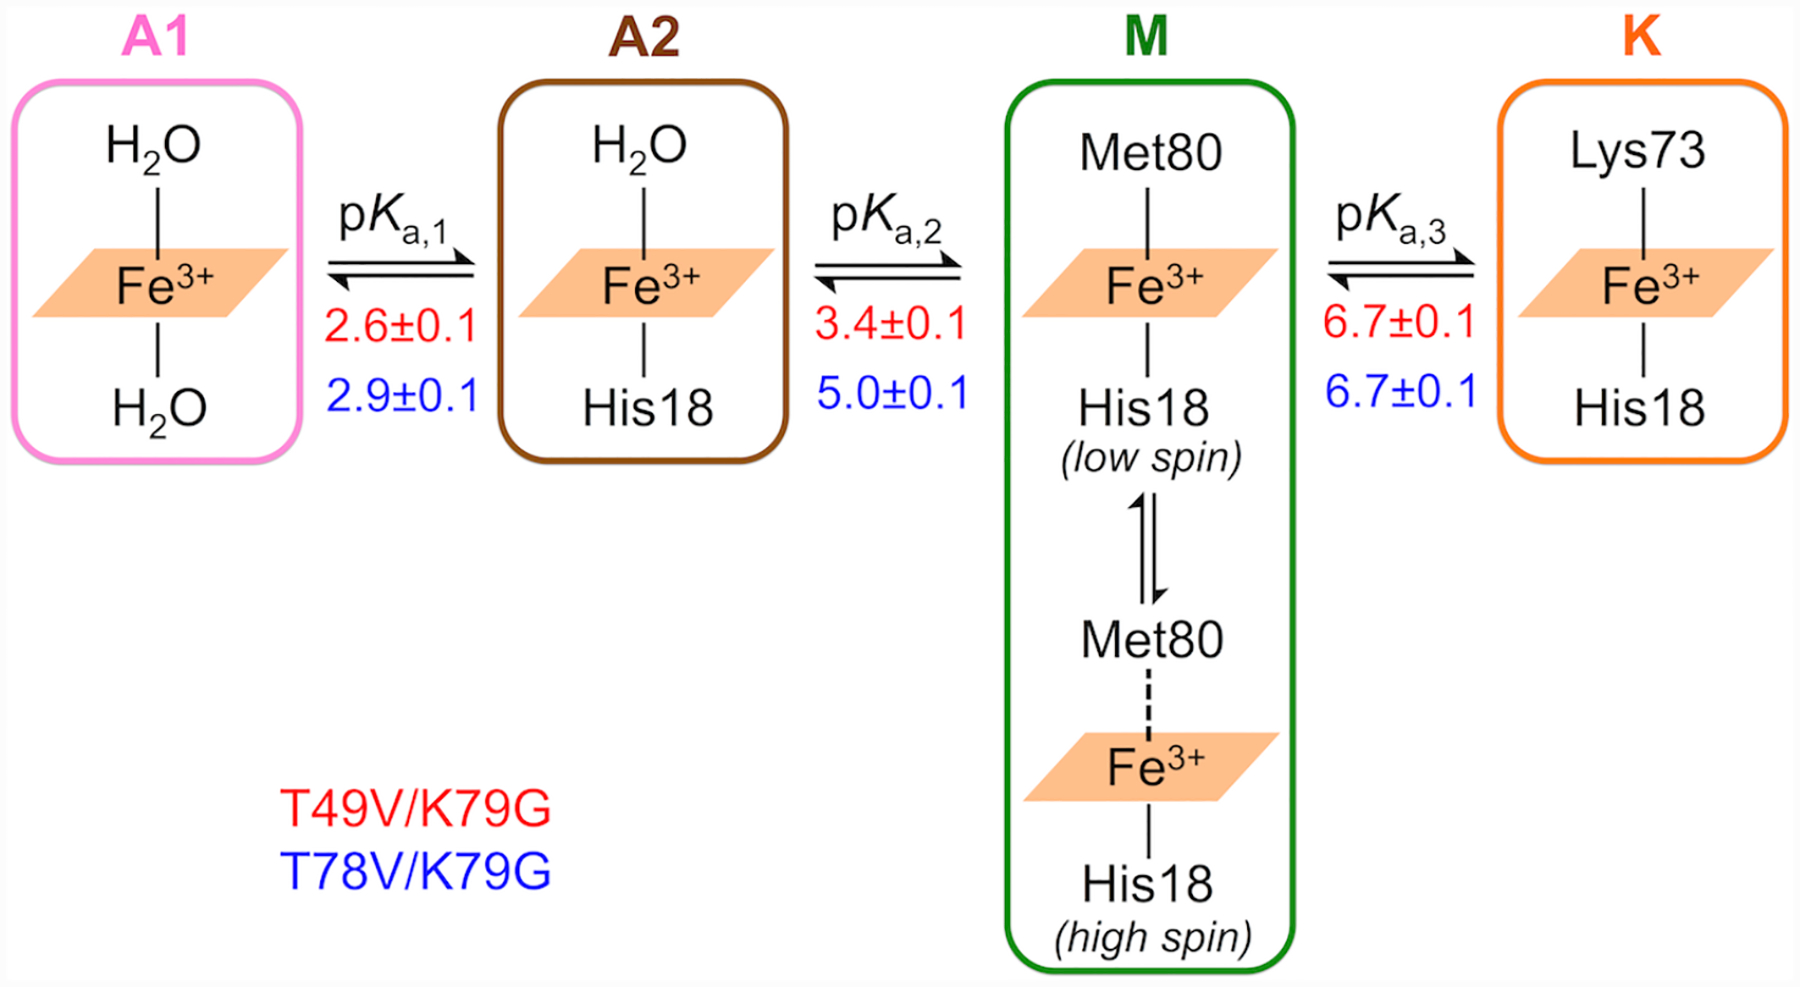
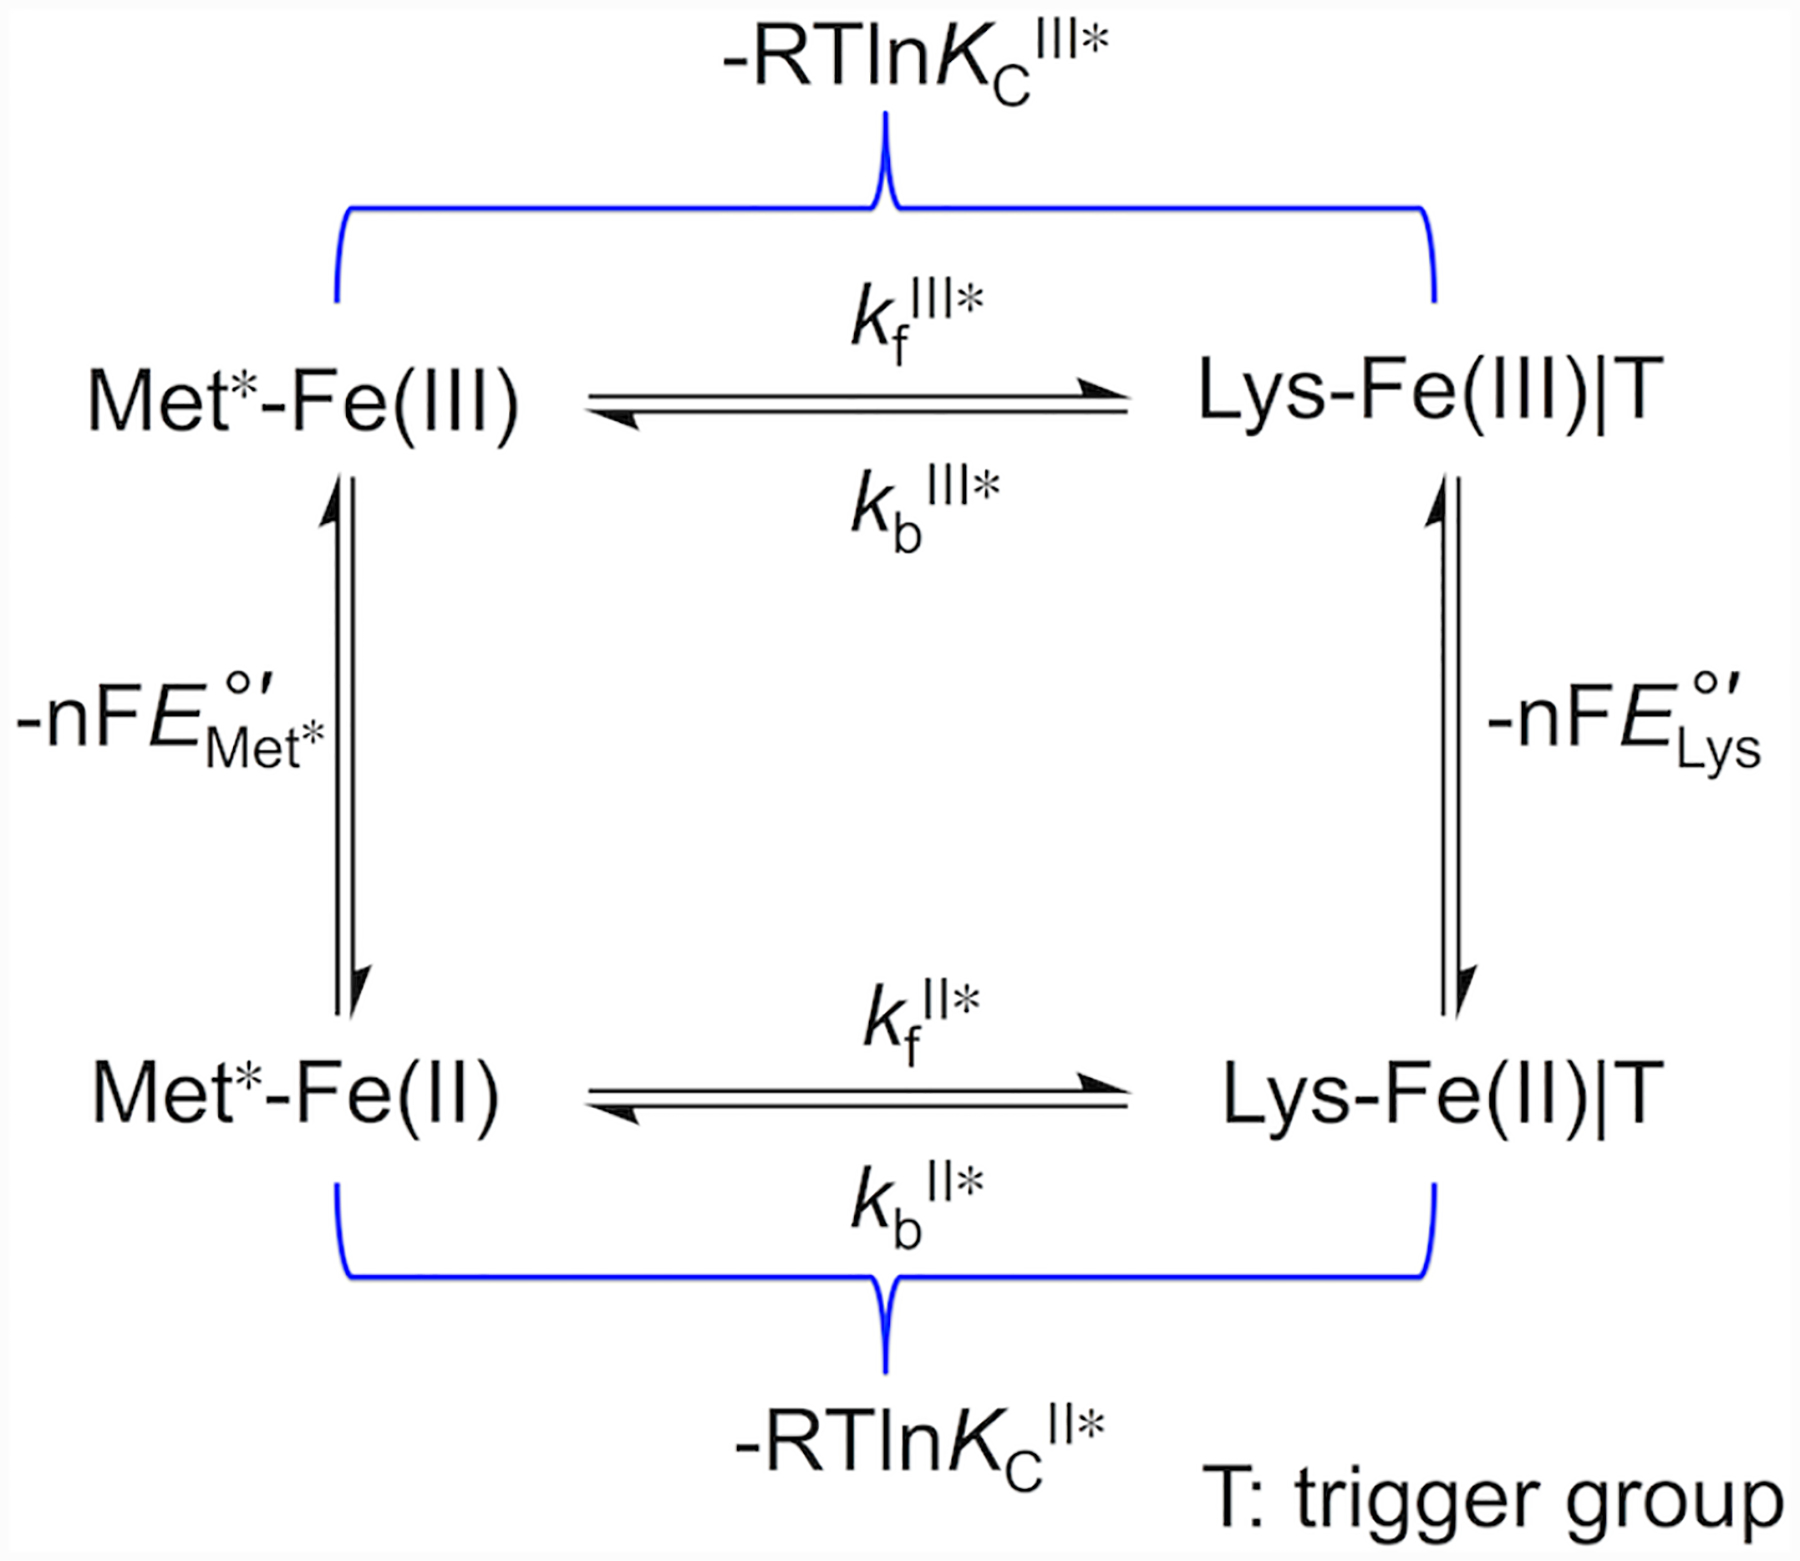
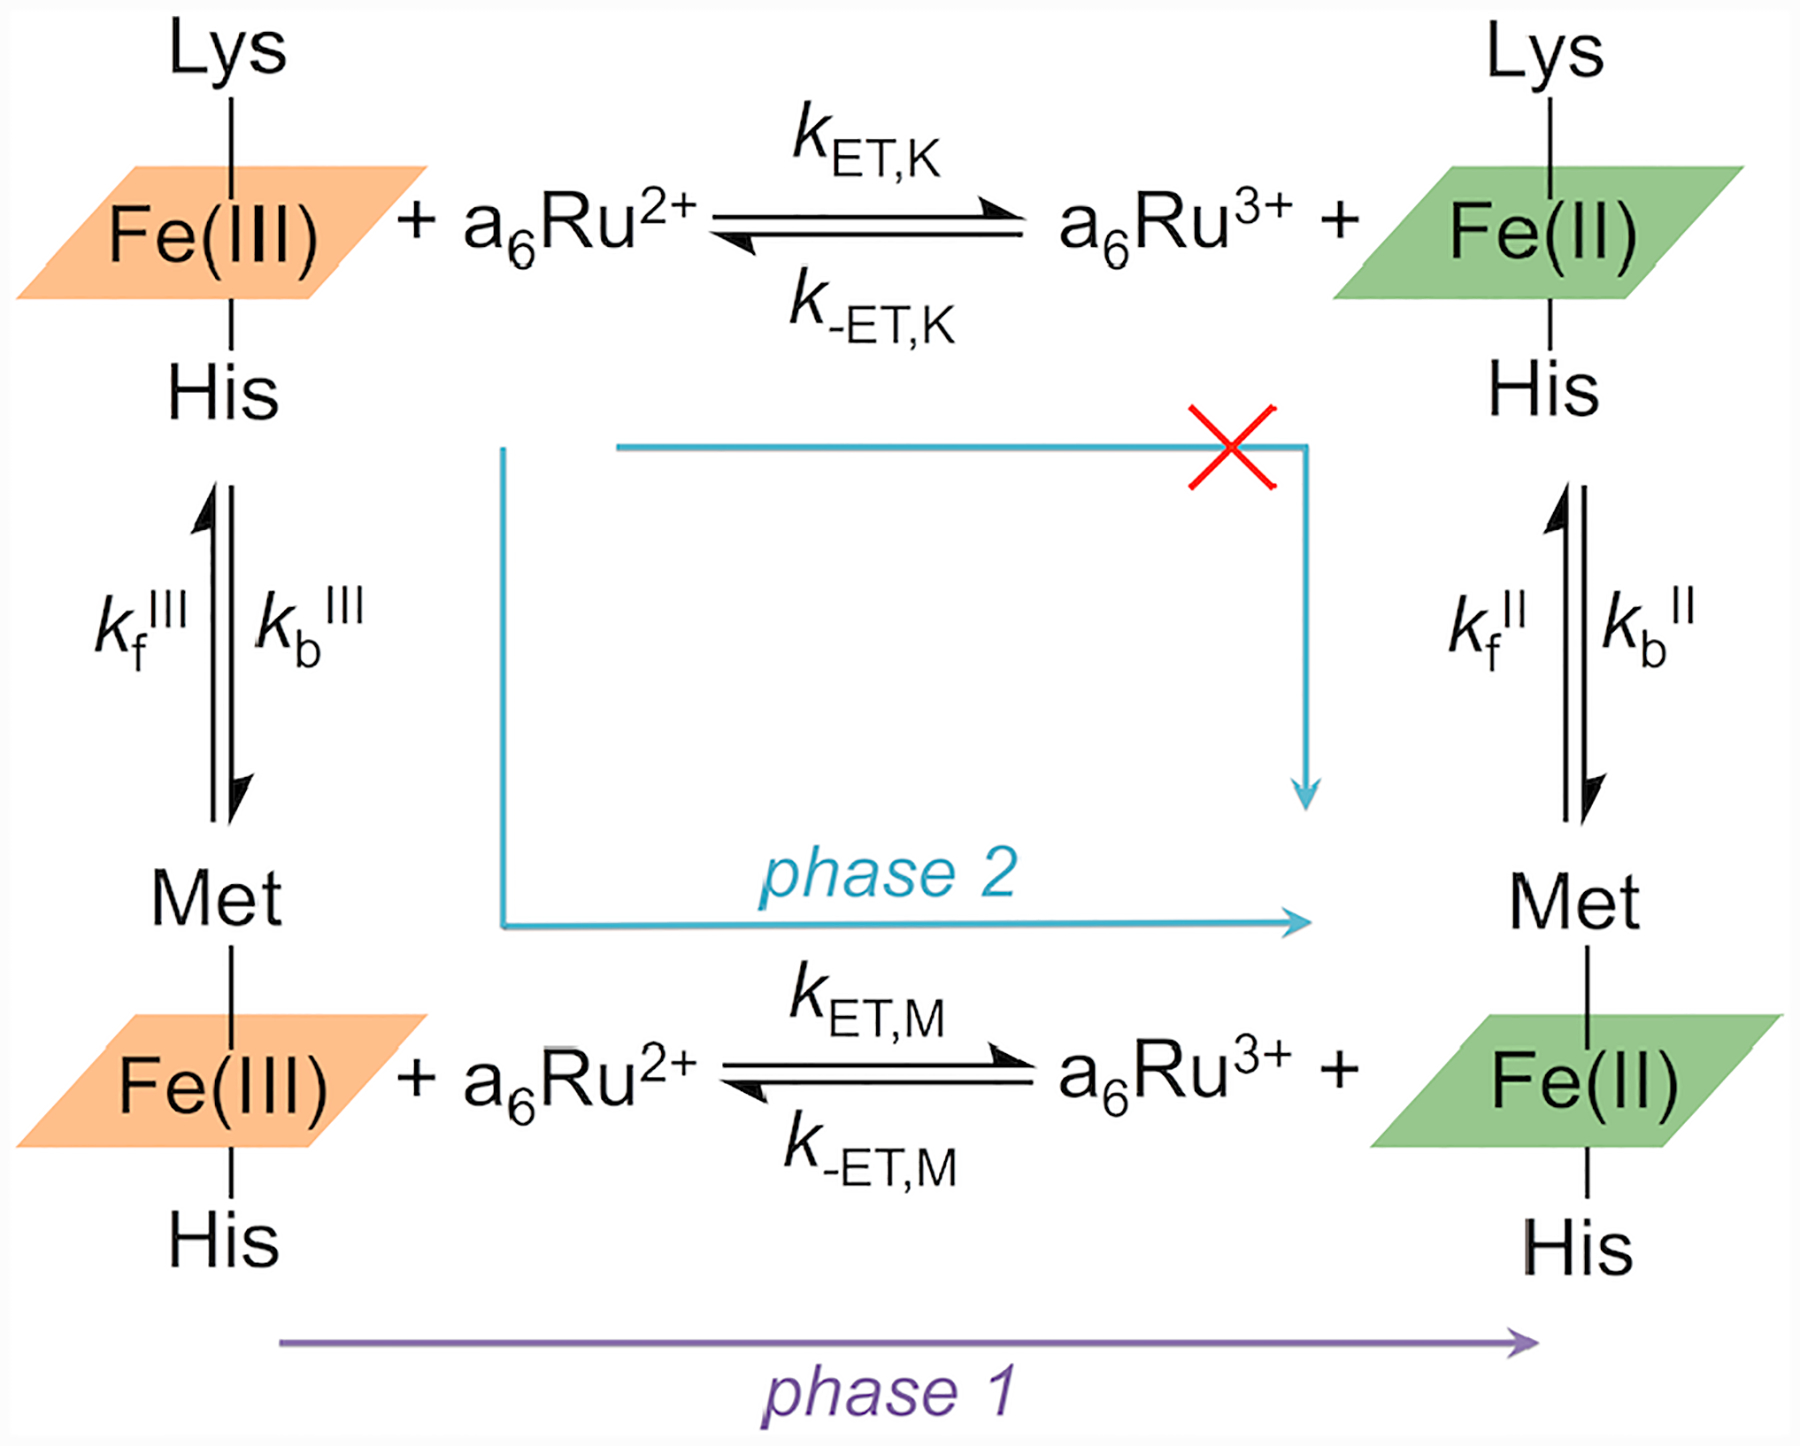
Ligand-switch reactions at the heme iron are common in biological systems, but their mechanisms and the features of the polypeptide fold that support dual ligation are not well understood. In cytochrome c (cyt c), two low-stability loops (Ω-loop C and Ω-loop D) are connected by the heme propionate HP6. At alkaline pH, the native Met80 ligand from Ω-loop D switches to a Lys residue from the same loop. Deprotonation of an as yet unknown group triggers the alkaline transition. We have created the two cyt c variants T49V/K79G and T78V/K79G with altered connections of these two loops to HP6. Electronic absorption, NMR, and EPR studies demonstrate that at pH 7.4 ferric forms of these variants are Lys-ligated, whereas ferrous forms maintain the native Met80 ligation. Measurements of protein stability, cyclic voltammetry, pH-jump and gated electron-transfer kinetics have revealed that these Thr to Val substitutions greatly affect the alkaline transition in both ferric and ferrous proteins. The substitutions modify the stability of the Met-ligated species and reduction potentials of the heme iron. The kinetics of ligand-switch processes are also altered, and analyses of these effects implicate redox-dependent differences in metal-ligand interactions and the role of the protein dynamics, including cross-talk between the two Ω-loops. With the two destabilized variants, it is possible to map energy levels for the Met- and Lys-ligated species in both ferric and ferrous proteins and assess the role of the protein scaffold in redox-dependent preferences for these two ligands. The estimated shift in the heme iron reduction potential upon deprotonation of the "trigger" group is consistent with those associated with deprotonation of an HP, suggesting that HP6, on its own or as a part of a hydrogen-bonded cluster, is a likely "trigger" for the Met to Lys ligand switch.


Figures

Figure 1.
Figure 1.
Structure of yeast iso-1 cyt c (PDB: 2YCC, ref. ). The highlighted residues, Thr49 (magenta) and Thr78 (cyan), are involved in the intraprotein hydrogen-bonding network, as indicated by the dashed lines. The two Ω-loops are shown in gray (Ω-loop C, residues 40–57, nested-yellow foldon) and red (Ω-loop D, residues 71–85, red foldon).
Figure 2.
Figure 2.
Averaged structural models of Met80-ligated (A–C) ferric and (D–F) ferrous (A, D) K79G, (B, E) T49V/K79G, and (C, F) T78V/K79G. Water molecules are represented by red spheres and the heme iron is represented by an orange sphere. All variants contain K72A/C102S background mutations. Hydrogen-bonding networks in the proximity of the two propionate groups are displayed by dashed lines in all the models.
Figure 3.
Figure 3.
Spectra of K79G (black), T49V/K79G (red), and T78V/K79G (blue) at pH 7.4. (A) Electronic absorption spectra of ferric proteins at 22 ± 2 °C. The arrow indicates a shift in the position of the Soret band. The inset is the comparison of charge-transfer bands at 695 nm. (B) EPR spectra of ferric proteins at 10 K. 1H NMR spectra of (C) ferric and (D) ferrous proteins at pD (pH) 7.4 and 25 °C. (E) Structures of heme, Met, and His showing the labeling nomenclature. Numbered peaks correspond to protons of heme methyl groups, with the identity of the axial ligand (M = Met, K = Lys) in parentheses.
Figure 4.
Figure 4.
(A) Far- and (B) near-UV CD spectra and (C) Trp59 fluorescence spectra of ferric K79G (black), T49V/K79G (red), and T78V/K79G (blue) in a 100 mM sodium phosphate buffer at pH 7.4 and 22 ± 2 °C.
Figure 5.
Figure 5.
Spectra of ferric K79G (black), T49V/K79G (red), and T78V/K79G (blue) at pH 4.5. (A) Electronic absorption spectra of ferric proteins at 22 ± 2 °C. The inset is the comparison of charge-transfer bands at 695 nm. (B) EPR spectra of ferric proteins at 10 K (C) 1H NMR spectra of ferric proteins at pD 4.5. The labeling nomenclature is the same as in Figure 3.
Figure 6.
Figure 6.
Cyclic voltammograms at (A, B) 0.1 V/s and (C, D) 20 V/s for (A, C) T49V/K79G and (B, D) T78V/K79G at pH 7.4 (100 μM samples in 0.1 M sodium phosphate). Background capacitative currents were subtracted in each direction, and voltammograms at 20 V/s were treated with a fast Fourier transform noise filter.
Figure 7.
Figure 7.
Changes in the heme iron ligation and properties of the polypeptide fold in ferric (A, C, E) T49V/K79G and (B, D, F) T78V/K79G in the pH range from 2 to 6. (A, B) Fractional populations of differently-ligated heme iron species. (C, D) Percentage of the α-helical content relative to that at pH 6.0. (E, F) Distances between Trp59 and heme calculated from the fluorescence data. The magenta and cyan dashed lines indicate the distance between Trp59 and heme in fully unfolded (33 Å) and fully folded (18.8 Å) K79G, respectively. The gray dashed line represents the pH condition under which the A2 state is most populated.
Figure 8.
Figure 8.
pH-dependent changes in the ligation to ferric heme iron based on the SVD analyses. The apparent pKa values for each transition (Tables 1 and S7) in T49V/K79G (in red) and T78V/K79G (in blue) are listed under the equilibrium arrows.
Figure 9.
Figure 9.
Plots of kobspH versus proton concentration for ferric T49V/K79G (top) and T78V/K79G (bottom) variants. The curves are fits of the data to eq 6 with parameters listed in Table 1.
Figure 10.
Figure 10.
The dependence of (A) kobs,1ET and (B) kobs,2ET on a6Ru2+ concentration for ET reactions of K79G (black), T49V/K79G (red) and T78V/K79G (blue) in a 10 mM sodium phosphate buffer at pH 7.0 containing 0.1 M NaCl. The solid curves are fits of the kobs,1ET dependencies to kobs,1ET=kET,M[a6Ru2+]. The dashed lines display the average of all the kobs,2ET values for each variant.
Figure 11.
Figure 11.
(A) Energy diagram for the alkaline transition in ferric and ferrous K79G, T49V/K79G, and T78V/K79G at pH 7.4. The asterisk-labeled energy level and kfII value for K79G are calculated based on the assumption pKHII = pKHIII + 2. (B, C) The dependencies of the rate constants kf and kb on energies of the corresponding ground states in (B) ferric and (C) ferrous K79G, T49V/K79G, and T78V/K79G.
Scheme 1
Scheme 1
Scheme 2
Scheme 2
Scheme 3
Scheme 3

Similar articles

Cited by

References

    1. Biological Inorganic Chemistry: Structure and Reactivity; Bertini I; Gray HB; Stiefel EI; Valentine JS, Eds.; University Science Books: Sausalito, CA, 2007.
    1. Mao J; Hauser K; Gunner MR How cytochromes with different folds control heme redox potentials. Biochemistry 2003, 42, 9829–9840. - PubMed
    1. Hunter CL; Lloyd E; Eltis LD; Rafferty SP; Lee H; Smith M; Mauk AG Role of the heme propionates in the interaction of heme with apomyoglobin and apocytochrome b5. Biochemistry 1997, 36, 1010–1017. - PubMed
    1. Xu C; Ibrahim M; Spiro TG DFT analysis of axial and equatorial effects on heme-CO vibrational modes: applications to CooA and H-NOX heme sensor proteins. Biochemistry 2008, 47, 2379–2387. - PMC - PubMed
    1. Louro RO; Bento I; Matias PM; Catarino T; Baptista AM; Soares CM; Carrondo MA; Turner DL; Xavier AV Conformational component in the coupled transfer of multiple electrons and protons in a monomeric tetraheme cytochrome. J. Biol. Chem 2001, 276, 44044–44051. - PubMed