. 2020 Jan 15:205:116231.
doi: 10.1016/j.neuroimage.2019.116231. Epub 2019 Oct 4.

Model-based physiological noise removal in fast fMRI

Affiliations

Model-based physiological noise removal in fast fMRI

Uday Agrawal et al. Neuroimage. .

Abstract

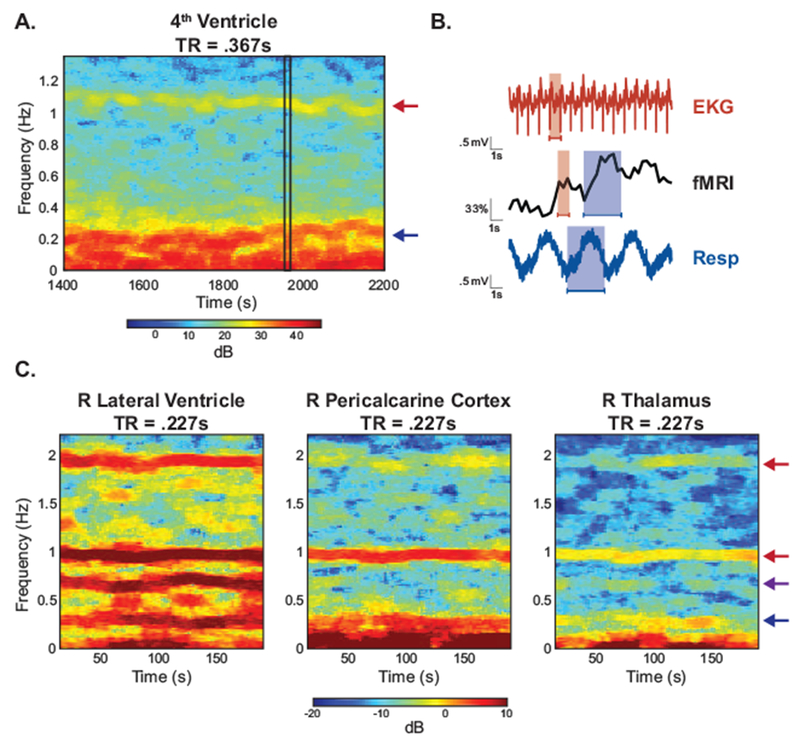
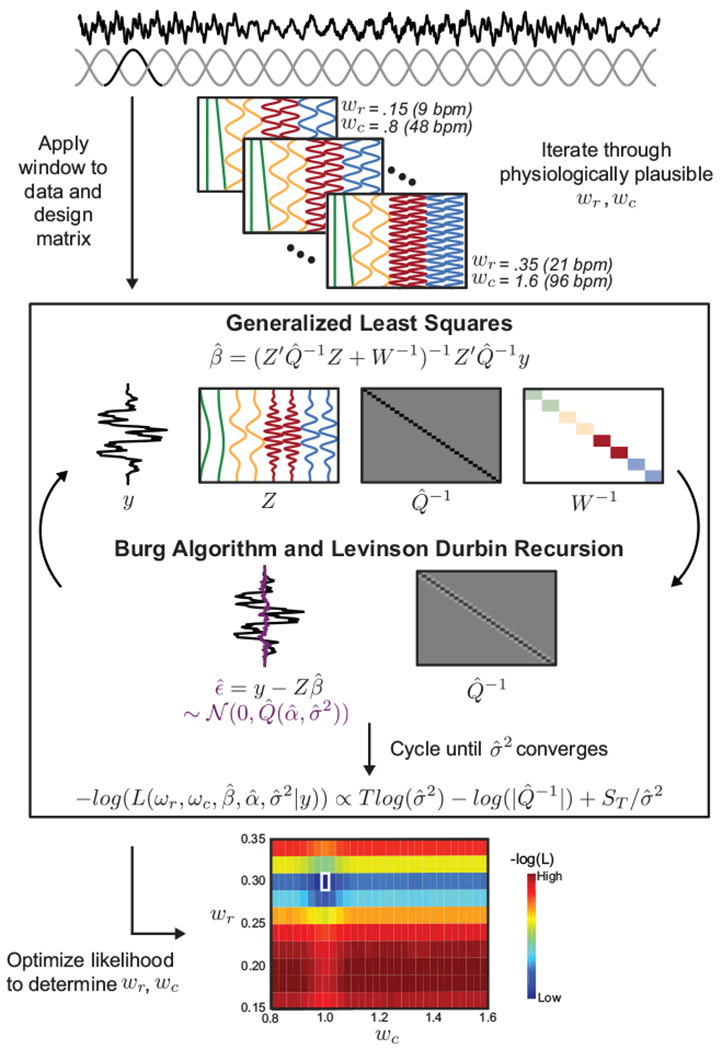
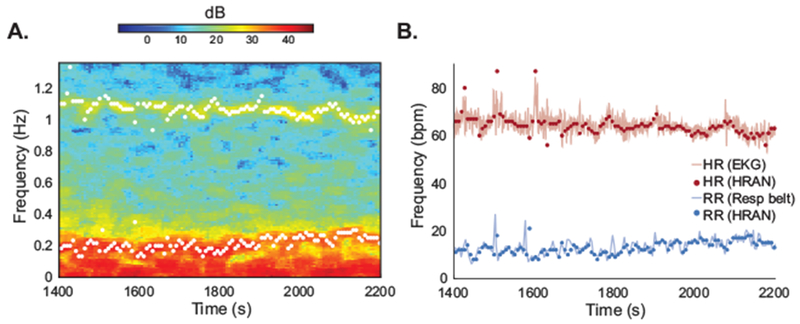
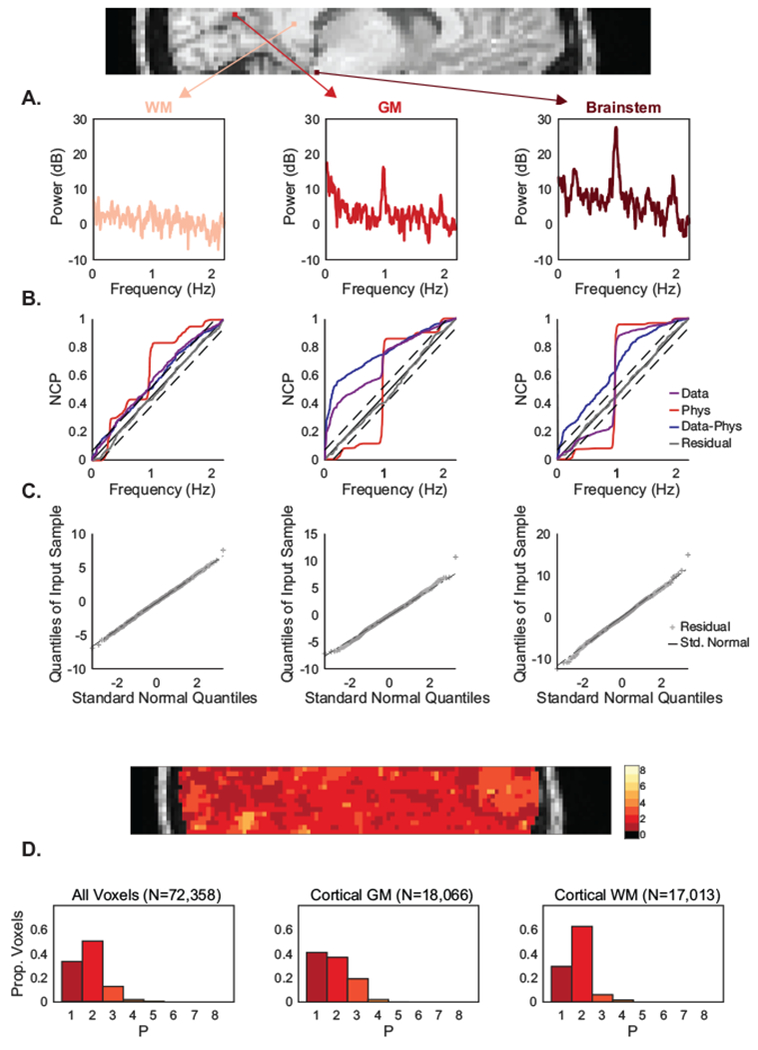
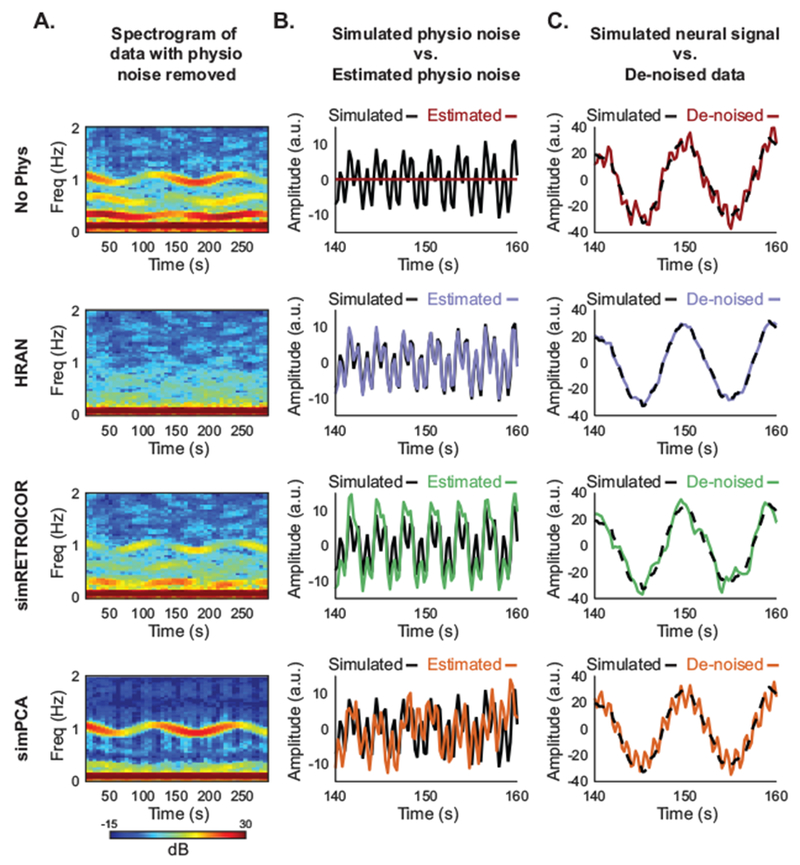
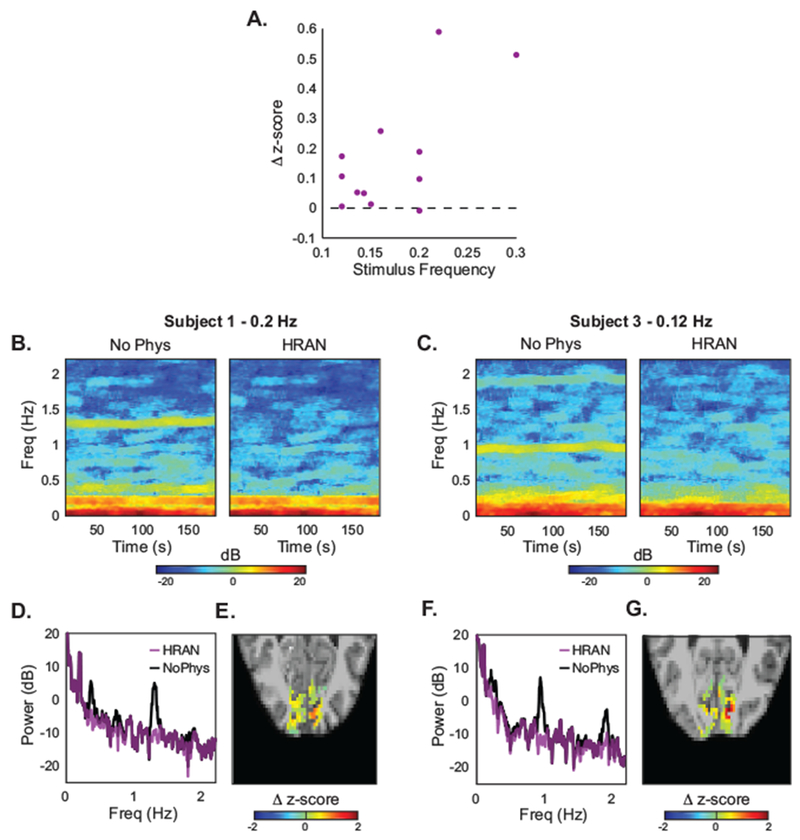
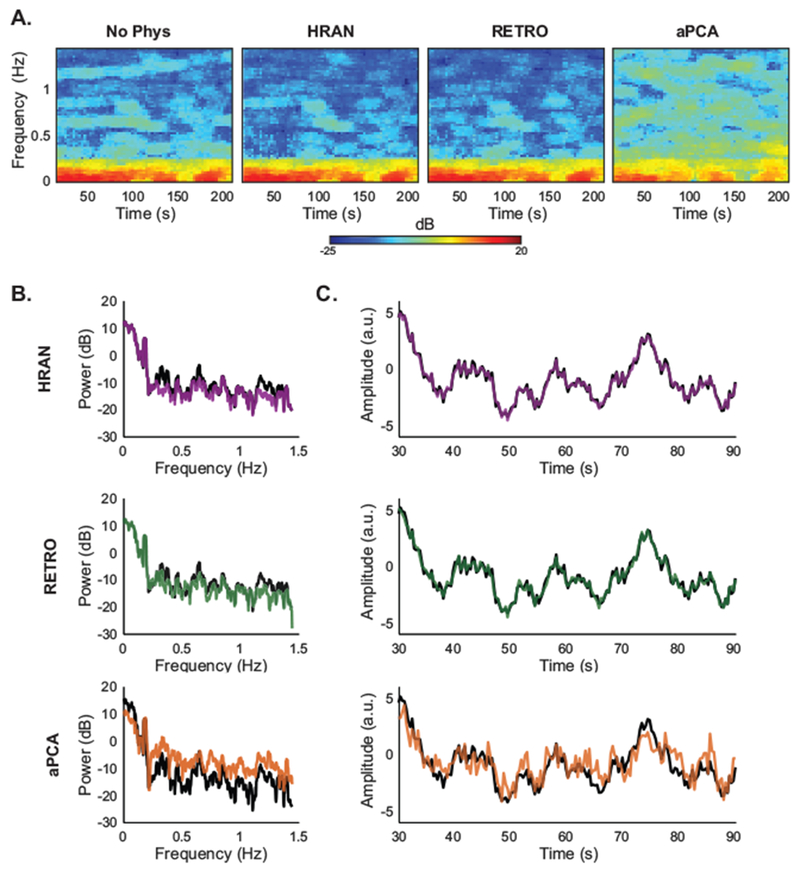
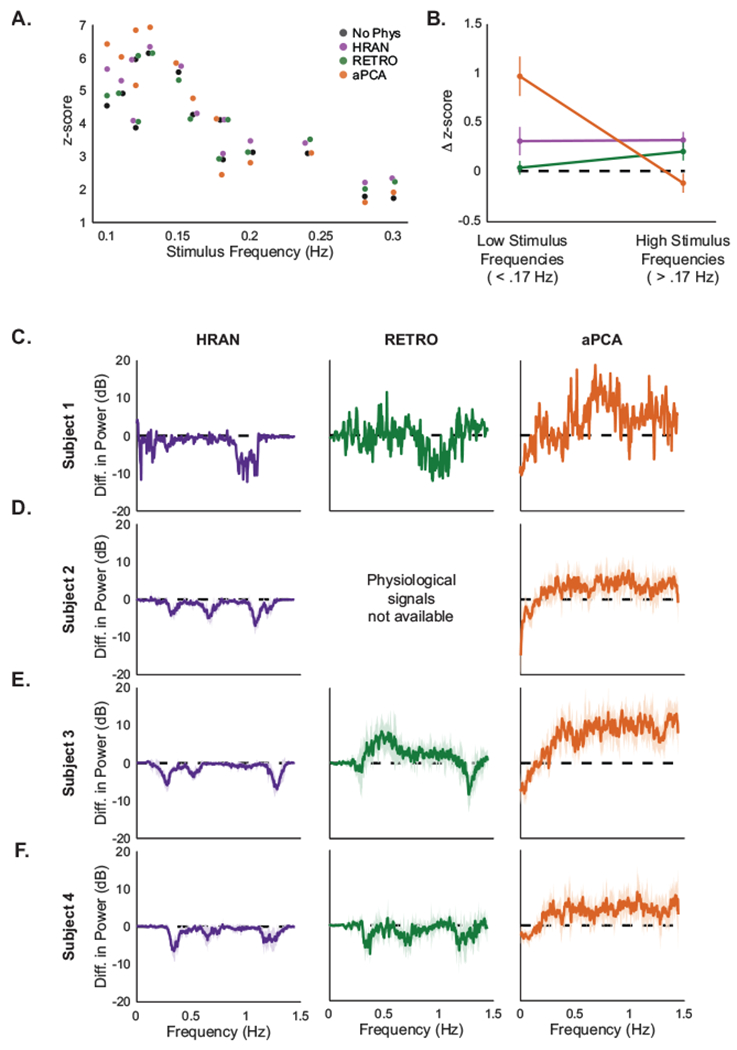
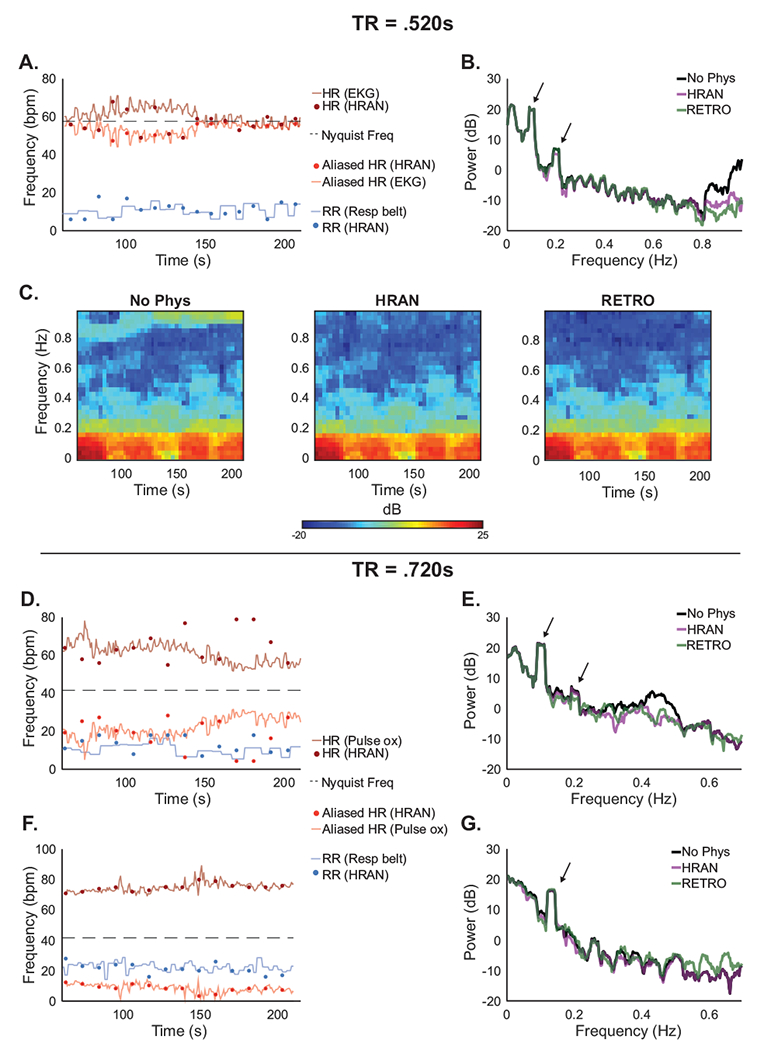
Recent improvements in the speed and sensitivity of fMRI acquisition techniques suggest that fast fMRI can be used to detect and precisely localize sub-second neural dynamics. This enhanced temporal resolution has enormous potential for neuroscientists. However, physiological noise poses a major challenge for the analysis of fast fMRI data. Physiological noise scales with sensitivity, and its autocorrelation structure is altered in rapidly sampled data, suggesting that new approaches are needed for physiological noise removal in fast fMRI. Existing strategies either rely on external physiological recordings, which can be noisy or difficult to collect, or employ data-driven approaches which make assumptions that may not hold true in fast fMRI. We created a statistical model of harmonic regression with autoregressive noise (HRAN) to estimate and remove cardiac and respiratory noise from the fMRI signal directly. This technique exploits the fact that cardiac and respiratory noise signals are fully sampled (rather than aliasing) when imaging at fast rates, allowing us to track and model physiology over time without requiring external physiological measurements. We then created a joint model of neural hemodynamics, and physiological and autocorrelated noise to more accurately remove noise. We first verified that HRAN accurately estimates cardiac and respiratory dynamics and that our model demonstrates goodness-of-fit in fast fMRI data. In task-driven data, we then demonstrated that HRAN is able to remove physiological noise while leaving the neural signal intact, thereby increasing detection of task-driven voxels. Finally, we established that in both simulations and fast fMRI data HRAN is able to improve statistical inferences as compared with gold-standard physiological noise removal techniques. In conclusion, we created a tool that harnesses the novel information in fast fMRI to remove physiological noise, enabling broader use of the technology to study human brain function.

Keywords: Autocorrelation; Fast fMRI; HRAN; Harmonic regression; Physiological noise; Simultaneous multislice (SMS).


Conflict of interest statement

Conflicts of Interest

The authors have no competing interests to declare.

Figures

Figure 1:
Figure 1:. Physiological noise sampled directly in fast fMRI.
Unlike conventional fMRI, physiological noise can be resolved without aliasing in fast fMRI. (A) A spectrogram of the 4th ventricle from a subject in Experiment A shows high power oscillations in the cardiac (red arrow) and respiratory (blue arrow) frequency range. (B) A zoomed-in time series from (A) (black rectangle) shows that the high-power oscillations correspond to cardiac (red) and respiratory (blue) cycles obtained from external physiological recordings. (C) Spectrograms from ROIs in Experiment B manifest the harmonic structure of the physiological noise. In the right lateral ventricle (left) one respiration term (blue arrow), two cardiac terms (red arrow), and one interaction term (purple arrow) are observed. These components are also present to varying degrees in pericalcarine cortex (middle) and the thalamus (right).
Figure 2:
Figure 2:. Cyclic Descent Algorithm.
HRAN uses an efficient cyclic descent algorithm to estimate model parameters. First, a windowed data segment y is selected from a physiological noise ROI (e.g. the ventricles). Second, windowed design matrices Z are generated by iterating through physiologically plausible cardiac and respiratory frequencies. Third, β^ for a given data segment y and design matrix Z is computed using Generalized Least Squares. Fourth, α^ and σ^2 are determined using the Burg Algorithm and Levinson Durbin Recursion on the residuals. Steps three and four are cycled until σ^2 converges, and the likelihood for the given parameters is computed. Finally, the likelihood is optimized across all tested physiological frequencies, yielding estimates of the fundamental cardiac and respiratory frequencies.
Figure 3:
Figure 3:. HRAN accurately estimates physiological frequencies.
Estimates of cardiac and respiratory frequencies derived from fast fMRI data using HRAN track estimates derived from external physiological reference signals. (A) A spectrogram of the 4th ventricle from a subject in Experiment A. The 4th ventricle was used to generate estimates of the fundamental physiological frequencies (white dots). (B) These estimated cardiac (red dots) and respiratory (blue dots) frequencies correspond to the heart rate obtained from EKG (red line) and respiratory rate obtained from a respiratory belt (blue line).
Figure 4:
Figure 4:. HRAN explains fast fMRI data across tissue type.
HRAN satisfies goodness-of-fit criteria across voxels with varied noise properties. (A) The power spectra of three exemplar voxels are shown from a subject in Experiment B: a cortical white matter voxel (left), a cortical grey matter voxel (middle), and a brainstem voxel (right). Each voxel manifests differing levels of physiological and autocorrelated noise. (B) The normalized cumulative periodograms (NCP) demonstrate that the residuals (grey line) in each voxel lie within a 95% confidence interval of ideal white noise (dashed black lines). (C) Quantile-quantile plots show that the residuals are also approximately normally distributed. (D) Goodness-of-fit criteria were similarly examined across the brain, and histograms of all voxels (left), cortical grey matter voxels (middle), and cortical white mater voxels (right) demonstrate that HRAN satisfies goodness-of-fit criteria across the majority of voxels in the brain.
Figure 5:
Figure 5:. HRAN removes simulated physiological noise with variable amplitude and frequency.
Each row displays the results of physiological noise removal using a different technique (row 1 no physiological noise removal, row 2 HRAN, row 3 simRETROICOR, and row 4 simPCA). Spectrograms of the simulated data with each of the physiological noise removal methods performed are shown in (Column A). The simulated physiological noise (black lines) and estimated physiological noise using each method (colored lines) are displayed in (Column B). The simulated data with physiological noise removed using each method (colored lines) are displayed on top of the simulated neural signal (black dashed lined) in (Column C). HRAN effectively accounts for and removes the physiological noise from the simulated data (second row). As simRETROICOR cannot accommodate variations in amplitude, physiological noise is both left in and introduced into the simulated data (third row). While the simPCA approach accounts for amplitude variations, it is unable to address the 90° phase delay of the cardiac noise and leaves it in the simulated data (fourth row).
Figure 6:
Figure 6:. HRAN improves detection of task-driven voxels.
(A) As compared with no physiological regression, HRAN increases the median z-scores of anatomically and functionally defined ROIs in visual cortex across four subjects and twelve runs. Autoregressive noise was not removed. (B, C) Spectrograms of this ROI are shown with and without physiological noise removal in two exemplar runs, demonstrating that respiratory and cardiac frequencies are selectively removed. (D, F) Power spectra in these two exemplar runs further illustrates that these physiological peaks are removed, while the signal and background noise is preserved. (E, G) Maps of the differences in z-scores in each voxel of an example slice with and without HRAN, showing broad increases in statistical detection of activation across the visual cortex when HRAN is applied.
Figure 7:
Figure 7:. Comparison of noise removal methods in one subject.
HRAN removes physiological noise while preserving fMRI signal. (A) Spectrograms of the ROI in one run from Experiment C (Subject 4) show that cardiac noise is appropriately removed by HRAN and RETROICOR, but not by aPCA. (B) Power spectra of the same ROI show that HRAN and RETROICOR account for time-varying physiological noise, while aPCA removes low-frequency noise and introduces high-frequency noise. (C) Timeseries of the ROI demonstrate that HRAN and RETROICOR track the original data, whereas aPCA introduces substantial high-frequency fluctuations.
Figure 8:
Figure 8:. Comparison of noise removal methods across subjects.
HRAN selectively removes physiological noise and improves z-scores across stimulus frequencies. (A) Median z-scores across the ROI with no physiological noise removal (black), HRAN (purple), RETROICOR (green), and aPCA (orange) across all subjects. Stimulus frequency is jittered for display. At lower stimulus frequencies aPCA demonstrates the greatest increase in z-scores, but at higher stimulus frequencies only HRAN and RETROICOR improve detection. (B) Average difference of median z-scores with each method and no physiological regression grouped by stimulus frequency: low frequency (<0.17 Hz, n = 7 runs) and high frequency (>0.17 Hz, n = 6 runs). Error bars depict standard error. (C-F) Difference in mean power spectra between each physiological noise removal method and no physiological noise removal in the ROI. Negative values indicate that power at that frequency has been reduced (or noise has been removed), and positive values indicate that power has been increased (or noise has been introduced). Shading represents the standard deviation across runs for each subject. One run was collected for Subject 1, and six runs were collected for Subjects 2-4.
Figure 9:
Figure 9:. Performance of HRAN varies with TR and physiology.
HRAN may be effective even if fMRI data is sampled below the Nyquist frequency, though to a limited extent. (A) With TR = .520s, the respiratory frequencies estimated by HRAN (blue dots) track the respiration rate obtained using external recordings (blue line), though the cardiac estimates (dark red dots) do not always track the heart rate (dark red line) directly; however, the aliased HRAN cardiac estimates (light red dots) track the aliased heart rate (light red line). (B-C) Power spectra and spectrograms of the ROI demonstrate removal of physiological noise. Neurally-relevant peaks indicated by arrows. (D,F) The cardiac frequencies may alias into respiratory frequency bands and limit HRAN estimation, or into a distinct frequency band where HRAN still performs well (examples have TR = .720s). (E,G) Power spectra demonstrate removal of the physiological noise to varying degrees. Neurally-relevant peaks indicated by arrows.

References

    1. Aslan Serdar, Hocke Lia, Schwarz Nicolette, and Frederick Blaise. “Extraction of the Cardiac Waveform from Simultaneous Multislice FMRI Data Using Slice Sorted Averaging and a Deep Learning Reconstruction Filter.” NeuroImage 198 (September 1, 2019): 303–16. 10.1016/j.neuroimage.2019.05.049. - DOI - PMC - PubMed
    1. Bandettini Peter A. “Neuronal or Hemodynamic? Grappling with the Functional MRI Signal.” Brain Connectivity 4, no. 7 (September 27, 2014): 487–98. 10.1089/brain.2014.0288. - DOI - PMC - PubMed
    1. Barbieri Riccardo, Matten Eric C., Alabi AbdulRasheed A., and Brown Emery N.. “A Point-Process Model of Human Heartbeat Intervals: New Definitions of Heart Rate and Heart Rate Variability.” American Journal of Physiology-Heart and Circulatory Physiology 288, no. 1 (January 2004): H424–35. 10.1152/ajpheart.00482.2003. - DOI - PubMed
    1. Barth Markus, Breuer Felix, Koopmans Peter J., Norris David G., and Poser Benedikt A.. “Simultaneous Multislice (SMS) Imaging Techniques.” Magnetic Resonance in Medicine 75, no. 1 (January 2016): 63–81. 10.1002/mrm.25897. - DOI - PMC - PubMed
    1. Behzadi Yashar, Restom Khaled, Liau Joy, and Liu Thomas T.. “A Component Based Noise Correction Method (CompCor) for BOLD and Perfusion Based FMRI.” NeuroImage 37, no. 1 (August 1, 2007): 90–101. 10.1016/j.neuroimage.2007.04.042. - DOI - PMC - PubMed

Publication types