. 2019 Oct 5;8(10):1203.
doi: 10.3390/cells8101203.

Acetylcholine Receptor Activation as a Modulator of Glioblastoma Invasion

Affiliations

Acetylcholine Receptor Activation as a Modulator of Glioblastoma Invasion

Emily G Thompson et al. Cells. .

Abstract

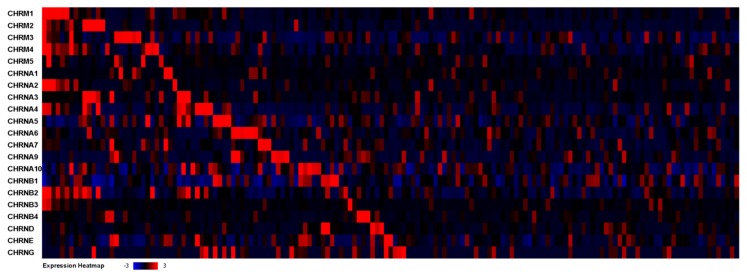
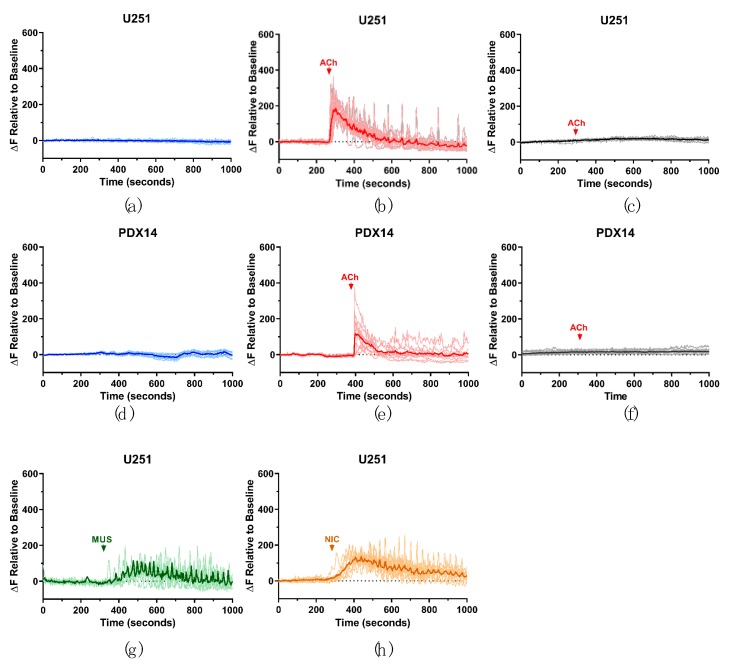
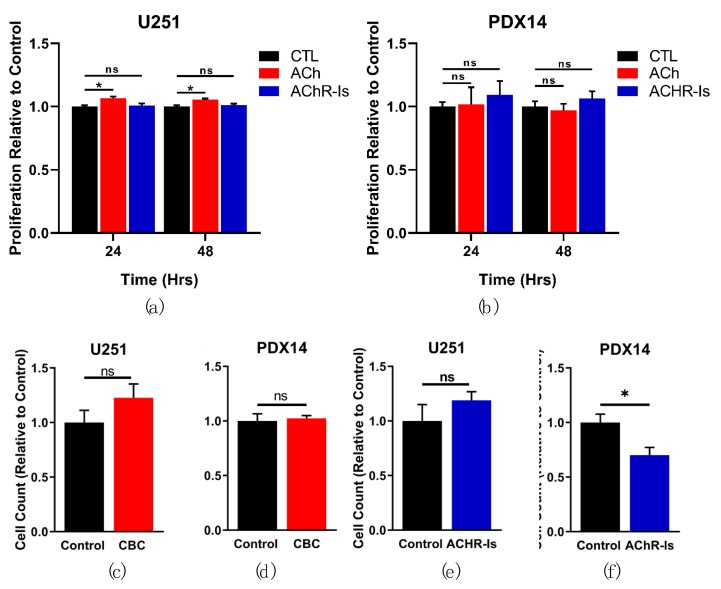
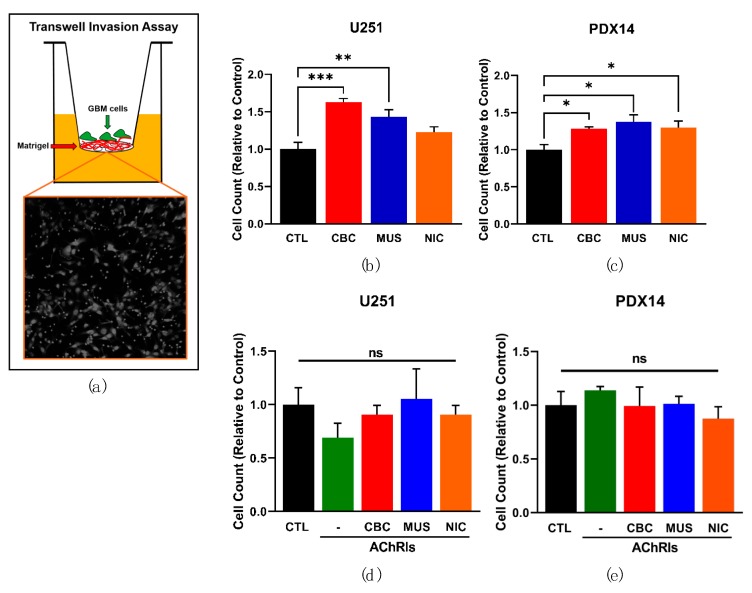
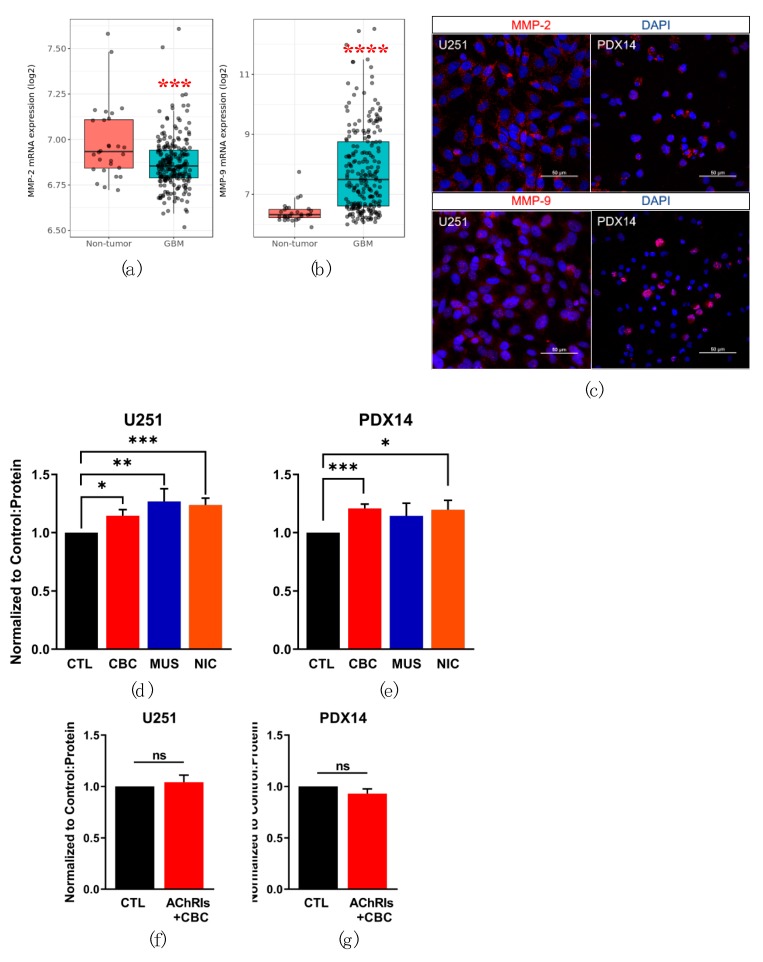
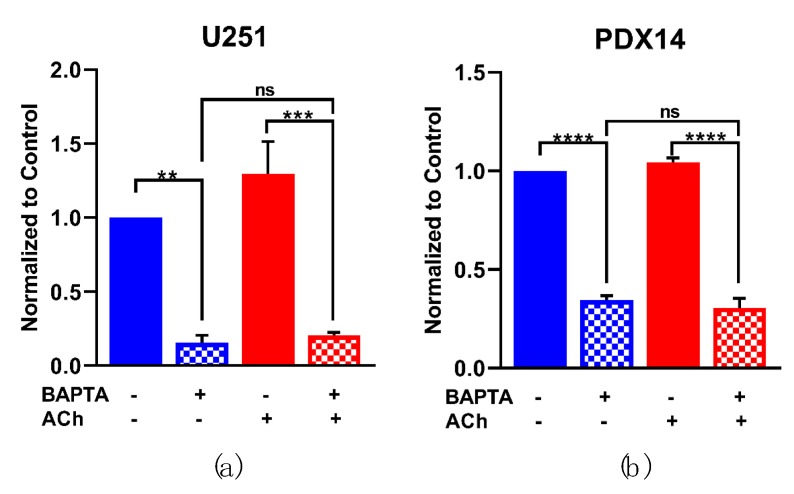
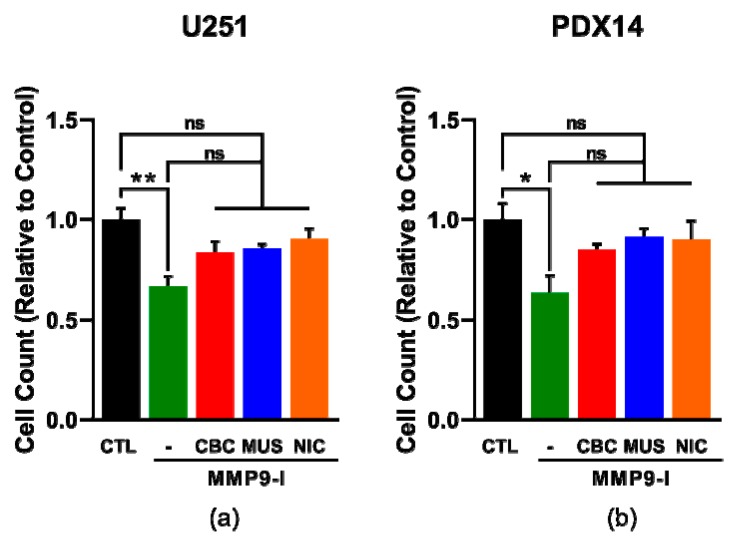
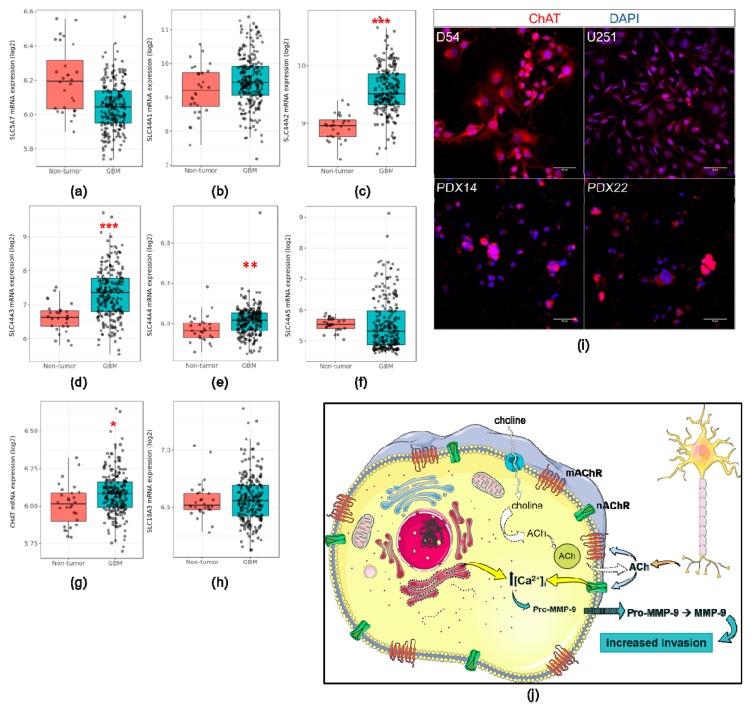
Grade IV astrocytomas, or glioblastomas (GBMs), are the most common malignant primary brain tumor in adults. The median GBM patient survival of 12-15 months has remained stagnant, in spite of treatment strategies, making GBMs a tremendous challenge clinically. This is at least in part due to the complex interaction of GBM cells with the brain microenvironment and their tendency to aggressively infiltrate normal brain tissue. GBMs frequently invade supratentorial brain regions that are richly innervated by neurotransmitter projections, most notably acetylcholine (ACh). Here, we asked whether ACh signaling influences the biology of GBMs. We examined the expression and function of known ACh receptors (AChRs) in large GBM datasets, as well as, human GBM cell lines and patient-derived xenograft lines. Using RNA-Seq data from the "The Cancer Genome Atlas" (TCGA), we confirmed the expression of AChRs and demonstrated the functionality of these receptors in GBM cells with time-lapse calcium imaging. AChR activation did not alter cell proliferation or migration, however, it significantly increased cell invasion through complex extracellular matrices. This was due to the enhanced activity of matrix metalloproteinase-9 (MMP-9) from GBM cells, which we found to be dependent on an intracellular calcium-dependent mechanism. Consistent with these findings, AChRs were significantly upregulated in regions of GBM infiltration in situ (Ivy Glioblastoma Atlas Project) and elevated expression of muscarinic AChR M3 correlated with reduced patient survival (TCGA). Data from the Repository for Molecular Brain Neoplasia Data (REMBRANDT) dataset also showed the co-expression of choline transporters, choline acetyltransferase, and vesicular acetylcholine transporters, suggesting that GBMs express all the proteins required for ACh synthesis and release. These findings identify ACh as a modulator of GBM behavior and posit that GBMs may utilize ACh as an autocrine signaling molecule.

Keywords: acetylcholine receptors; glioblastoma; invasion; matrix metalloproteinases.


Conflict of interest statement

The authors declare no conflicts of interest.

Figures

Figure 1
Figure 1
AChR expression in the TCGA dataset. RNA-Seq mRNA expression heatmap of AChR genes across GBM patients in the TCGA cohort (n = 156 GBM samples) via the cBioPortal platform.
Figure 2
Figure 2
AChR activation causes an intracellular Ca2+ increase in GBM cells. Representative graphs of [Ca2+]i changes in the U251 and PDX14 lines. GBM cells were loaded with Fluo-4AM. aCSF was perfused into the imaging chamber for at least 10 min to establish a basal Ca2+ activity recording (a,d). Following this baseline period, 1 mM ACh was perfused into the chamber and the response was recorded (b,e). AChRs were inhibited by the addition of 1 μM atropine and 10 μM mecamylamine for 10 min, then 1 mM ACh was also added to the solution (arrow indicates the presence of ACh in the imaging chamber) and the response was recorded (c,f). The response of U251 cells to 10 μM muscarine (MUS) (g) and 100 μM nicotine (NIC) (h). ΔF relative to the baseline was calculated by taking the average fluorescent intensity during the first 2 min of the experiment, prior to drug addition, and making all fluorescent intensities relative to this calculated value. For each experiment, the response of at least 10 cells was quantified, with each individual cell’s response graphed in the lighter line and the averaged cell response shown in the darker line. All experiments were performed at least three separate times as confirmation of the responses shown in the representative graphs.
Figure 3
Figure 3
GBM AChR activation has minimal effect on proliferation and migration. The effect of AChR stimulation and inhibition on GBM proliferation and migration was evaluated with in vitro assays. Proliferation was measured in the U251 and PDX14 lines with an alamarBlue assay at 24 and 48 h in the presence of 1 mM ACh or AChRIs (1 µM atropine and 10 µM mecamylamine) (a, b). Migration of the U251 and PDX14 lines exposed to 100 µM CBC or AChRIs (1 µM atropine and 10 µM mecamylamine) was quantified in a transwell migration assay at 12 h (U251) and 48 h (PDX14) (cf). A repeated measurement two-way ANOVA was used to analyze proliferation results: *** p = 0.0002 (a), p = 0.8969 (b). Dunnett’s multiple comparison test with a single pooled variance was used to analyze CTL vs. ACh/AChRIs in the proliferation assays (a, b): CTL vs. ACh @24 h *p = 0.0125, @48 h * p = 0.0357; CTL vs. AChRIs @24 h p = 0.8403, @48 h p = 0.7733 (a) CTL vs. ACh @24 h p = 0.9971, @48 h p = 0.9563; CTL vs. AChRIs @24 h p = 0.6656, @48 h p = 0.8206 (b). A two-tailed Student’s t test was used to analyze the Transwell migration results (cf): p = 0.2377 (c), p = 0.7406 (d), p = 0.3067 (e), and *p = 0.0294 (f).
Figure 4
Figure 4
AChR activation significantly increases GBM cell invasion. A transwell invasion assay (TIA) was used to evaluate the invasiveness of GBM cells with AChR stimulation (100 μM CBC, 10 μM muscarine (MUS), 100 μM nicotine (NIC)) (a). TIA with U251 and PDX14 lines after 48 h (b, c). TIA with the U251 line in the presence of AChRIs (1 μM atropine and 10 μM mecamylamine) and AChR agonists (d, e). A one-way ANOVA was performed on the U251 TIA data *** p = 0.0008 (b), p = 0.6222 (d) and the PDX14 TIA data * p = 0.0191 (c), p = 0.6654 (d). Subsequently, Dunnett’s multiple comparison test with a single pooled variance was used to analyze CTL vs. CBC *** p = 0.0003, CTL vs. MUS ** p = 0.0066, CTL vs. NIC p = 0.1623 (b); CTL vs. CBC * p = 0.0488, CTL vs. MUS * p = 0.0101, CTL vs. NIC * p = 0.0391 (c).
Figure 5
Figure 5
GBM AChR activation increases MMP-9 activity. REMBRANDT mRNA expression of MMP-2 (a) and MMP-9 (b) in non-tumor and GBM samples. Immunocytochemistry was used to confirm the expression of MMP-2 and MMP-9 in the U251 and PDX14 GBM lines (c). Gelatin zymography was used to measure MMP activity normalized to protein content and the control for each sample. Mature MMP-9 (67 kDa) activity after AChR stimulation in the U251 (d) and PDX14 (e) cell lines at 24 h, by AChR agonists (100 µM CBC, 10 µM muscarine (MUS), 100 µM nicotine (NIC)) MMP-9 activity with AChRIs (1 µM atropine and 10 µM mecamylamine) and 100 µM CBC in the U251 (f) and PDX14 (g) cell lines at 24 h. A pairwise t test with Bonferroni correction was used in (a) p = 0.00026 *** and (b) <0.0001 ****. A two-tailed Student’s t test was used to compare MMP-9 activity: CTL vs. CBC * p = 0.0159, CTL vs. MUS ** p = 0.0089, CTL vs. NIC *** p = 0.0003 (b); CTL vs. CBC *** p = 0.0002, CTL vs. MUS p = 0.2223, CTL vs. NIC *p = 0.0409 (e); CTL vs. AChRIs + CBC p = 0.5740 (f); CTL vs. AChRIs + CBC p = 0.2027 (g).
Figure 6
Figure 6
AChR-induced MMP-9 activity is dependent on intracellular Ca2+. [Ca2+]i was chelated with cell permeant Ca2+-chelator BAPTA-AM (20 µM) in the U251 and PDX14 lines 30 min prior to the addition of 1 mM ACh. After 6 h, the medium was collected and gelatin zymography was performed (a,b). A one-way ANOVA was performed on the mature MMP-9 activity data from the U251s *** p = 0.0002 (a) and the PDX14s **** p < 0.0001 (b). Tukey’s multiple comparison test was used to compare the conditions: −BAPTA − ACh vs. +BAPTA − ACh ** p = 0.0032, −BAPTA + ACh vs. +BAPTA + ACh *** p = 0.0006, −BAPTA − ACh vs. +BAPTA + ACh p = 0.9886 (a); −BAPTA − ACh vs. +BAPTA − ACh **** p < 0.0001, −BAPTA + ACh vs. +BAPTA + ACh **** p < 0.0001, −BAPTA − ACh vs. +BAPTA + ACh p = 0.9002 (b).
Figure 7
Figure 7
MMP-9 activity mediates the AChR-induced increase in GBM cell invasion. A transwell invasion assay (TIA) was used to evaluate the invasiveness of GBM cells with AChR stimulation and MMP-9 inhibition. TIA with the U251 (a) and PDX14 lines (b) after 48 h in the presence of MMP-9 Inhibitor I (MMP9-I, 100 nM). A one-way ANOVA was used for statistical analysis: ** p = 0.0061 (a); * p = 0.0296 (b). Subsequently, Tukey’s multiple comparisons test was used to analyze: CTL vs. CTL + MMP9-I ** p = 0.0028, CTL vs. CBC + MMP9-1 p = 0.1288, CTL vs. MUS + MMP9-I p = 0.2151, CTL vs. NIC + MMP9-I p = 0.6373, CTL + MMP9-I vs. CBC + MMP9-1 p = 0.1868, CTL + MMP9-I vs. MUS + MMP9-I p = 0.1151, CTL + MMP9-I vs. NIC + MMP9-I p = 0.0502 (a); CTL vs. CTL + MMP-1 * p = 0.0190, CTL vs. CBC + MMP9-1 p = 0.5856, CTL vs. MUS + MMP9-I p = 0.9059, CTL vs. NIC + MMP9-I p = 0.8482, CTL + MMP9-I vs. CBC + MMP9-1 p = 0.2659, CTL + MMP9-I vs. MUS + MMP9-I p = 0.0953, CTL + MMP9-I vs. NIC + MMP9-I p = 0.1226 (b).
Figure 8
Figure 8
AChRs are upregulated in active zones of infiltration in GBM patients. mRNA expression of CHRNA7, CHRNB2, CHRM1, and CHRM3 within cellular tumor (CT), infiltrating tumor (IT), and leading edge (LE) populations from GBM samples in the Ivy GAP dataset. Tukey’s honest significant difference test was used to compare the expression changes in the IT and LE populations in comparison to the expression within the CT population. CHRNA7: CT vs. LE p < 0.01 **, CT vs. IT p < 0.05 *; CHRNB2: CT vs. LE p < 0.001 ***, CT vs. IT p < 0.05*; CHRM1: CT vs. LE p < 0.001 ***, CT vs. IT p < 0.001 ***; CHRM3: CT vs. LE p < 0.001 ***, CT vs. IT p = 0.21.
Figure 9
Figure 9
GBMs express other components of ACh signaling. mRNA expression of SLC5A7 (a), SLC44A1 (b), SLC44A2 (c), SLC44A3 (d), SLC44A4 (e), SLC44A5 (f), CHAT (g), and SLC18A3 (h) in GBM samples from the REMBRANDT dataset. Immunocytochemical analysis of ChAT expression in the GBM cell lines (i). Proposed ACh autocrine signaling loop in GBM cells (j). Tukey’s honest significant difference test was used to compare the expression in the GBM samples in comparison to the non-tumor samples. SLC44A2 p < 0.001 *** (c), SLC44A3 p < 0.001 *** (d), SLC44A4 p < 0.01 ** (e), CHAT p < 0.05 * (g).

References

    1. Ostrom Q.T., Gittleman H., Truitt G., Boscia A., Kruchko C., Barnholtz-Sloan J.S. CBTRUS Statistical Report: Primary Brain and Other Central Nervous System Tumors Diagnosed in the United States in 2011–2015. Neuro. Oncol. 2018;20:iv1–iv86. doi: 10.1093/neuonc/noy131. - DOI - PMC - PubMed
    1. Wen P.Y., Kesari S. Malignant gliomas in adults. N. Engl. J. Med. 2008;359:492–507. doi: 10.1056/NEJMra0708126. - DOI - PubMed
    1. Stupp R., Mason W.P., van den Bent M.J., Weller M., Fisher B., Taphoorn M.J.B., Belanger K., Brandes A.A., Marosi C., Bogdahn U., et al. European Organisation for Research and Treatment of Cancer Brain Tumor and Radiotherapy Groups; National Cancer Institute of Canada Clinical Trials Group Radiotherapy plus concomitant and adjuvant temozolomide for glioblastoma. N. Engl. J. Med. 2005;352:987–996. doi: 10.1056/NEJMoa043330. - DOI - PubMed
    1. Goffart N., Kroonen J., Rogister B. Glioblastoma-initiating cells: Relationship with neural stem cells and the micro-environment. Cancers (Basel) 2013;5:1049–1071. doi: 10.3390/cancers5031049. - DOI - PMC - PubMed
    1. Lee J.H., Lee J.E., Kahng J.Y., Kim S.H., Park J.S., Yoon S.J., Um J.-Y., Kim W.K., Lee J.-K., Park J., et al. Human glioblastoma arises from subventricular zone cells with low-level driver mutations. Nature. 2018;560:243–247. doi: 10.1038/s41586-018-0389-3. - DOI - PubMed

Publication types