

Effects of Glycemic Index and Cereal Fiber on Postprandial Endothelial Function, Glycemia, and Insulinemia in Healthy Adults
- PMID: 31590437
- PMCID: PMC6835298
- DOI: 10.3390/nu11102387
Effects of Glycemic Index and Cereal Fiber on Postprandial Endothelial Function, Glycemia, and Insulinemia in Healthy Adults
Abstract
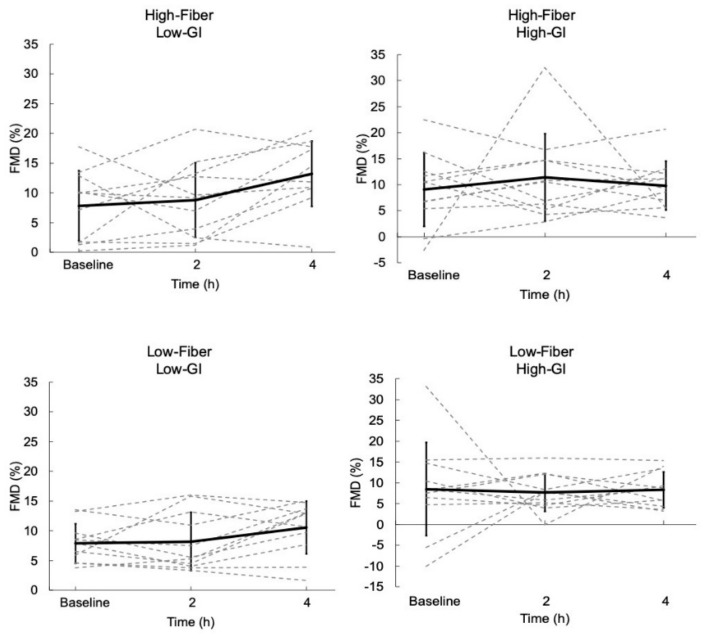
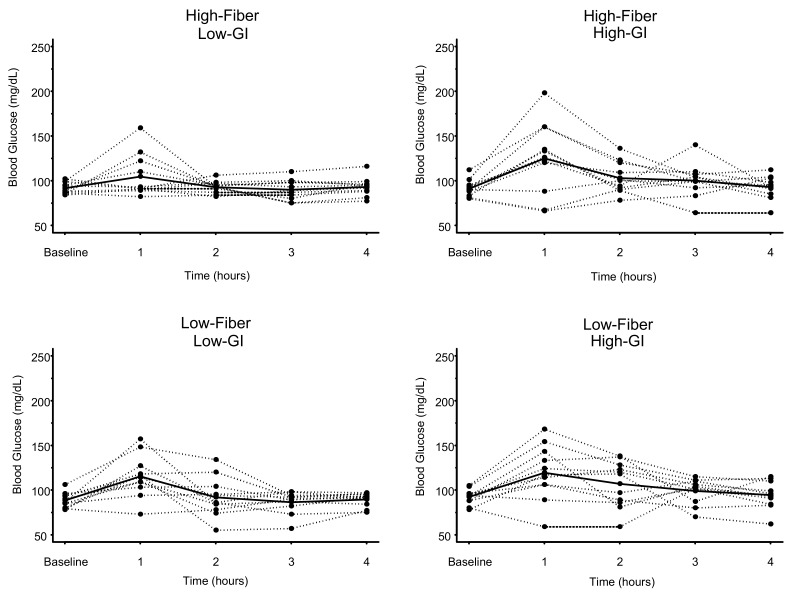
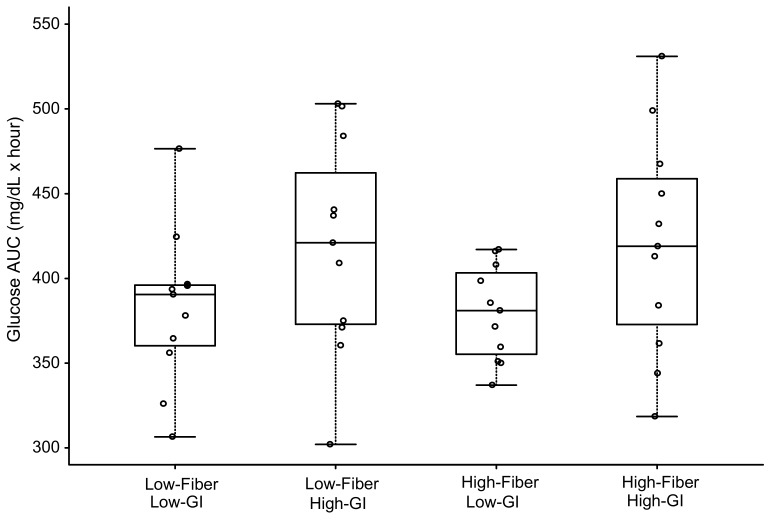
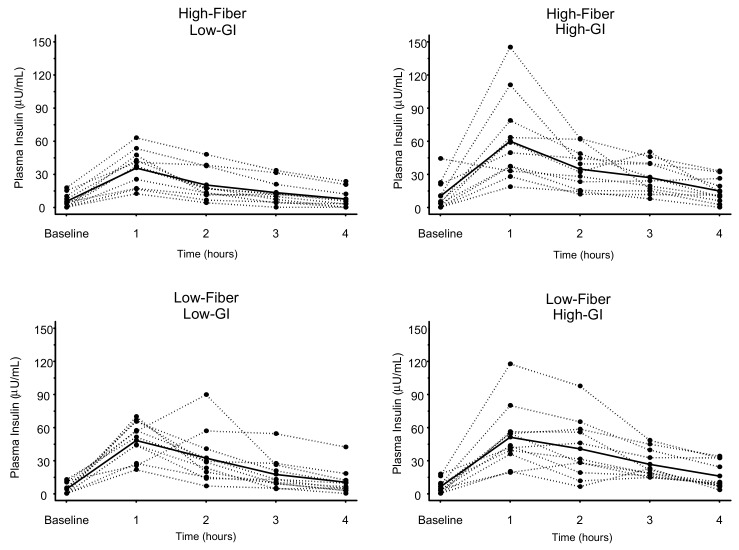
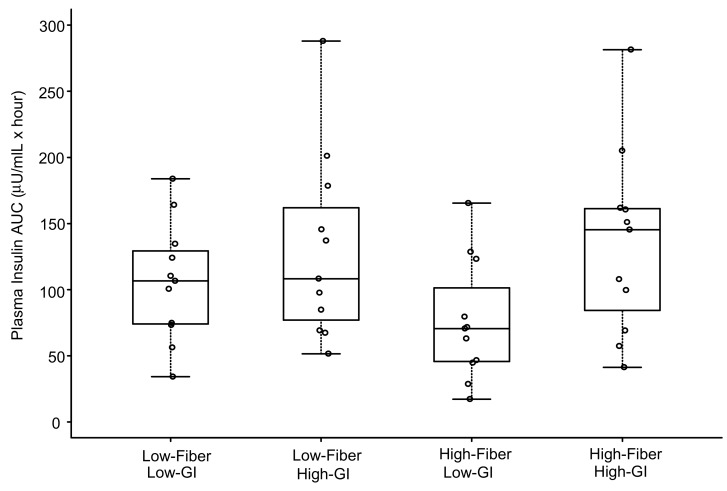
Both glycemic index and dietary fiber are associated with cardiovascular disease risk, which may be related in part to postprandial vascular effects. We examined the effects of both glycemic index (GI) and dietary (mainly cereal) fiber on postprandial endothelial function. Eleven adults (5 men; 6 women; age = 42.4 ± 16.1 years; weight = 70.5 ± 10.7 kg; height = 173.7 ± 8.7 cm) consumed four different breakfast meals on separate, randomized occasions: High-Fiber, Low-GI (HF-LGI: Fiber = 20.4 g; GI = 44); Low-Fiber, Low-GI (LF-LGI: Fiber = 4.3 g; GI = 43); Low-Fiber, High-GI (LF-HGI: Fiber = 3.6 g; GI = 70); High-Fiber, High-GI (HF-HGI: Fiber = 20.3 g; GI = 71). Meals were equal in total kcal (~600) and macronutrient composition (~90 g digestible carbohydrate; ~21 g protein; ~15 g fat). The HF-LGI meal resulted in a significant increase in flow-mediated dilation (FMD) 4 hours after meal ingestion (7.8% ± 5.9% to 13.2% ± 5.5%; p = 0.02). FMD was not changed after the other meals. Regardless of fiber content, low-GI meals resulted in ~9% lower 4-hour glucose area under curve (AUC) (p < 0.05). The HF-LGI meal produced the lowest 4-hour insulin AUC, which was ~43% lower than LF-HGI and HF-HGI (p < 0.001), and 28% lower than LF-LGI (p = 0.02). We conclude that in healthy adults, a meal with low GI and high in cereal fiber enhances postprandial endothelial function. Although the effect of a low-GI meal on reducing postprandial glucose AUC was independent of fiber, the effect of a low-GI meal on reducing postprandial insulin AUC was augmented by cereal fiber.
Keywords: cardiovascular disease; flow-mediated dilation; glucose; insoluble fiber; insulin; vascular.
Conflict of interest statement
G.A.G. and C.M.W serve as members of the scientific advisory board for Ardent Mills, L.L.C. G.A.G serves as a member of the scientific advisory boards for the Wheat Foods Council and the Grain Foods Foundation. The funders had no role in the design of the study; in the collection, analyses, or interpretation of data; in the writing of the manuscript, or in the decision to publish the results.
Figures
References
-
- Decode Study Group, the European Diabetes Epidemiology Group Glucose tolerance and cardiovascular mortality: Comparison of fasting and 2-hour diagnostic criteria. Arch. Intern. Med. 2001;161:397–405. - PubMed
-
- Loader J., Montero D., Lorenzen C., Watts R., Meziat C., Reboul C., Stewart S., Walther G. Acute Hyperglycemia Impairs Vascular Function in Healthy and Cardiometabolic Diseased Subjects: Systematic Review and Meta-Analysis. Arterioscler. Thromb. Vasc. Biol. 2015;35:2060–2072. doi: 10.1161/ATVBAHA.115.305530. - DOI - PubMed
Publication types
MeSH terms
Substances
Grants and funding
LinkOut - more resources
Full Text Sources
Medical
Research Materials
Miscellaneous
