Review
. 2019 Oct 7;17(1):337.
doi: 10.1186/s12967-019-2073-2.

Bringing radiomics into a multi-omics framework for a comprehensive genotype-phenotype characterization of oncological diseases

Affiliations
Review

Bringing radiomics into a multi-omics framework for a comprehensive genotype-phenotype characterization of oncological diseases

Mario Zanfardino et al. J Transl Med. .

Abstract

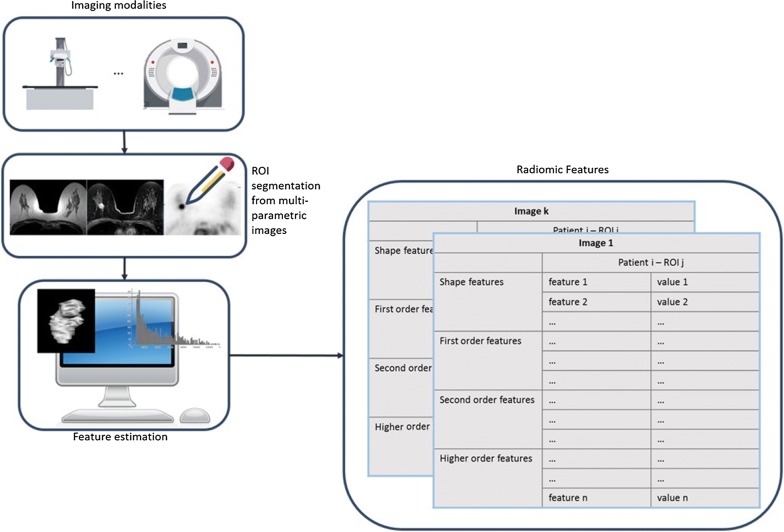
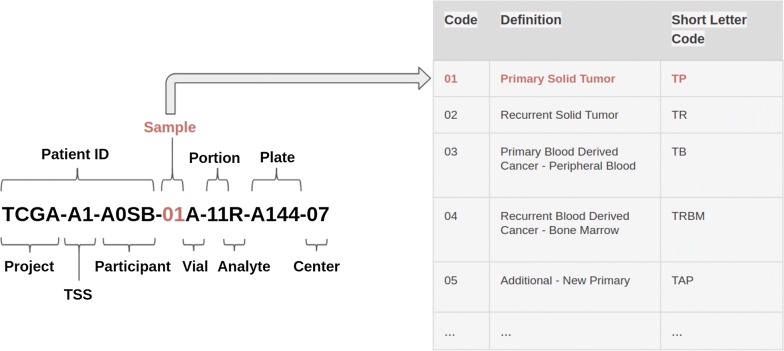
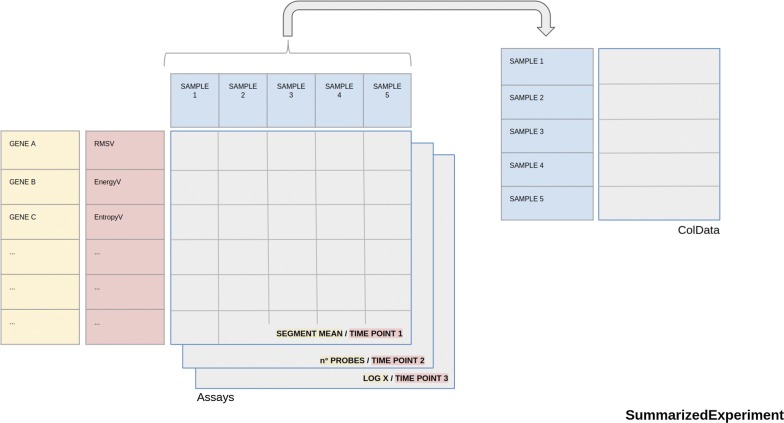
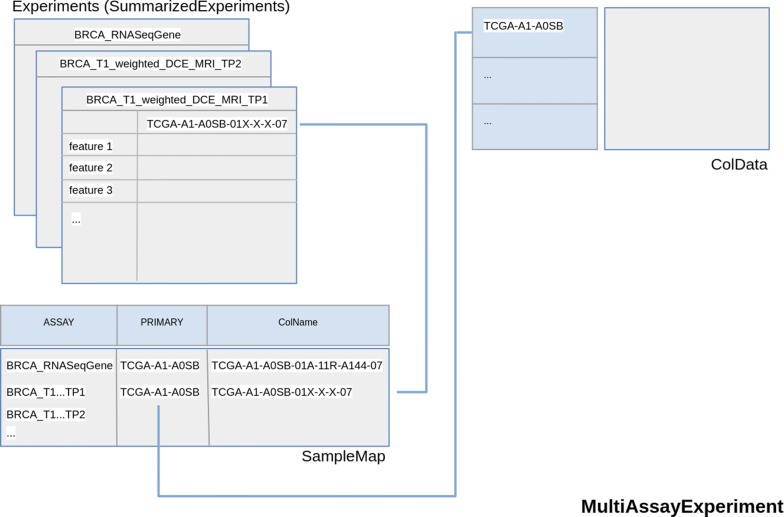
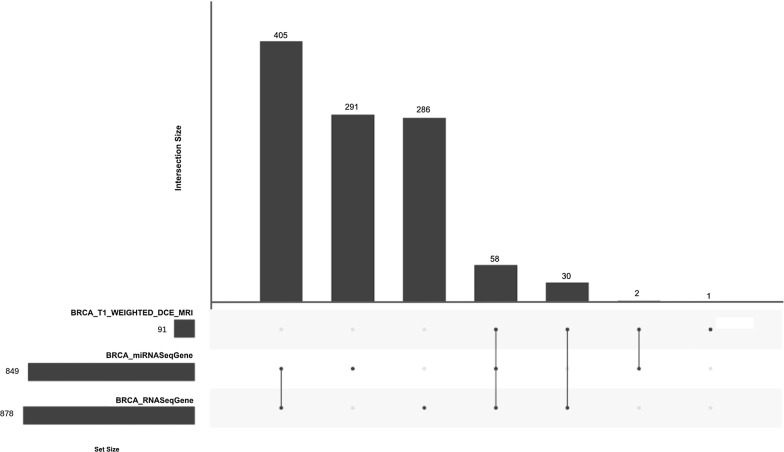
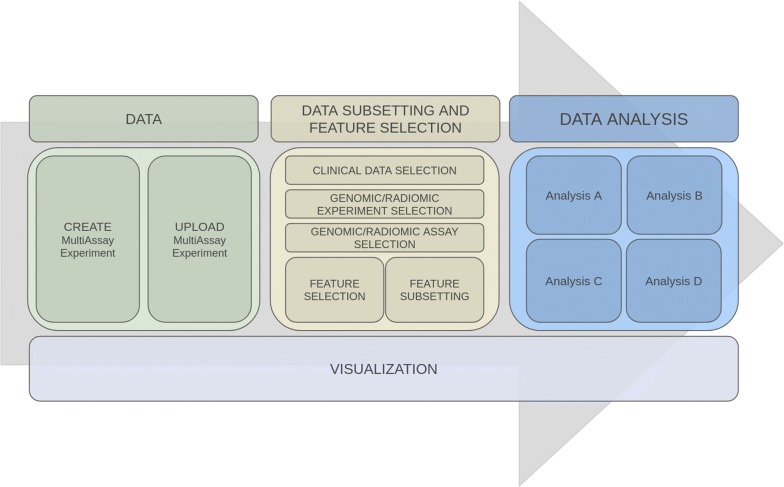
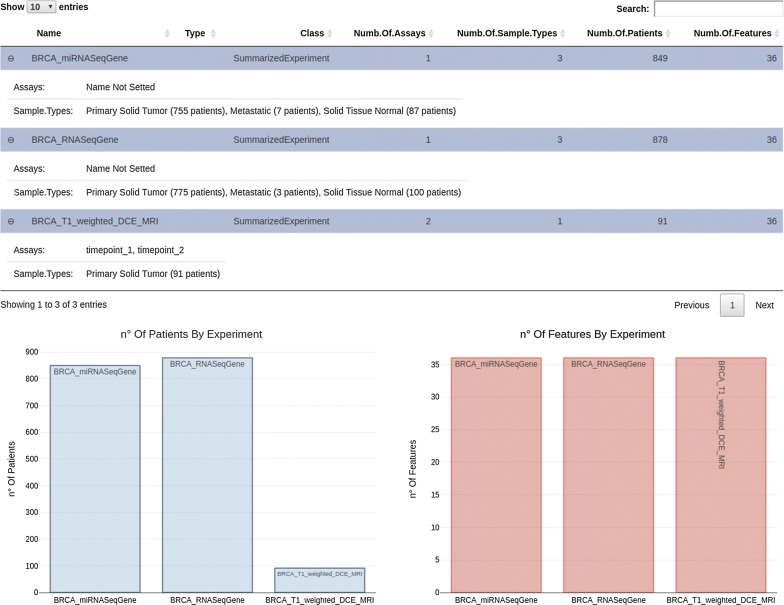
Genomic and radiomic data integration, namely radiogenomics, can provide meaningful knowledge in cancer diagnosis, prognosis and treatment. Despite several data structures based on multi-layer architecture proposed to combine multi-omic biological information, none of these has been designed and assessed to include radiomic data as well. To meet this need, we propose to use the MultiAssayExperiment (MAE), an R package that provides data structures and methods for manipulating and integrating multi-assay experiments, as a suitable tool to manage radiogenomic experiment data. To this aim, we first examine the role of radiogenomics in cancer phenotype definition, then the current state of radiogenomics data integration in public repository and, finally, challenges and limitations of including radiomics in MAE, designing an extended framework and showing its application on a case study from the TCGA-TCIA archives. Radiomic and genomic data from 91 patients have been successfully integrated in a single MAE object, demonstrating the suitability of the MAE data structure as container of radiogenomic data.

Keywords: Cancer; MultiAssayExperiment; Radiogenomics; Radiomics; TCGA; TCIA.


Conflict of interest statement

The authors declare that they have no competing interests.

Figures

Fig. 1
Fig. 1
Radiomics workflow. Radiomics features can be calculated from one or more imaging modalities, e.g. computed tomography (CT), magnetic resonance (MR), positron emission tomography (PET), for each time point acquired. Then, regions of interest (ROIs) are segmented from the acquired multi-parametric images, e.g. T2 weighted MR image, Contrast Enhanced T1 weighted MR image, FDG PET image, as shown from left to right in the figure in a case of breast lesion. Finally, the radiomic features are estimated, providing hundreds of features that can be categorized as shape, first order, second order and higher order features, for each segmented ROI, for each patient in the study and for each acquired image
Fig. 2
Fig. 2
A barcode example. An example of a The Cancer Genome Atlas barcode with a focus on the Sample Type Codes table. Some of the identifiers, such as Vial, Portion, Analyte and Plate, are specific for biological experiments and obviously are not usable for radiomic experiments
Fig. 3
Fig. 3
SummarizedExperiment object schema. In yellow: a classic use of summarizedExperiment object to store biological ‘omic experiment data. Each assay contains data for a result of the experiment (in this case segment mean, no probes and Log X from a Copy Number Alterations experiment). The rows of SE represent the genes and the columns represent the samples. Data describing the samples are stored in ColData object. In red: a summarizedExperiment with Magnetic Resonance Time Points as different assays. Each assay of the summarizedExperiment contains data of a single time-point and the rows represent radiomic features
Fig. 4
Fig. 4
MultiAssayExperiment object schema with Magnetic Resonance Time Points as different Experiments. The second option described to store temporal multi-dimensionality of a radiomic experiment. Each element of Experiments (in this case a SummarizedExperiments) object of the MultiAssayExperiment contains data of a single time-point. TRhe radiomic features are also contained in the rows of SummarizedExperiment
Fig. 5
Fig. 5
A generalized Venn diagram for sample membership in multiple assays. The visualization of set intersections was performed using the UpSet matrix design using UpSetR package
Fig. 6
Fig. 6
Architecture of the modular integration platform. The architecture herein proposed follows three separate modules. The first module, based on data uploading of a MultiAssayExperiment or from its construction from multiple SummarizedEXperiment or matrix-like data. The second module allows to execute different selections of data (by clinical data, such as pathological stage or histological type of cancer, by experiment/assay and features). Then selected data are the input of different and/or integrate data analysis module. This modular architecture simplify expansion and redesign of a single implementation and allow simple adding of a personal module of data preparation and/or analysis for specific tasks. Moreover, all modules may provide visualization of data to support the different operations (see an example of data visualization in Fig. 6)
Fig. 7
Fig. 7
A screenshot of summary tab of the graphic interface prototype. The summary tab shows the MAE data of the described case study. In the top table the name of all MAE experiments are listed and for each of them are reported the assays (timepoint_1 and timepoint_2 in the case of BRCA_T1_weighted_DCE_MRI) and the sample types. For each sample type, the number of patients is specified. The number of features and patients for each experiment are also represented as histogram (for a simple graphic representation the number of features was limited to 36 for all experiments)

References

    1. Ramos M, Schiffer L, Re A, et al. Software for the integration of multiomics experiments in Bioconductor. Cancer Res. 2017;77:e39–e42. - PMC - PubMed
    1. Hariri AR, Weinberger DR. Imaging genomics. Br Med Bull. 2003;65:259–270. - PubMed
    1. Baltrušaitis T, Ahuja C, Morency LP. Multimodal machine learning: a survey and taxonomy. IEEE Trans Pattern Anal Mach Intell. 2018 - PubMed
    1. Aiello M, Cavaliere C, D'Albore A, et al. The Challenges of Diagnostic Imaging in the Era of Big Data. J Clin Med. 2019;8(3):316. - PMC - PubMed
    1. Gatenby RA, Grove O, Gillies RJ. Quantitative imaging in cancer evolution and ecology. Radiology. 2013;1:8–15. - PMC - PubMed

Publication types

LinkOut - more resources