. 2019 Sep 9;63(12):e01193-19.
doi: 10.1128/AAC.01193-19. Epub 2019 Oct 7.

HAMLET, a protein complex from human milk has bactericidal activity and enhances the activity of antibiotics against pathogenic Streptococci

Affiliations

HAMLET, a protein complex from human milk has bactericidal activity and enhances the activity of antibiotics against pathogenic Streptococci

Feiruz Alamiri et al. Antimicrob Agents Chemother. .

Abstract

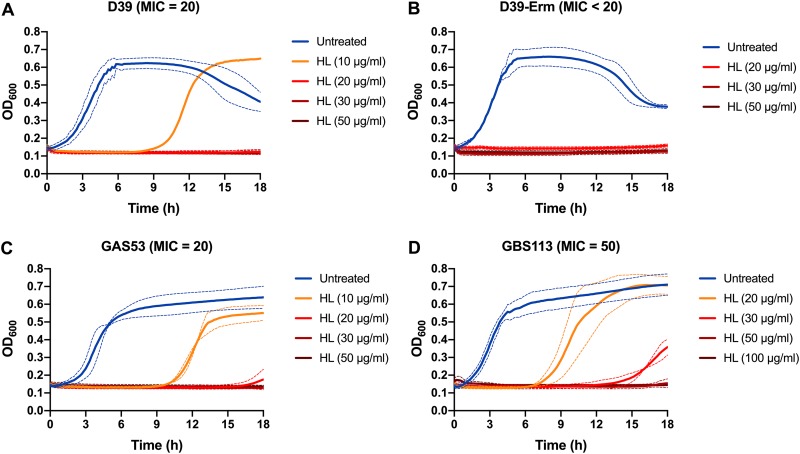
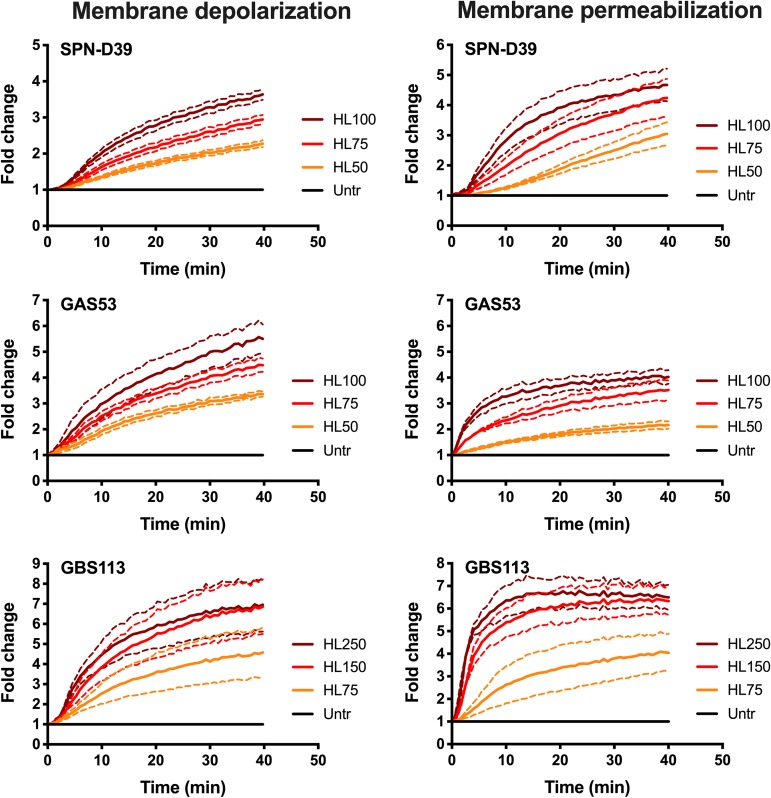
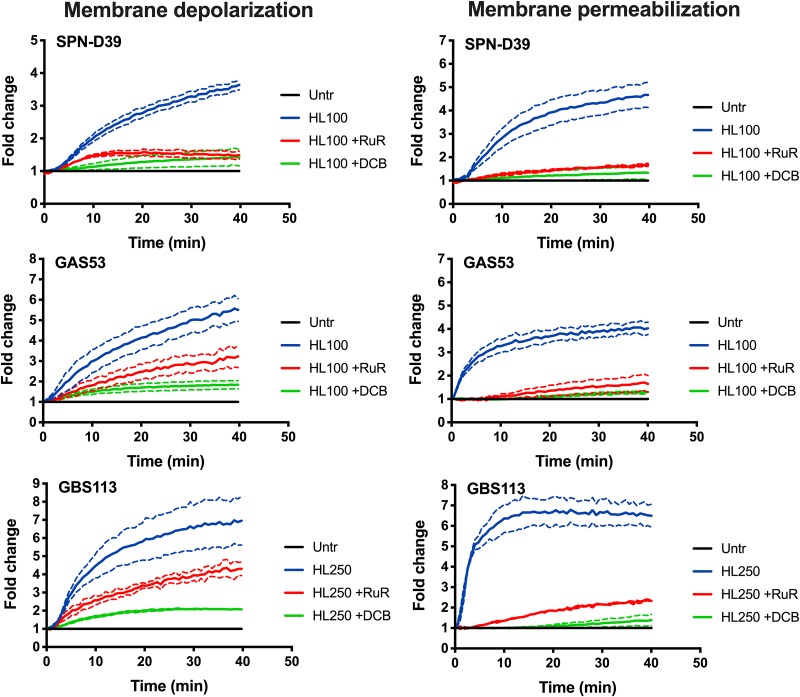
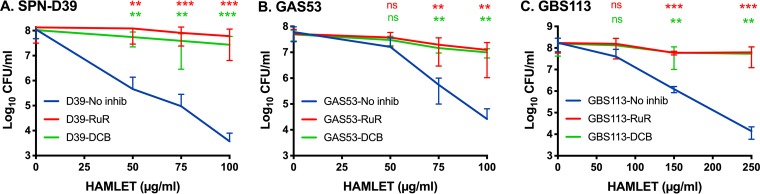
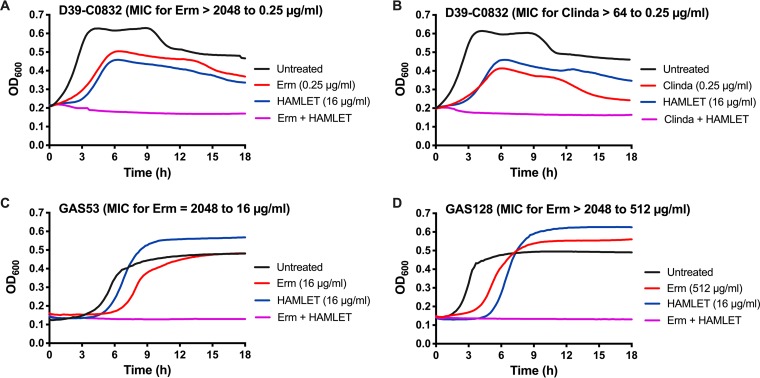
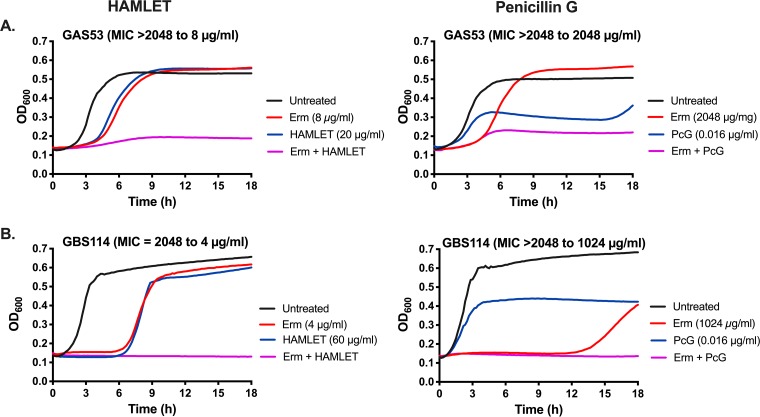
HAMLET is a protein-lipid complex derived from human milk that was first described for its tumoricidal activity. Later studies showed that HAMLET also has direct bactericidal activity against select species of bacteria, with highest activity against Streptococcus pneumoniae Additionally, HAMLET in combination with various antimicrobial agents can make a broader range of antibiotic-resistant bacterial species sensitive to antibiotics. Here, we show that HAMLET has direct antibacterial activity not only against pneumococci, but also against Streptococcus pyogenes (GAS) and Streptococcus agalactiae (GBS). Analogous to pneumococci, HAMLET-treatment of GAS and GBS resulted in depolarization of the bacterial membrane followed by membrane permeabilization and death that could be inhibited by calcium and sodium transport inhibitors. Treatment of clinical antibiotic-resistant isolates of S. pneumoniae, GAS, and GBS with sublethal concentrations of HAMLET in combination with antibiotics decreased the minimal inhibitory concentrations of the respective antibiotic into the sensitive range. This effect could also be blocked by ion transport inhibitors, suggesting that HAMLET's bactericidal and combination treatment effects used similar mechanisms. Finally, we show that HAMLET potentiated the effects of erythromycin against erythromycin-resistant bacteria more effectively than it potentiated killing by penicillin G of bacteria resistant to penicillin G. These results show for the first time that HAMLET effectively kills three different species of pathogenic Streptococci using similar mechanisms and also potentiate the activity of macrolides and lincosamides more effectively than combination treatment with beta-lactams. These findings suggest a potential therapeutic role for HAMLET in repurposing antibiotics currently causing treatment failures in patients.


Figures

FIG 1
FIG 1
MIC growth curves of pathogenic streptococci. Combined MIC growth curves for D39 (A), D39-C0832 (Erm resistant) (B), GAS clinical isolate 53 (C), and GBS clinical isolate 113 (D) in the presence of increasing concentrations of HAMLET (HL). Bacteria were grown in the presence of HAMLET for 18 h at 37°C, with the absorbance at 600 nm (OD600) recorded every 10 min. The lowest concentration of HAMLET at which no growth was detected over 18 h was considered the MIC. The figure shows combined graphs for each strain based on two (D39-C0832), three (for the GAS and GBS strains), or four (for D39) separate experiments run in duplicate wells. The OD600 is represented by a solid line, and dashed lines of the same color represent the standard deviation.
FIG 2
FIG 2
HAMLET-induced membrane depolarization and permeabilization in S. pneumoniae, GAS, and GBS. Bacteria were grown in THY, washed in PBS, and resuspended in PBS with 25 mM glucose to energize the cells. DiBAC4(3) and propidium iodide were added to the bacterial suspension, and the cells were allowed to equilibrate for 40 min at 37°C before the experiment was started. At 0 min, HAMLET was added at 50, 75, and 100 μg/ml (labeled HL50, HL75, and HL100, respectively, in the figure) for SPN-D39 and GAS 53 and at 75, 150, and 250 μg/ml (labeled HL75, HL150, and HL250, respectively, in the figure) for GBS 113. (Left panels) Membrane polarity was measured every 30 s using a 485/20-nm excitation and 528/20-nm emission filter combination for 40 min. Depolarization of the membrane is detected through an increased DiBAC4(3) fluorescence over time. (Right panels) Membrane integrity was recorded every 30 s using a 528/20-nm excitation and 605/20-nm emission filter combination for 40 min. Membrane disruption was detected through increased propidium (PI) fluorescence intensity over time. The graphs show the average of results from at least 3 experiments for each strain as a solid line, with dashed lines of the same color representing the standard deviations. Untr, untreated.
FIG 3
FIG 3
Inhibition of membrane depolarization and permeabilization by calcium and sodium transport inhibitors. Bacteria were grown in THY, washed, and resuspended in PBS with 25 mM glucose to energize the cells. DiBAC4(3) and propidium iodide were added to the bacterial suspension, and the cells were allowed to equilibrate for 40 min at 37°C before the experiment was started. At 0 min, the bacterial cells were pretreated with inhibitors (30 μM [final concentration] ruthenium red [RuR] and 25 μM [final concentration] dichlorobenzamil [DCB]), after which 100 μg/ml (6 μM; for SPN-D39 and GAS strains) and 250 μg/ml (15 μM; for GBS) of HAMLET was added. The samples were immediately read in a fluorescence plate reader every 30 s for 40 min. (Left panels) Membrane polarity was measured using a 485/20-nm excitation and 528/20-nm emission filter combination, and depolarization of the membrane was detected through increased DiBAC4(3) fluorescence over time. (Right panels) Membrane integrity was recorded using a 528/20-nm excitation and 605/20-nm emission filter, and membrane disruption was detected through an increased propidium (PI) fluorescence intensity over time. The graphs show the average of results from 3 experiments for each strain as a solid line, with dashed lines of the same color representing the standard deviation.
FIG 4
FIG 4
Inhibition of HAMLET-induced death. Bacteria were grown in THY and washed and resuspended in PBS with 25 mM glucose to keep the bacteria energized. The bacterial suspensions were prepared to obtain a starting concentration of approximately 1 × 108 CFU/ml. The bacteria were preincubated for 5 min at 37°C in the presence or absence of ruthenium red (RuR; 30 μM; red line) or dichlorobenzamil (DCB; 25 μM; green line). Then, increasing concentrations of HAMLET were added to wells of each bacterial strain, and the bacteria were allowed to incubate for 1 h at 37°C. Bacteria were then serially diluted, dilutions were plated onto agar, and colonies were allowed to grow for 24 to 48 h. Viable CFU were counted, and the concentration in numbers of CFU per milliliter was calculated and is depicted in the graphs. (A) S. pneumoniae D39, (B) GAS 53, and (C) GBS 113. The results represent the mean data from at least 5 separate experiments, with standard deviations. Statistical comparison of groups was performed using Welch’s ANOVA, with Dunnett’s multiple-comparison test used for comparisons of individual groups. P values are presented from Dunnett’s comparison of experiments with no inhibitor (No inhib) versus RuR (red asterisks) and no inhibitor versus DCB (green asterisks). *, P < 0.05; **, P < 0.01; ***, P < 0.001; ns, no significant difference.
FIG 5
FIG 5
HAMLET and erythromycin or clindamycin combination treatment of erythromycin-resistant streptococci. Each bacterial strain was grown in THY in the presence of increasing concentrations of erythromycin (1 μg/ml to 2,048 μg/ml) or clindamycin (0.125 μg/ml to 64 μg/ml) in a 2-fold dilution series with or without the addition of sub-MICs of HAMLET. For each graph, the untreated bacterial growth curve is shown with a black line, the specific erythromycin or clindamycin concentration that resulted in no growth in the presence of HAMLET is shown with a red line, the sub-MIC HAMLET concentration used is shown with a blue line, and the combination treatment (erythromycin [Erm] or clindamycin [Clinda] and HAMLET) is shown with a purple line. In the title of each graph is the name of each strain, the MIC of erythromycin without HAMLET present, and the resulting MIC in the presence of HAMLET. (A and B) D39-C0832 (D39 carrying an ermB cassette) treated with erythromycin (A) or clindamycin (B) alone or in combination with HAMLET. (C and D) GAS 53 (C) and GBS 113 (D) treated with erythromycin alone or in combination with HAMLET. The figure shows a representative graph for each strain and the MIC shift after combination treatment was determined from at least 3 separate experiments in duplicate. The complete data set is presented in Tables 3 and 4.
FIG 6
FIG 6
Combination treatment of erythromycin-resistant streptococci with erythromycin and HAMLET or penicillin G. Each bacterial strain was grown in THY in the presence of increasing concentrations of erythromycin (1 μg/ml to 2,048 μg/ml) in a 2-fold dilution series with or without the addition of sub-MICs of HAMLET or penicillin G (PcG). For each graph, the untreated bacterial growth curve is shown with a black line, the specific erythromycin concentration that resulted in no growth in the presence of HAMLET or PcG is shown with a red line, the sub-MIC HAMLET or PcG concentrations used are shown with a blue line, and the combination treatment (erythromycin and HAMLET or PcG) is shown with a purple line. In the title of each graph is the name of each strain, the MIC of erythromycin without HAMLET or PcG, and the resulting MIC in the presence of HAMLET or PcG at the concentration depicted in the graph legend. (A) GAS 53 treated with erythromycin alone or in combination with either HAMLET (left) or PcG (right); (B) GBS 114 treated with erythromycin alone or in combination with either HAMLET (left) or PcG (right). The figure shows a representative graph for each strain and the MIC shift after combination treatment was determined from at least 3 separate experiments in duplicate; the full data set is presented in Results.

References

    1. WHO. 2014. Antimicrobial resistance: global report of surveillance. WHO, Geneva, Switzerland.
    1. Tacconelli E, Carmeli Y, Harbarth S, Kahlmeter G, Kluytman J, Mendelson M, Pulcini C, Singh N, Theuretzbacker U. 2017. Global priority list of antibiotic-resistant bacteria to guide research, discovery, and development of new antibiotics. WHO, Geneva, Switzerland.
    1. Håkansson A, Svensson M, Mossberg AK, Sabharwal H, Linse S, Lazou I, Lönnerdal B, Svanborg C. 2000. A folding variant of alpha-lactalbumin with bactericidal activity against Streptococcus pneumoniae. Mol Microbiol 35:589–600. doi:10.1046/j.1365-2958.2000.01728.x. - DOI - PubMed
    1. Clementi EA, Marks LR, Duffey ME, Hakansson AP. 2012. A novel initiation mechanism of death in Streptococcus pneumoniae induced by the human milk protein-lipid complex HAMLET and activated during physiological death. J Biol Chem 287:27168–27182. doi:10.1074/jbc.M112.371070. - DOI - PMC - PubMed
    1. Meikle V, Mossberg AK, Mitra A, Hakansson AP, Niederweis M. 2018. A protein complex from human milk enhances the activity of antibiotics and drugs against Mycobacterium tuberculosis. Antimicrob Agents Chemother 63:e01846-18. doi:10.1128/AAC.01846-18. - DOI - PMC - PubMed

LinkOut - more resources