. 2019 Nov 18;87(12):e00482-19.
doi: 10.1128/IAI.00482-19. Print 2019 Dec.

Splenic Innate B1 B Cell Plasmablasts Produce Sustained Granulocyte-Macrophage Colony-Stimulating Factor and Interleukin-3 Cytokines during Murine Malaria Infections

Affiliations

Splenic Innate B1 B Cell Plasmablasts Produce Sustained Granulocyte-Macrophage Colony-Stimulating Factor and Interleukin-3 Cytokines during Murine Malaria Infections

Shu Shien Chin et al. Infect Immun. .

Abstract

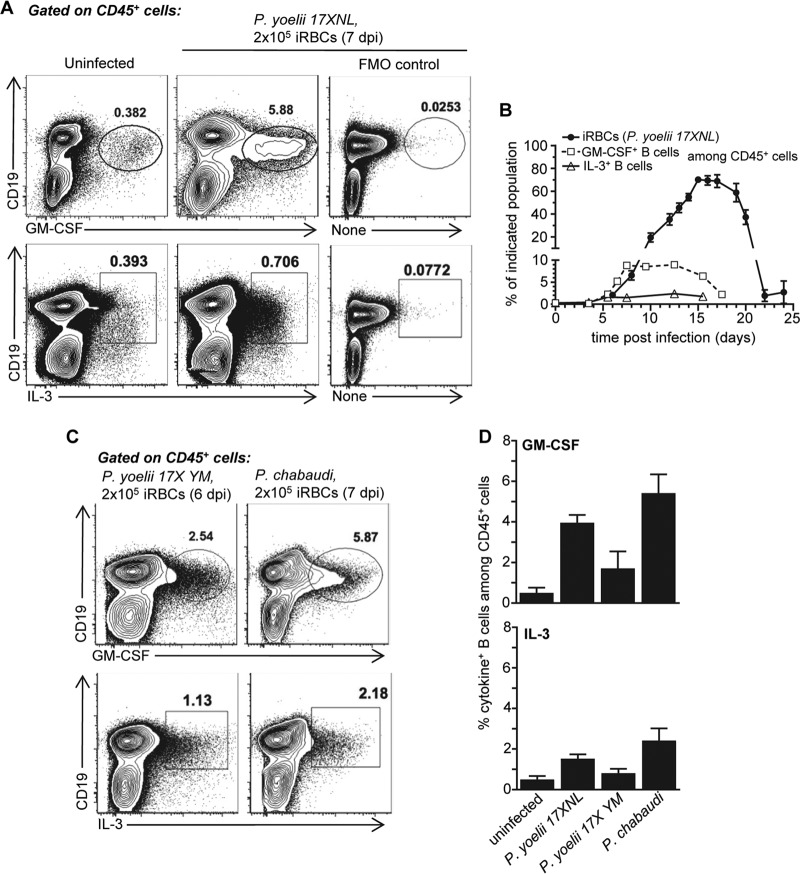
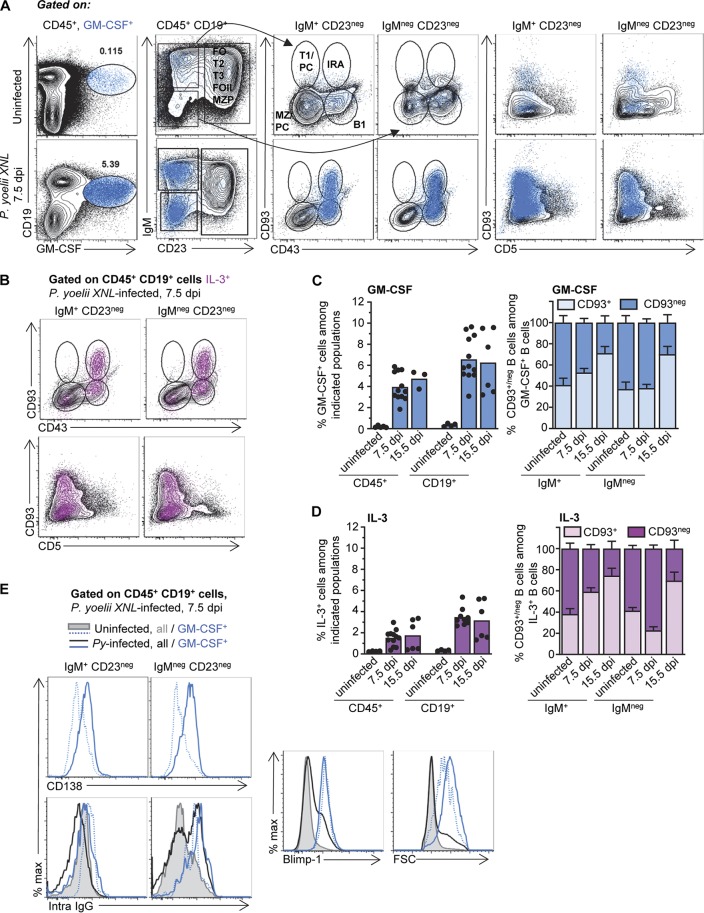
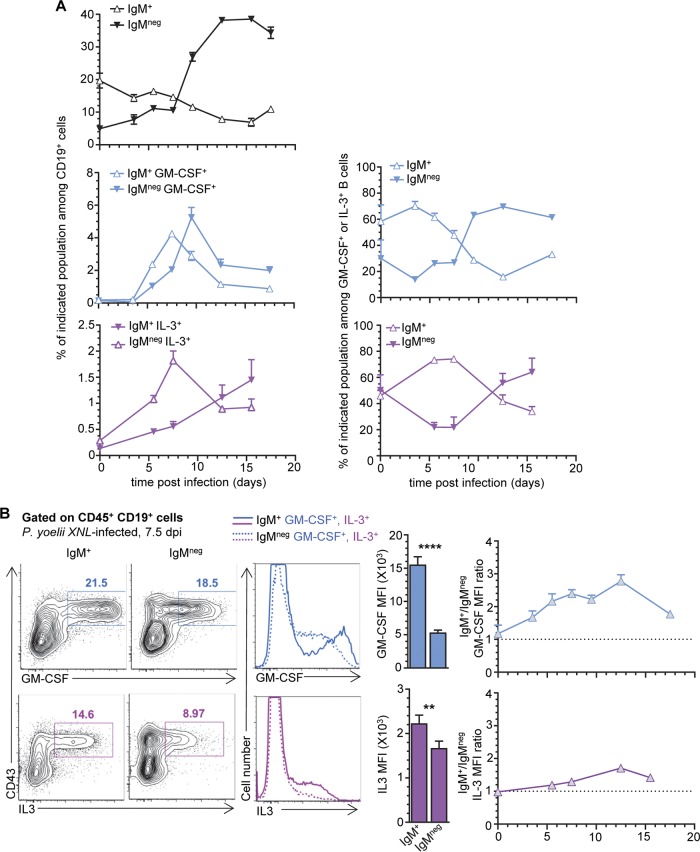
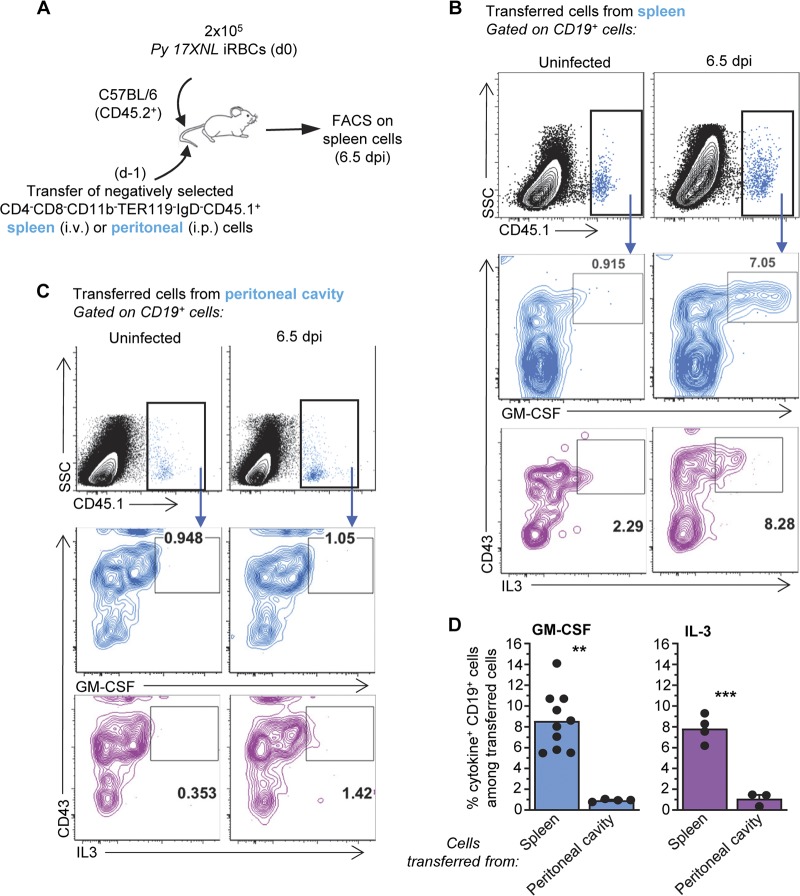
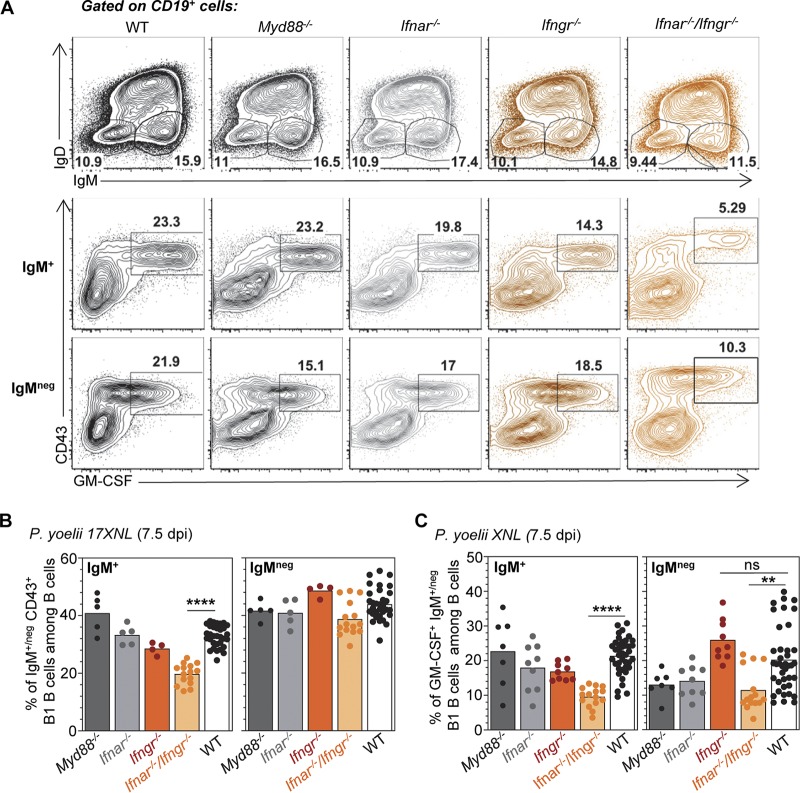
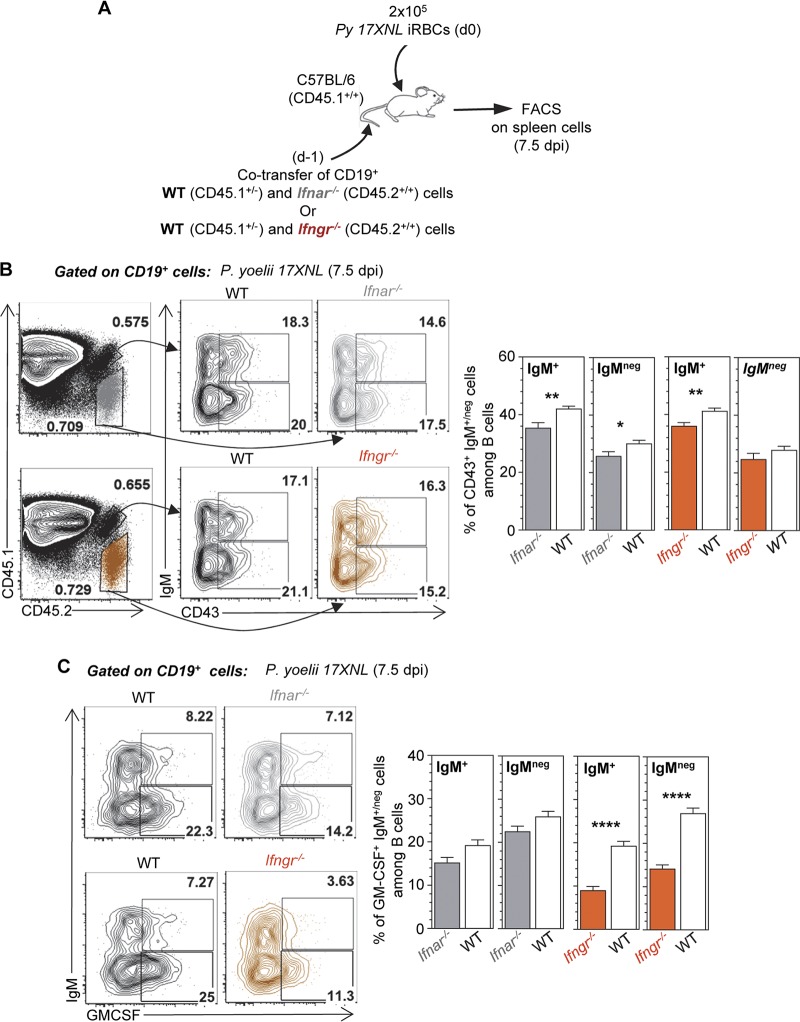
The physiopathology of malaria, one of the most deadly human parasitic diseases worldwide, is complex, as it is a systemic disease involving multiple parasitic stages and hosts and leads to the activation of numerous immune cells and release of inflammatory mediators. While some cytokines increased in the blood of patients infected with Plasmodium falciparum have been extensively studied, others, such as granulocyte-macrophage colony-stimulating factor (GM-CSF) and interleukin-3 (IL-3), have not received much attention. GM-CSF and IL-3 belong to the β common (βc/CD131) chain family of cytokines, which exhibit pleiotropic functions, including the regulation of myeloid cell growth, differentiation, and activation. GM-CSF can be secreted by multiple cell types, whereas IL-3 is mostly restricted to T cells, yet innate response activator (IRA) B cells, a subset of innate B1 B cells, also produce significant amounts of these cytokines during bacterial sepsis via Toll-like receptor 4 (TLR4)/MyD88 sensing of lipopolysaccharides. Herein, using murine models of malaria, we report a sustained production of GM-CSF and IL-3 from IgM+ and IgM-/IgG+ CD138+ Blimp-1+ innate B1b B cell plasmablasts. IgM+ B1b B cells include IRA-like and non-IRA B cells and express higher levels of both cytokines than do their IgG+ counterparts. Interestingly, as infection progresses, the relative proportion of IgM+ B1 B cells decreases while that of IgG+ plasmablasts increases, correlating with potential isotype switching of GM-CSF- and IL-3-producing IgM+ B1 B cells. GM-CSF/IL-3+ B1 B cells originate in the spleen of infected mice and are partially dependent on type I and type II interferon signaling to produce both cytokines. These data reveal that GM-CSF and IL-3 are produced during malaria infections, initially from IgM+ and then from IgG+ B1b B cell plasmablasts, which may represent important emergency cellular sources of these cytokines. These results further highlight the phenotypic heterogeneity of innate B1 B cell subsets and of their possible fates in a relevant murine model of parasitic infection in vivo.

Keywords: B1 B cells; GM-CSF; IL-3; IRA B cells; Plasmodium; interferon gamma; malaria; plasmablasts; type I interferon.


Figures

FIG 1
FIG 1
GM-CSF and IL-3 are produced by B cells during malaria infections. Wild-type (WT) C57BL/6 (B6) mice were inoculated with infected red blood cells (iRBCs) of the indicated murine Plasmodium strain (P. yoelii 17XNL, P. yoelii 17X YM, or P. chabaudi) or injected with the same numbers of uninfected RBCs (uninfected). At indicated times postinfection, spleen cells were harvested and stained for cell surface CD45 and CD19 and intracellular GM-CSF or IL-3. (A) Intracellular GM-CSF or IL-3 staining among CD19+ B cells, gated on CD45+ live cells in the different experimental groups. Fluorescence minus 1 (FMO) is shown for the intracellular cytokine staining. (B) Kinetics of GM-CSF and IL-3 production by CD19+ B cells and blood parasitemia following P. yoelii infection. (C) GM-CSF and IL-3 production from B cells after infection with indicated Plasmodium strains. (D) Average proportion of GM-CSF- or IL-3-producing B cells among CD45+ splenic cells 6 (P. yoelii 17X YM) or 7 (P. yoelii 17XNL, P. chabaudi) days postinfection (dpi) across experiments (n = 3 to 12 mice). In all experiments, representative FACS dot plots of 2 to 5 independent replicate experiments with at least 3 mice are presented. Graphs show the average of the results from each experiment along with the standard error of the mean (SEM).
FIG 2
FIG 2
B1b B cell plasmablasts produce GM-CSF and IL-3 during P. yoelii infection. WT B6 mice were inoculated with P. yoelii 17XNL iRBCs or injected with the same numbers of uninfected RBCs (uninfected). (A to C) Spleens from uninfected or day 7.5 P. yoelii-infected mice were harvested and the cells stained for cell surface CD45, CD19, IgM, CD23, CD43, CD93, and CD5 and intracellular GM-CSF or IL-3. (A and B) Dot plots are shown with the successive gating strategy used (FO, follicular; T1/T2/T3, transitional 1/2/3; MZP, marginal zone precursor; MZ, marginal zone; PC, plasma cell; IRA, innate response activator). GM-CSF+ (blue) or IL-3+ (fuchsia) cells are overlaid on the indicated populations. (C and D) Bar graphs summarize the frequency of GM-CSF-producing (C) or IL-3-producing (D) cells among indicated cell populations (left) and the proportion of GM-CSF+ or IL-3+ IgM+/− cells that express CD93 or not (right) in uninfected versus P. yoelii-infected mice. (E) Spleen cells from uninfected or day 7.5 P. yoelii-infected mice were stained for cell surface CD45, CD19, IgM, CD23, and CD138 and intracellular GM-CSF, IgG, and Blimp-1. In all experiments, representative FACS dot plots of 1 mouse across 5 replicate experiments are shown (n = 8 to 14). Graphs show the average of the results from each experiment, with each dot representing 1 individual mouse or with the mean ± SEM. max, maximum.
FIG 3
FIG 3
Expansion and contraction of IgM+ GM-CSF/IL-3+ B1b B cell plasmablasts inversely correlate with those of the IgM/IgG+ counterparts. WT B6 mice were inoculated with P. yoelii iRBCs or injected with the same amount of uninfected RBCs (uninfected). Spleens from uninfected or P. yoelii-infected mice were harvested at the indicated days, and cells were stained for cell surface CD19, IgM, CD23, CD43, and CD93 and intracellular GM-CSF or IL-3 in some but not all experiments. (A) Top left graph shows the proportion of indicated IgM+ or IgM CD19+ B cells over time postinfection. The middle and lower graphs on the left show the proportions of the indicated IgM+/− GM-CSF+ or IL-3+ cell populations among B cells over time postinfection. Right graphs show the relative proportions of IgM+ versus IgM GM-CSF+ or IL-3+ B cells. (B) Representative dot plots of intracellular GM-CSF or IL-3 staining of IgM+ or IgM B cells from spleen of day 7.5 P. yoelii-infected mice. Bar graphs show the corresponding average mean fluorescence intensity (MFI) for indicated intracellular cytokine. The right graphs depict the ratios of GM-CSF or IL-3 MFI in IgM+ versus IgM B cells over time after infection. Two to 5 independent replicate experiments with at least 3 mice are presented. Graphs show the average of the results from each experiment along with the SEM. P values are indicated when applicable.
FIG 4
FIG 4
GM-CSF- and IL-3-producing B cells originate from the spleen of P. yoelii-infected mice. (A) Schematic of experimental design. i.v., intravenous. (B and C) Spleen cells from P. yoelii-infected or uninfected mice were stained for cell surface CD45.1, CD19, and CD43 and intracellular GM-CSF or IL-3. Data show a representative FACS dot plot of GM-CSF+ or IL-3+ cells after gating on transferred CD45.1+ cells isolated from the spleen (B) or peritoneal cavity (C). SSC, side scatter. (D) Average proportion of GM-CSF- or IL-3-producing CD19+ B cells among transferred cells across two independent replicate experiments, with each dot featuring an individual mouse (n = 3 to 10 mice). Graphs shown the average of the results from each experiment along with the SEM. P values are indicated when applicable.
FIG 5
FIG 5
Type I and II interferon signaling enhances the generation of B1 B cell plasmablasts and their production of GM-CSF during malaria infection. Indicated knockout or WT mice (all B6 background) received 2 × 105 P. yoelii 17XNL-infected iRBCs, and 7.5 days later, spleens were harvested and stained for cell surface CD45, CD19, IgM, IgD, and CD43 and intracellular GM-CSF. (A) Representative FACS dot plots across 2 to 3 independent replicate experiments are shown. (B and C) The average result across all experiments is shown, with each dot representing an individual mouse (n = 4 to 19 for knockout [KO] mice, n = 44 for WT mice).
FIG 6
FIG 6
Cell-intrinsic interferon signaling enhances the generation of B1 B cell plasmablasts, while production of GM-CSF is promoted by both cell-intrinsic IFN-γ and cell-extrinsic type I interferon signaling during P. yoelii infection. (A) Schematic of experimental design. (B and C) Spleen cells from P. yoelii-infected (day 7.5) or uninfected mice were stained for cell surface CD45.1, CD45.2, CD19, IgM, and CD43 and intracellular GM-CSF. Data show a representative FACS dot plot of CD43+ (B) or GM-CSF+ (C) CD19+ B cells after gating on transferred cells. Graphs show the average of the results from one experiment with 5 mice along with the SEM. P values are indicated when applicable.

References

    1. Chaussabel D, Pajak B, Vercruysse V, Bisseye C, Garze V, Habib M, Goldman M, Moser M, Vray B. 2003. Alteration of migration and maturation of dendritic cells and T-cell depletion in the course of experimental Trypanosoma cruzi infection. Lab Invest 83:1373–1382. doi:10.1097/01.LAB.0000087587.93781.6F. - DOI - PubMed
    1. Crompton PD, Moebius J, Portugal S, Waisberg M, Hart G, Garver LS, Miller LH, Barillas-Mury C, Pierce SK. 2014. Malaria immunity in man and mosquito: insights into unsolved mysteries of a deadly infectious disease. Annu Rev Immunol 32:157–187. doi:10.1146/annurev-immunol-032713-120220. - DOI - PMC - PubMed
    1. Lamb TJ, Brown DE, Potocnik AJ, Langhorne J. 2006. Insights into the immunopathogenesis of malaria using mouse models. Expert Rev Mol Med 8:1–22. doi:10.1017/S1462399406010581. - DOI - PubMed
    1. Spaulding E, Fooksman D, Moore JM, Saidi A, Feintuch CM, Reizis B, Chorro L, Daily J, Lauvau G. 2016. STING-licensed macrophages prime type I IFN production by plasmacytoid dendritic cells in the bone marrow during severe Plasmodium yoelii malaria. PLoS Pathog 12:e1005975. doi:10.1371/journal.ppat.1005975. - DOI - PMC - PubMed
    1. Manning L, Laman M, Davis WA, Davis TM. 2014. Clinical features and outcome in children with severe Plasmodium falciparum malaria: a meta-analysis. PLoS One 9:e86737. doi:10.1371/journal.pone.0086737. - DOI - PMC - PubMed

Publication types

Substances