

Evidence for sharp increase in the economic damages of extreme natural disasters
- PMID: 31591192
- PMCID: PMC6815159
- DOI: 10.1073/pnas.1907826116
Evidence for sharp increase in the economic damages of extreme natural disasters
Abstract
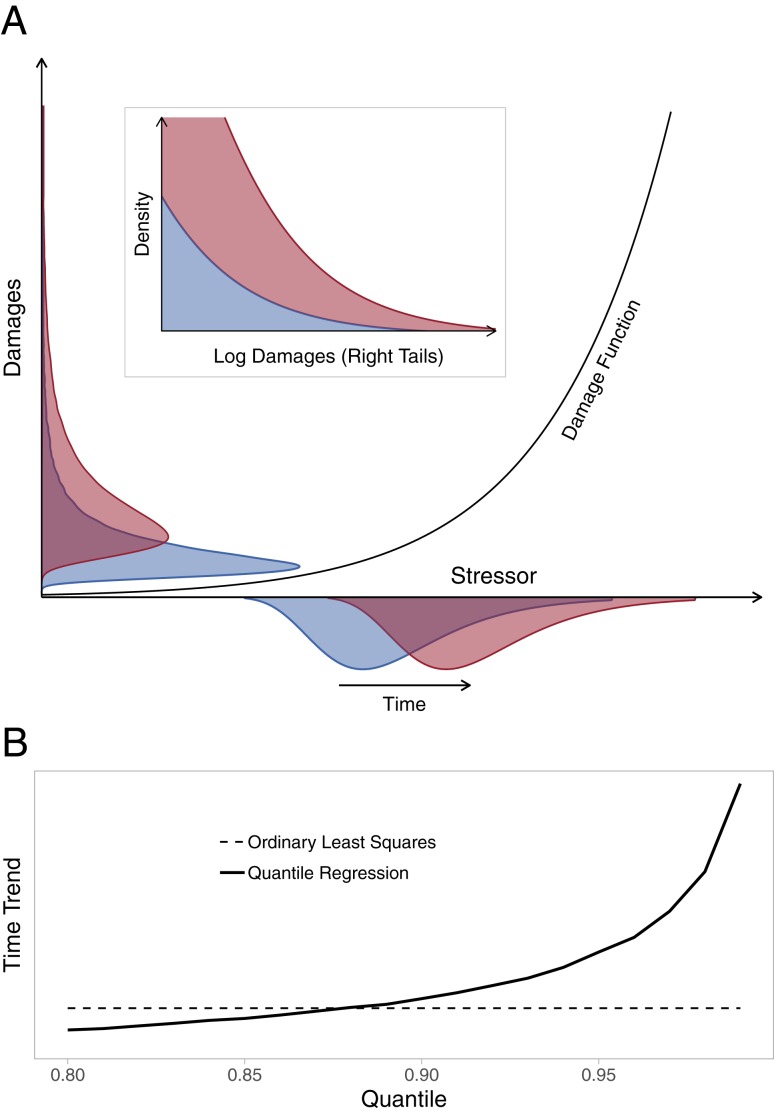
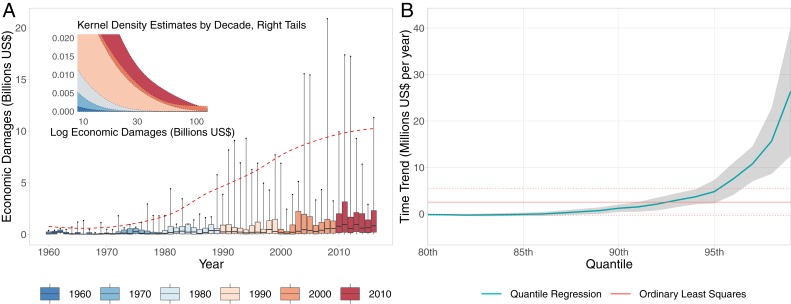
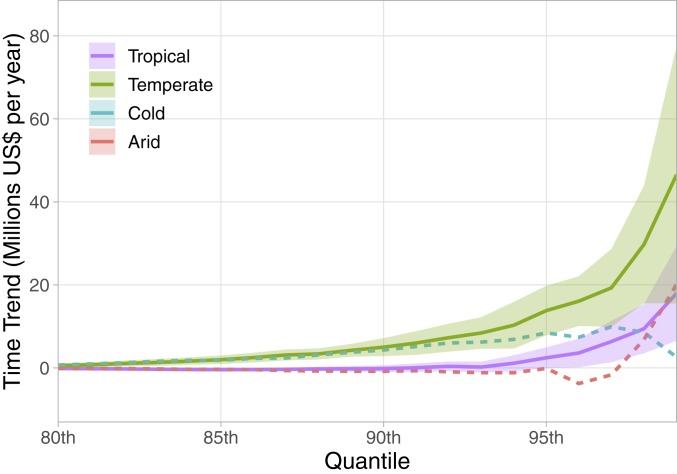
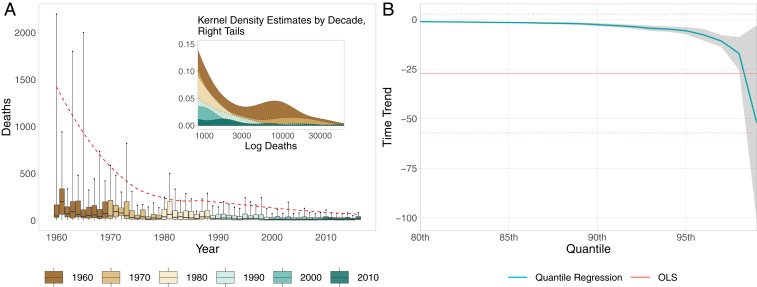
Climate change has increased the frequency and intensity of natural disasters. Does this translate into increased economic damages? To date, empirical assessments of damage trends have been inconclusive. Our study demonstrates a temporal increase in extreme damages, after controlling for a number of factors. We analyze event-level data using quantile regressions to capture patterns in the damage distribution (not just its mean) and find strong evidence of progressive rightward skewing and tail-fattening over time. While the effect of time on averages is hard to detect, effects on extreme damages are large, statistically significant, and growing with increasing percentiles. Our results are consistent with an upwardly curved, convex damage function, which is commonly assumed in climate-economics models. They are also robust to different specifications of control variables and time range considered and indicate that the risk of extreme damages has increased more in temperate areas than in tropical ones. We use simulations to show that underreporting bias in the data does not weaken our inferences; in fact, it may make them overly conservative.
Keywords: climate change; economic damages; natural disasters; tail effects.
Copyright © 2019 the Author(s). Published by PNAS.
Conflict of interest statement
The authors declare no competing interest.
Figures

Comment in
-
Reply to Geiger and Stomper: On capital intensity and observed increases in the economic damages of extreme natural disasters.Proc Natl Acad Sci U S A. 2020 Mar 24;117(12):6314-6315. doi: 10.1073/pnas.1922722117. Epub 2020 Mar 10. Proc Natl Acad Sci U S A. 2020. PMID: 32156737 Free PMC article. No abstract available.
-
Rising economic damages of natural disasters: Trends in event intensity or capital intensity?Proc Natl Acad Sci U S A. 2020 Mar 24;117(12):6312-6313. doi: 10.1073/pnas.1922152117. Epub 2020 Mar 10. Proc Natl Acad Sci U S A. 2020. PMID: 32156738 Free PMC article. No abstract available.
Similar articles
-
[Natural disasters and their costs for healthcare establishments in Brazil, 2000 to 2015].Cad Saude Publica. 2020;36(7):e00133419. doi: 10.1590/0102-311x00133419. Epub 2020 Jul 17. Cad Saude Publica. 2020. PMID: 32696825 Portuguese.
-
Extreme events in the context of climate change.Public Health Res Pract. 2018 Dec 6;28(4):2841825. doi: 10.17061/phrp2841825. Public Health Res Pract. 2018. PMID: 30652185
-
Reply to Geiger and Stomper: On capital intensity and observed increases in the economic damages of extreme natural disasters.Proc Natl Acad Sci U S A. 2020 Mar 24;117(12):6314-6315. doi: 10.1073/pnas.1922722117. Epub 2020 Mar 10. Proc Natl Acad Sci U S A. 2020. PMID: 32156737 Free PMC article. No abstract available.
-
A Comparative Analysis of Climate-Risk and Extreme Event-Related Impacts on Well-Being and Health: Policy Implications.Int J Environ Res Public Health. 2018 Feb 13;15(2):331. doi: 10.3390/ijerph15020331. Int J Environ Res Public Health. 2018. PMID: 29438345 Free PMC article. Review.
-
Scientific evidence on natural disasters and health emergency and disaster risk management in Asian rural-based area.Br Med Bull. 2019 Mar 1;129(1):91-105. doi: 10.1093/bmb/ldz002. Br Med Bull. 2019. PMID: 30753325 Free PMC article. Review.
Cited by
-
Effects of experimental drought and plant diversity on multifunctionality of a model system for crop rotation.Sci Rep. 2024 May 4;14(1):10265. doi: 10.1038/s41598-024-60233-0. Sci Rep. 2024. PMID: 38704461 Free PMC article.
-
Developing the Fear of Disasters Scale and Exploring Its Psychometric Properties.Depress Anxiety. 2024 Nov 25;2024:5565403. doi: 10.1155/2024/5565403. eCollection 2024. Depress Anxiety. 2024. PMID: 40226753 Free PMC article.
-
Juvenile Plant-Microbe Interactions Modulate the Adaptation and Response of Forest Seedlings to Rapid Climate Change.Plants (Basel). 2024 Jan 9;13(2):175. doi: 10.3390/plants13020175. Plants (Basel). 2024. PMID: 38256729 Free PMC article. Review.
-
Specifying evacuation return and home-switch stability during short-term disaster recovery using location-based data.Sci Rep. 2022 Sep 26;12(1):15987. doi: 10.1038/s41598-022-20384-4. Sci Rep. 2022. PMID: 36163362 Free PMC article.
-
Rising economic damages of natural disasters: Trends in event intensity or capital intensity?Proc Natl Acad Sci U S A. 2020 Mar 24;117(12):6312-6313. doi: 10.1073/pnas.1922152117. Epub 2020 Mar 10. Proc Natl Acad Sci U S A. 2020. PMID: 32156738 Free PMC article. No abstract available.
References
-
- Van Aalst M. K., The impacts of climate change on the risk of natural disasters. Disasters 30, 5–18 (2006). - PubMed
-
- Intergovernmental Panel on Climate Change , Climate Change 2007: Impacts, Adaptation and Vulnerability. Contribution of Working Group II to the Fourth Assessment Report of the Intergovernmental Panel on Climate Change (Cambridge University Press, Cambridge, United Kingdom, 2007).
-
- Intergovernmental Panel on Climate Change , Managing The Risks of Extreme Events and Disasters to Advance Climate Change Adaptation: Special Report of the Intergovernmental Panel on Climate Change (Cambridge University Press, Cambridge, United Kingdom, 2012). - PubMed
-
- Otto F. E. L., et al. , Attributing high-impact extreme events across timescales—a case study of four different types of events. Clim. Change 149, 399–412 (2018).
-
- Thomalla F., Downing T., Spanger-Siegfried E., Han G., Rockström J., Reducing hazard vulnerability: Towards a common approach between disaster risk reduction and climate adaptation. Disasters 30, 39–48 (2006). - PubMed
Publication types
MeSH terms
LinkOut - more resources
Full Text Sources
