. 2019 Oct 22;116(43):21539-21544.
doi: 10.1073/pnas.1907566116. Epub 2019 Oct 7.

Lipid-targeting pleckstrin homology domain turns its autoinhibitory face toward the TEC kinases

Affiliations

Lipid-targeting pleckstrin homology domain turns its autoinhibitory face toward the TEC kinases

Neha Amatya et al. Proc Natl Acad Sci U S A. .

Abstract

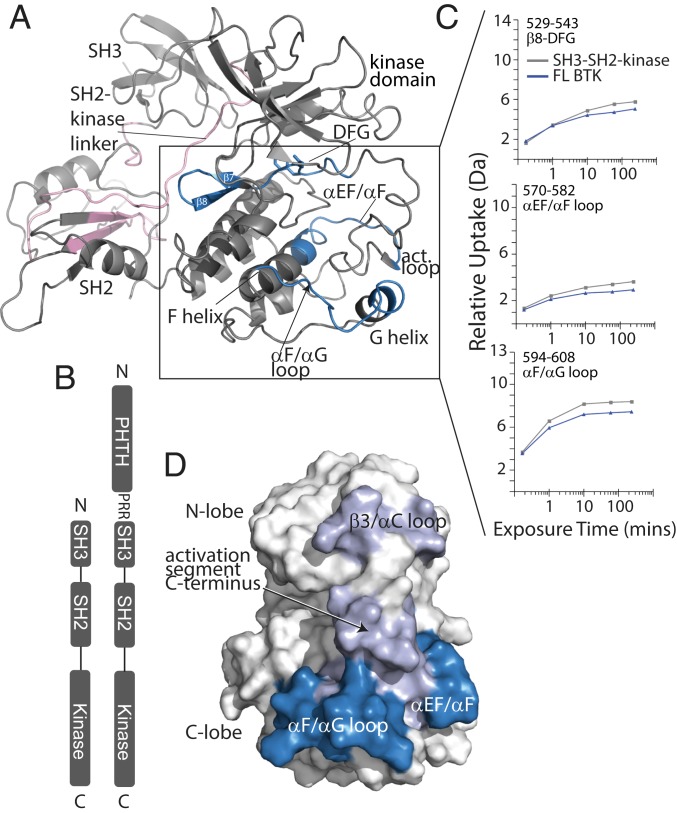
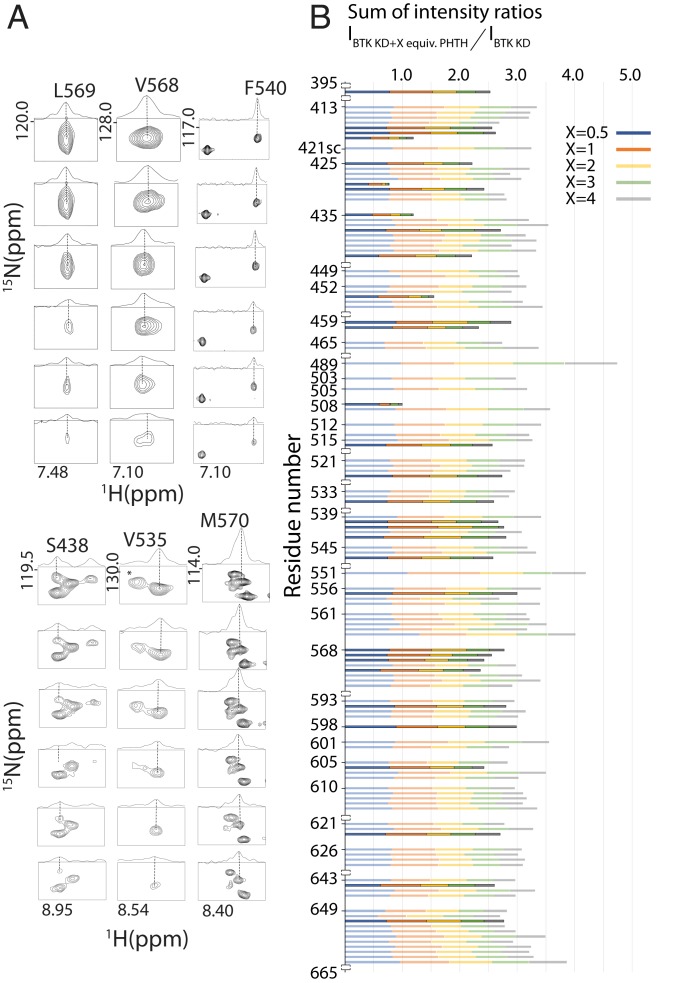
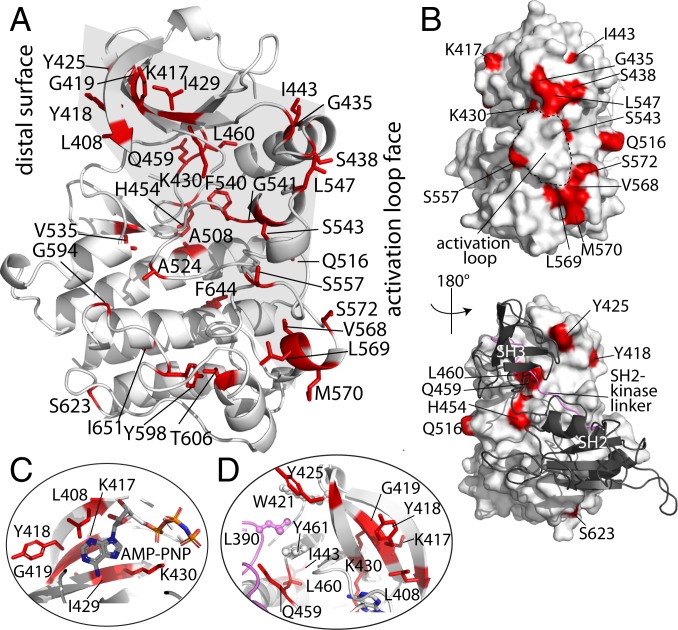
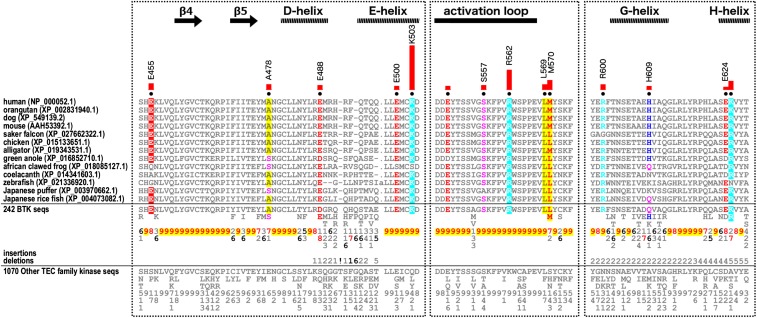
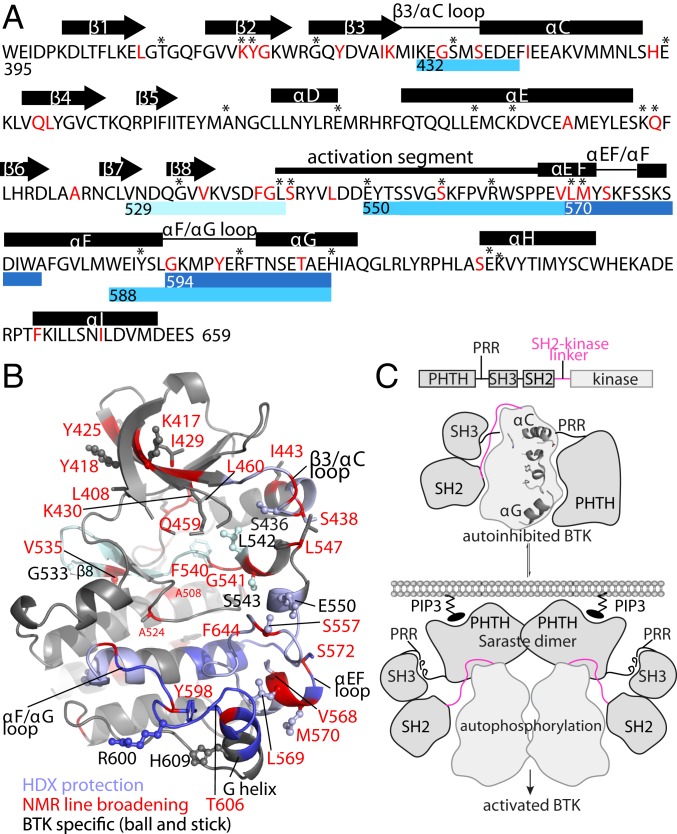
The pleckstrin homology (PH) domain is well known for its phospholipid targeting function. The PH-TEC homology (PHTH) domain within the TEC family of tyrosine kinases is also a crucial component of the autoinhibitory apparatus. The autoinhibitory surface on the PHTH domain has been previously defined, and biochemical investigations have shown that PHTH-mediated inhibition is mutually exclusive with phosphatidylinositol binding. Here we use hydrogen/deuterium exchange mass spectrometry, nuclear magnetic resonance (NMR), and evolutionary sequence comparisons to map where and how the PHTH domain affects the Bruton's tyrosine kinase (BTK) domain. The data map a PHTH-binding site on the activation loop face of the kinase C lobe, suggesting that the PHTH domain masks the activation loop and the substrate-docking site. Moreover, localized NMR spectral changes are observed for non-surface-exposed residues in the active site and on the distal side of the kinase domain. These data suggest that the association of PHTH induces allosteric conformational shifts in regions of the kinase domain that are critical for catalysis. Through statistical comparisons of diverse tyrosine kinase sequences, we identify residues unique to BTK that coincide with the experimentally determined PHTH-binding surface on the kinase domain. Our data provide a more complete picture of the autoinhibitory conformation adopted by full-length TEC kinases, creating opportunities to target the regulatory domains to control the function of these kinases in a biological setting.

Keywords: PH domain; kinase; regulation.


Conflict of interest statement

Competing interest statement: A.H.A. has an equity interest in ImmVue Therapeutics, Inc., a company that may potentially benefit from the research results. The terms of this arrangement have been reviewed and approved by Iowa State University in accordance with its conflict of interest policies.

Figures

Fig. 1.
Fig. 1.
HDX-MS localizes PHTH interactions to the kinase domain C-lobe. (A) Structure of the autoinhibited BTK SH3-SH2-kinase fragment (Protein Data Bank [PDB] ID code 4XI2). Peptides showing protection (blue) or exposure (pink) across the time course of HDX are mapped onto the ribbon structure. The peptide showing the most protection (>1 Da) encompasses the αF/αG loop and extends into the G helix (peptides 594 to 608), and peptides that exhibit less protection (0.5 to 1.0 Da) are localized to the αEF/αF loop into the F helix and the β7/β8-DFG strand (peptides 570 to 582 and 529 to 543, respectively). (B) Domain structures for full-length BTK (FL BTK) and the SH3-SH2-kinase fragment. (C) Specific deuterium uptake curves showing HDX differences (DFLDSH3-SH2-kinase, where D is relative deuterium incorporation) for BTK FL (dark blue) and SH3-SH2-kinase (gray). (D) Surface rendering of the BTK structure showing the location (blue) of the peptides that are protected in full-length BTK compared with the SH3-SH2-kinase fragment that lacks the PHTH domain. For the addition of PHTH to BTK kinase domain in trans, the αF/αG loop (blue), as well as the activation segment C terminus and β3/αC loop (lavender), show protection in the presence of PHTH. Experimental parameters and complete peptide deuterium uptake data are provided in Dataset S1.
Fig. 2.
Fig. 2.
NMR spectral changes define selected BTK kinase domain residues that are affected by interaction with PHTH. (A) NMR data for selected kinase domain resonances showing line broadening throughout the titration of BTK PHTH. For each residue, the spectrum with no added PHTH is at the top, and each subsequent titration point (0.5, 1, 2, 3, and 4 equivalents of PHTH) is shown in order below. The asterisk indicates unassigned resonance that undergoes extensive broadening on addition of PHTH. (B) Histogram showing the sum of the intensity ratios (IBTK KD+PHTH/IBTK KD) for backbone amide resonances of the BTK kinase domain (KD at 200 μM) in the presence of 0.5, 1, 2, 3, or 4 molar equivalents of the PHTH domain. Columns are color-coded according to each point in the titration (Inset), and those that are bolded correspond to exchange-broadened residues as described in SI Appendix. All resonances are backbone amides except 421sc (tryptophan side chain).
Fig. 3.
Fig. 3.
PHTH-induced NMR changes mapped onto the BTK kinase domain structure. (A) Residues corresponding to assigned BTK kinase domain resonances that show exchange broadening are shown in red (here and in all other panels) on the inactive structure of BTK kinase domain (PDB ID code 3GEN). The activation loop face and distal surface are labeled, and the gray-shaded area shows the concentration of residues between the activation loop face, the core of the active site, and the distal face. (B) Two views of the surface rendering of the autoinhibited BTK SH3-SH2-kinase structure (PDB ID code 4XI2). The N- and C-lobes of the kinase domain are indicated, and the activation loop is outlined by a dashed line (Top). The distal surface of the kinase domain is shown with the SH3-SH2 region in black ribbon (Bottom). (C) ATP-binding pocket showing kinase domain residues exhibiting spectral changes on the addition of PHTH. AMP-PNP is modeled into the structure based on PDB ID code 2DWB. (D) View of the residues on the distal face of the kinase domain (SH2-linker region in pink). The hydrophobic stack includes W421, L390 (from linker), and Y461 (labeled and shown in ball and stick).
Fig. 4.
Fig. 4.
Contribution of specific BTK kinase domain residues to the PHTH interaction and unique sequence motifs defining BTK evolution. Sequence motifs unique to BTK kinases are shown. In the alignment, columns are highlighted where amino acids are highly conserved in BTK sequences but are nonconserved or biochemically dissimilar in other TEC family sequences. Histograms above the aligned sequences quantify the degree of divergence between BTK and other TEC sequences. Column-wise amino acid and insertion/deletion frequencies in BTK sequences and in other TEC family sequences are indicated in integer tenths, where a 5 indicates an occurrence of 50% to 60% in the given (weighted) sequence set. Kinase secondary structures are annotated above the histograms. Sequence numbering corresponds to the human BTK sequence.
Fig. 5.
Fig. 5.
Combined data from HDX, NMR, and sequence conservation support a model for autoinhibited BTK. (A) Summary of HDX, NMR, and BTK-specific residues. Blue bars beneath the sequence of the BTK kinase domain indicate peptides that exhibit protection from exchange in full-length BTK compared with the SH3-SH2-kinase fragment (dark blue) or for the BTK kinase domain on the addition of excess PHTH domain (light blue). The peptide spanning the β8 strand into the DFG motif is indicated by a light cyan bar to indicate that this peptide shows no change in HDX before 10 min. Amino acids in red correspond to those residues for which NMR resonances undergo exchange broadening on the addition of PHTH to the BTK kinase domain. Asterisks above the sequence indicate BTK-specific residues. A secondary structure for the BTK kinase domain is shown above the primary sequence. (B) Data derived from NMR, HDX, and sequence comparison converge onto the β3/αC loop, activation loop, DFG region, αEF loop, G helix, and αF/αG loop. The blue ribbon represents peptides derived from HDX (dark blue, light blue, and light cyan as in A), red labels and red alpha carbons indicate residues identified by NMR, and BTK-specific residues are depicted in ball-and-stick format on the structure of inactive BTK (3GEN). (C) Model depicting stages of BTK regulation. The fully autoinhibited state, based on the crystal structure of the SH3-SH2-kinase fragment (10) and solution data presented here, consists of the SH3-SH2 region sandwiching the SH2-kinase linker (pink), with the distal side of the kinase domain and the PHTH domain on the opposite activation loop face. The domain structure of full-length BTK is provided above the model. Membrane-associated PIP3 competes with the kinase domain for binding of PHTH, releasing PHTH from its interaction with the kinase domain activation loop face. The crystal structure of the PHTH-kinase fragment (10) suggests that the PHTH domain contacts the N-lobe of the kinase domain in a manner compatible with PIP3 binding and formation of the “Saraste dimer.” The PRR may also release the SH3 domain from the distal side of the kinase domain (8) to promote a shift toward the active kinase. Autophosphorylation will result in activated BTK.

Similar articles

Cited by

References

    1. Andreotti A. H., Joseph R. E., Conley J. M., Iwasa J., Berg L. J., Multidomain control over TEC kinase activation state tunes the T cell response. Annu. Rev. Immunol. 36, 549–578 (2018). - PubMed
    1. Berg L. J., Finkelstein L. D., Lucas J. A., Schwartzberg P. L., Tec family kinases in T lymphocyte development and function. Annu. Rev. Immunol. 23, 549–600 (2005). - PubMed
    1. Cantrell D., Signaling in lymphocyte activation. Cold Spring Harb. Perspect. Biol. 7, a018788 (2015). - PMC - PubMed
    1. Okoh M. P., Vihinen M., Pleckstrin homology domains of tec family protein kinases. Biochem. Biophys. Res. Commun. 265, 151–157 (1999). - PubMed
    1. Saito K., Scharenberg A. M., Kinet J. P., Interaction between the Btk PH domain and phosphatidylinositol-3,4,5-trisphosphate directly regulates Btk. J. Biol. Chem. 276, 16201–16206 (2001). - PubMed

Publication types

MeSH terms

LinkOut - more resources