. 2019 Nov 5;116(45):22609-22618.
doi: 10.1073/pnas.1903765116. Epub 2019 Oct 7.

DNA methyltransferase inhibitors induce a BRCAness phenotype that sensitizes NSCLC to PARP inhibitor and ionizing radiation

Affiliations

DNA methyltransferase inhibitors induce a BRCAness phenotype that sensitizes NSCLC to PARP inhibitor and ionizing radiation

Rachel Abbotts et al. Proc Natl Acad Sci U S A. .

Abstract

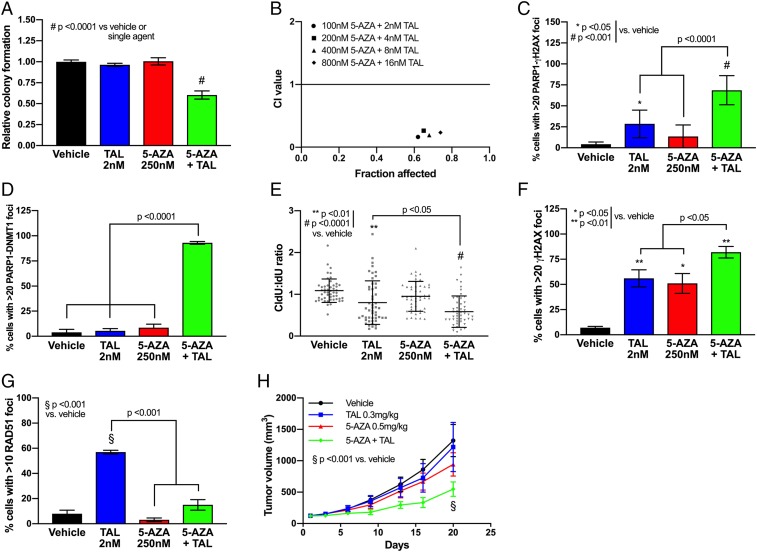
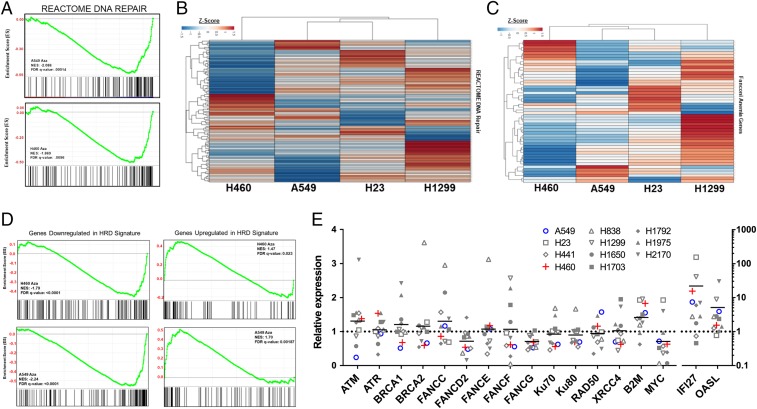
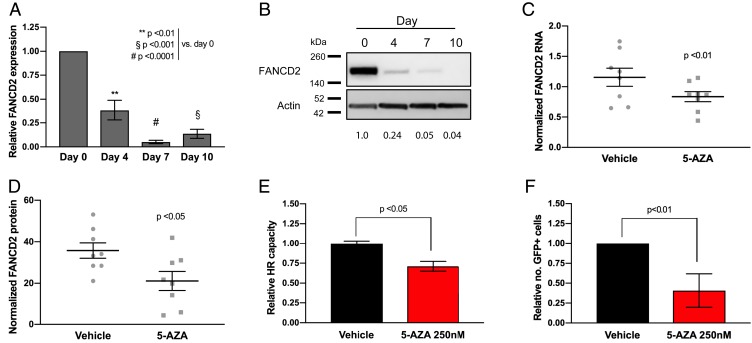
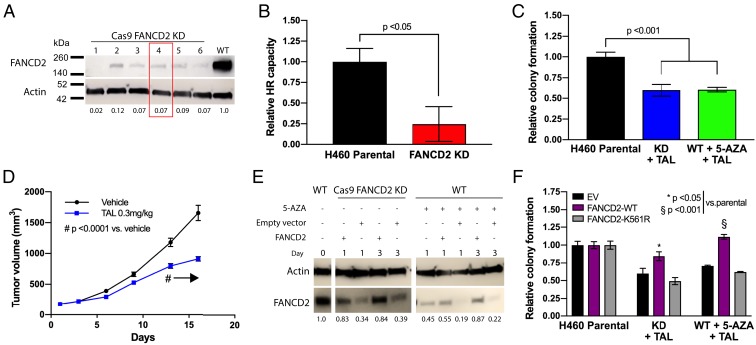
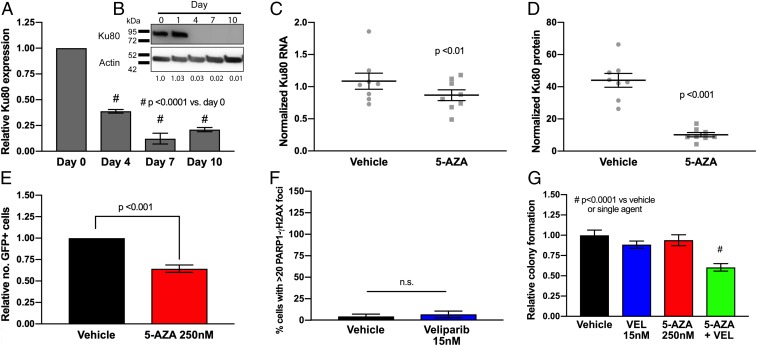
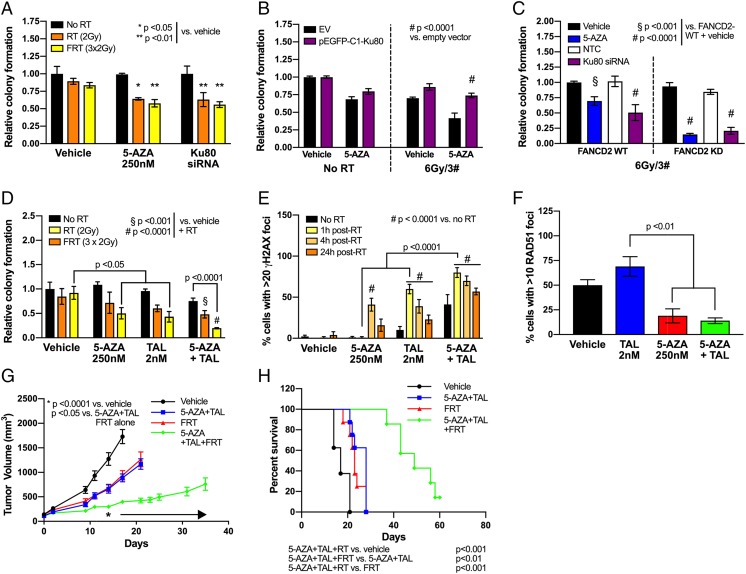
A minority of cancers have breast cancer gene (BRCA) mutations that confer sensitivity to poly (ADP-ribose) polymerase (PARP) inhibitors (PARPis), but the role for PARPis in BRCA-proficient cancers is not well established. This suggests the need for novel combination therapies to expand the use of these drugs. Recent reports that low doses of DNA methyltransferase inhibitors (DNMTis) plus PARPis enhance PARPi efficacy in BRCA-proficient AML subtypes, breast, and ovarian cancer open up the possibility that this strategy may apply to other sporadic cancers. We identify a key mechanistic aspect of this combination therapy in nonsmall cell lung cancer (NSCLC): that the DNMTi component creates a BRCAness phenotype through downregulating expression of key homologous recombination and nonhomologous end-joining (NHEJ) genes. Importantly, from a translational perspective, the above changes in DNA repair processes allow our combinatorial PARPi and DNMTi therapy to robustly sensitize NSCLC cells to ionizing radiation in vitro and in vivo. Our combinatorial approach introduces a biomarker strategy and a potential therapy paradigm for treating BRCA-proficient cancers like NSCLC.

Keywords: DNA repair; homologous recombination defect; lung cancer; nonhomologous end-joining; poly (ADP-ribose) polymerase inhibitors.


Conflict of interest statement

The authors declare no competing interest.

Figures

Fig. 1.
Fig. 1.
Combination treatment with 5-azacytidine and talazoparib produces synergistic cytotoxicity in NSCLC models. (A) Colony forming assay in H460 NSCLC cells in presence of vehicle (DMSO), TAL (2 nM), 5-AZA (250 nM), or combination (day 10, n = 9 from 3 experiments performed in triplicate). Data are represented as mean number of colonies ± SEM. P value is calculated using 1-way ANOVA. (B) Combination index (CI) plot for 5-AZA+TAL in H460 cells (n = 9 from 3 experiments performed in triplicate). (C) Proximity ligation assay for PARP-γH2AX foci formation in H460 following treatment with vehicle (DMSO), TAL (2 nM), 5-AZA (250 nM), or combination (day 4, n = 100 per condition; 25 cells counted per condition from 4 experimental replicates). Data are represented as mean number of cells with >20 PLA foci ± SEM. P value is calculated using 1-way ANOVA. (D) Proximity ligation assay for DNMT1-PARP1 foci formation in H460 following treatment with vehicle (DMSO), TAL (2 nM), 5-AZA (250 nM), or combination (day 4, n = 100 per condition; 25 cells counted per condition from 4 experimental replicates). Data are represented as mean number of cells with >20 PLA foci ± SEM. P value is calculated using 1-way ANOVA. (E) DNA fiber assay in H460 following treatment with vehicle (DMSO), TAL (2 nM), 5-AZA (250 nM), or combination (day 4, n = 50 per condition; 25 fibers measured per condition from 2 experimental replicates). Data are represented as ratio of CldU fiber length to IdU fiber length for individual fiber tracts, overlaid with group mean ± SEM. P value is calculated using 1-way ANOVA. (F) Detection of γH2AX foci in H460 following treatment with vehicle (DMSO), TAL (2 nM), 5-AZA (250 nM), or combination (day 4, n = 100 per condition; 25 cells counted per condition from 4 experimental replicates). Data are represented as mean number of cells with >20 foci ± SEM. P value is calculated using 1-way ANOVA. (G) Detection of RAD51 foci in H460 following treatment with vehicle (DMSO), TAL (2 nM), 5-AZA (250 nM), or combination (day 4, n = 100 per condition; 25 cells counted per condition from 4 experimental replicates). Data are represented as mean number of cells with >20 foci ± SEM. P value is calculated using 1-way ANOVA. (H) Tumor volume in in vivo H460 NSCLC model. H460 xenograft (107 cells per mouse) was delivered via flank injection (n = 8 per group). Treatment with 5-AZA (0.5 mg/kg SC) and/or TAL (0.3 mg/kg PO) was initiated once tumor volume reached 100 mm3 and continued until endpoint. Data are represented as mean external tumor volume ± SEM. P value is calculated using 1-way ANOVA.
Fig. 2.
Fig. 2.
The 5-Azacitidine treatment of NSCLC cell lines significantly down-regulates DNA repair associated genes. (A) Normalized enrichment score plot for REACTOME DNA Repair Pathway derived from preranked GSEA of relative RNA expression in H460 and A549 NSCLC cell lines. (B) Unsupervised hierarchical clustering by Euclidean distance of Z score distribution for relative RNA expression 5-AZA treated over Mock for REACTOME DNA Repair Pathway associated genes in H460, A549, H23, and H1299 NSCLC cell lines. Full gene list with associated Z score is available in SI Appendix, Table S2A. (C) Unsupervised hierarchical clustering by Euclidean distance of Z score distribution for relative RNA expression 5-AZA treated over Mock for Fanconi Anemia Pathway associated genes in H460, A549, H23, and H1299 NSCLC cell lines. Full gene list with associated Z score is available in SI Appendix, Table S2B. (D) Normalized enrichment score plots for HRD gene set derived from preranked GSEA of relative RNA expression in H460 and A549 NSCLC cell lines. (E) Relative RNA expression plot for select DNA repair genes (n = 9 from 3 experimental replicates performed in triplicate). Negative control c-MYC and positive controls B2M, IFI27, and OASL have previously been validated in Topper et al. (53). Above microarray data are derived from reanalysis of publicly deposited data GEO accession no. GSE104244 for NSCLC cell lines (A549, H23, H441, H460, H838, H1299, H1650, H1703, H1792, H1975, and H2170) treated with 500 nM 5-AZA as detailed in Topper et al. (53).
Fig. 3.
Fig. 3.
The 5-Azacytidine induces an FA-associated DNA repair defect. (A) FANCD2 RNA expression in H460 cells following 5-AZA treatment (250 nM). Data are represented as mean expression ± SEM, normalized against pretreatment expression level (n = 12 from 4 experimental replicates performed in triplicate). P value is calculated using 1-way ANOVA. (B) FANCD2 protein immunoblot in H460 cell lysates following 5-AZA treatment (250 nM). Relative protein level normalized against pretreatment level represented by figures under FANCD2 bands. (C) FANCD2 RNA expression in samples from in vivo H460 NSCLC model (n = 8 animals) treated with 5-AZA (0.5 mg/kg SC). Data are represented as mean expression per sample (from 3 experimental replicates performed in triplicate) and normalized against actin, overlaid with group mean ± SEM. P value is calculated using 2-way ANOVA. (D) FANCD2 protein level in samples from H460 in vivo H460 NSCLC model (n = 8 animals) treated with 5-AZA (0.5 mg/kg SC). Data are represented as mean expression (from 3 experimental replicates performed in triplicate) and normalized against actin, overlaid with group mean ± SEM. P value is calculated using 2-way ANOVA. (E) Homologous recombination repair capacity by extrachromosomal assay in H460 cells following 5-AZA treatment (day 7; 250 nM). Data are represented as mean HR capacity normalized against vehicle-treated cells (n = 6 from 3 experimental replicates performed in duplicate) ± SEM. P value is calculated using unpaired Student’s t test. (F) Homologous recombination repair capacity by in vitro DR-GFP flow cytometry in H460 cells following 5-AZA treatment (day 7; 250 nM). Data are represented as mean HR capacity normalized against vehicle-treated cells (10,000 cells analyzed per condition; 4 experimental replicates) ± SEM. P value is calculated using Student’s t test.
Fig. 4.
Fig. 4.
FANCD2 depletion sensitizes NSCLC to talazoparib treatment. (A) Immunoblotting for FANCD2 knockdown (FANCD2-KD) in H460 Cas9/CRISPR clones. Relative protein level normalized against wild-type level represented by figures under FANCD2 bands. Red box indicates clone selected for further studies and in vivo model. (B) Homologous recombination repair capacity by extrachromosomal assay in FANCD2-KD H460 cells. Data are represented as mean HR capacity normalized against vehicle-treated cells (n = 9 from 3 experimental replicates performed in triplicate) ± SEM. P value is calculated using unpaired Student’s t test. (C) Colony forming assay in H460 FANCD2-KD cells in presence of TAL (2 nM) (day 10, n = 9 from 3 experimental replicates performed in triplicate) compared to H460 wild-type cells treated with TAL+5-AZA (250 nM) combination. Data are represented as mean number of colonies ± SEM. P value is calculated using 1-way ANOVA. (D) On study tumor volume in in vivo H460 FANCD2-KD NSCLC model. H460 FANCD2-KD xenograft (107 cells per mouse) was delivered via flank injection (n = 8 per group). Treatment with TAL (0.3 mg/kg PO) was initiated once tumor volume reached 100 mm3 and continued until endpoint. #P < 0.001 from day 13 onward as indicated by arrow. (E) Immunoblotting for FANCD2 in FANCD2-KD or 5-AZA treated (day 4; 250 nM) H460 cells following transfection of FANCD2-wild-type vector or empty vector. Relative protein level normalized against untreated H460 wild-type level represented by figures under FANCD2 bands. (F) Colony forming assay in H460 FANCD2-KD cells or wild-type H460 cells pretreated with 5-AZA (250 nM) for 4 d, followed by transfection with FANCD2-wild-type or FANCD2-mutant vector in presence of TAL (2 nM) (day 10, n = 9 from 3 experimental replicates performed in triplicate). Data are represented as mean number of colonies ± SEM. P value is calculated using 1-way ANOVA.
Fig. 5.
Fig. 5.
The 5-Azacytidine induces a nonhomologous end-joining DNA repair defect in NSCLC. (A) Ku80 RNA expression in H460 cells following 5-AZA treatment (250 nM). Data are represented as mean expression ± SEM, normalized against pretreatment expression level (n = 12 from 4 experimental replicates performed in triplicate). P value is calculated using 1-way ANOVA. (B) Ku80 protein immunoblot in H460 cell lysates following 5-AZA treatment (250 nM). Relative protein level normalized against pretreatment level represented by figures under Ku80 bands. (C) Ku80 RNA expression in samples from in vivo H460 NSCLC model (n = 8 animals) treated with 5-AZA (0.5 mg/kg SC). Data are represented as mean expression (from 3 experimental replicates performed in triplicate) and normalized against actin, overlaid with group mean ± SEM. P value is calculated using 2-way ANOVA. (D) Ku80 protein level in samples from H460 in vivo H460 NSCLC model (n = 8 animals) treated with 5-AZA (0.5 mg/kg SC). Data are represented as mean expression (from 3 experimental replicates performed in triplicate) and normalized against actin, overlaid with group mean ± SEM. P value is calculated using 2-way ANOVA. (E) Nonhomologous end-joining repair capacity by EJ5-GFP flow cytometry in H460 cells following 5-AZA treatment (day 7; 250 nM). Data are represented as mean NHEJ capacity normalized against vehicle-treated cells (10,000 cells analyzed per condition; 4 experimental replicates) ± SEM. P value is calculated using Student’s t test. (F) Proximity ligation assay for PARP1-γH2AX colocalization in H460 cells following treatment with veliparib (day 4, n = 50 per condition; 25 cells counted per condition from 3 experimental replicates). Data are represented as mean number of cells with >20 PLA foci ± SEM. P value is calculated using 1-way ANOVA. (G) Colony forming assay in H460 NSCLC cells in presence of vehicle (DMSO), veliparib (VEL; 15 nM), 5-AZA (250 nM), or combination (day 10, n = 9 from 3 experiments performed in triplicate). Data are represented as mean number of colonies ± SEM. P value is calculated using 1-way ANOVA.
Fig. 6.
Fig. 6.
The 5-Azacytidine–mediated impairment of DSB repair sensitizes NSCLC to combination treatment with talazoparib and radiation. (A) Colony forming assay in H460 cells transfected with Ku80 siRNA or treated with 5-AZA (250 nM), followed by single 2 Gy (RT) or fractionated 3 × 2 Gy (FRT) irradiation (n = 9 from 3 experimental replicates performed in triplicate). Data are represented as mean number of colonies ± SEM. P value is calculated using 1-way ANOVA. (B) Colony forming assay in H460 cells pretreated with 5-AZA (250 nM; 4 d) and nucleofected with Ku80-wild-type or empty vector, followed by fractionated 3 × 2 Gy irradiation (n = 9 from 3 experimental replicates performed in triplicate). Data are represented as mean number of colonies ± SEM. P value is calculated using 1-way ANOVA. (C) Colony forming assay in H460 FANCD2-wild-type or FANCD2-KD cells, pretreated with 5-AZA (250 nM; 4 d) or transfected with Ku80 siRNA (or nontargeting control [NTC]), followed by fractionated 3 × 2 Gy irradiation (n = 9 from 3 experimental replicates performed in triplicate). Data are represented as mean number of colonies ± SEM. P value is calculated using 1-way ANOVA. (D) Colony forming assay in H460 NSCLC cell lines in presence of vehicle (DMSO), TAL (2 nM), 5-AZA (250 nM), or combination, followed by single 2 Gy (RT) or fractionated 3 × 2 Gy (FRT) irradiation (n = 9 from 3 experimental replicates performed in triplicate). Data are represented as mean number of colonies ± SEM. P value is calculated using 1-way ANOVA. (E) Detection of γH2AX foci in H460 after 2 Gy irradiation, following pretreatment with vehicle (DMSO), TAL (2 nM), 5-AZA (250 nM), or combination (day 4; n = 100 per condition; 25 cells counted per condition from 4 experimental replicates). Data are represented as mean number of cells with >20 foci ± SEM. P value is calculated using 1-way ANOVA. (F) Detection of RAD51 foci in H460 at 4 h after 2 Gy irradiation, following treatment with vehicle (DMSO), TAL (2 nM), 5-AZA (250 nM), or combination (day 4, n = 100 per condition; 25 cells counted per condition from 4 experimental replicates). Data are represented as mean number of cells with >20 foci ± SEM. P value is calculated using 1-way ANOVA. (G) Tumor volume in in vivo H460 NSCLC model. H460 xenograft (107 cells per mouse) was delivered via flank injection (n = 8 per group). Treatment with 5-AZA (0.5 mg/kg SC) and TAL (0.3 mg/kg PO) was initiated once tumor volume reached 100 mm3 and continued until endpoint. Fractionated radiation was delivered at days 7, 8, and 9 after initiation of TAL+5-AZA. *P < 0.05 from day 18 onward as indicated by arrow. (H) Kaplan–Meier survival plot of in vivo H460 NSCLC model treated with 5-AZA+TAL and/or fractionated radiation (n = 8 per group).

Comment in

  • Epigenetic targeting of DNA repair in lung cancer.
    Lok BH, Rudin CM. Lok BH, et al. Proc Natl Acad Sci U S A. 2019 Nov 5;116(45):22429-22431. doi: 10.1073/pnas.1916581116. Epub 2019 Oct 29. Proc Natl Acad Sci U S A. 2019. PMID: 31662477 Free PMC article. No abstract available.

References

    1. Lord C. J., Ashworth A., PARP inhibitors: Synthetic lethality in the clinic. Science 355, 1152–1158 (2017). - PMC - PubMed
    1. Murai J., et al. , Trapping of PARP1 and PARP2 by clinical PARP inhibitors. Cancer Res. 72, 5588–5599 (2012). - PMC - PubMed
    1. Ying S., Hamdy F. C., Helleday T., Mre11-dependent degradation of stalled DNA replication forks is prevented by BRCA2 and PARP1. Cancer Res. 72, 2814–2821 (2012). - PubMed
    1. Saleh-Gohari N., et al. , Spontaneous homologous recombination is induced by collapsed replication forks that are caused by endogenous DNA single-strand breaks. Mol. Cell. Biol. 25, 7158–7169 (2005). - PMC - PubMed
    1. Helleday T., The underlying mechanism for the PARP and BRCA synthetic lethality: Clearing up the misunderstandings. Mol. Oncol. 5, 387–393 (2011). - PMC - PubMed

Publication types

MeSH terms

LinkOut - more resources