. 2019 Oct 22;116(43):21715-21726.
doi: 10.1073/pnas.1912858116. Epub 2019 Oct 7.

Molecular profiling predicts meningioma recurrence and reveals loss of DREAM complex repression in aggressive tumors

Affiliations

Molecular profiling predicts meningioma recurrence and reveals loss of DREAM complex repression in aggressive tumors

Akash J Patel et al. Proc Natl Acad Sci U S A. .

Abstract

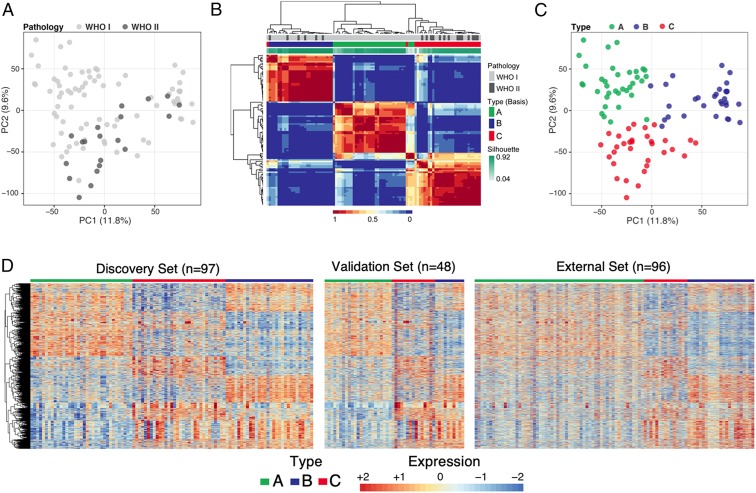
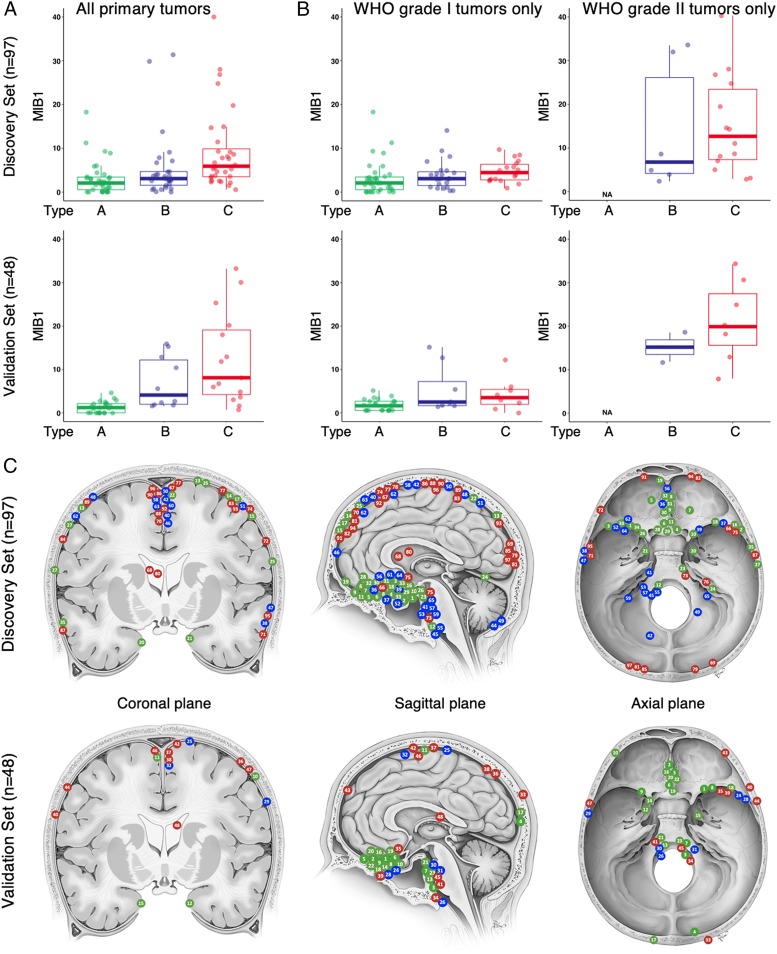
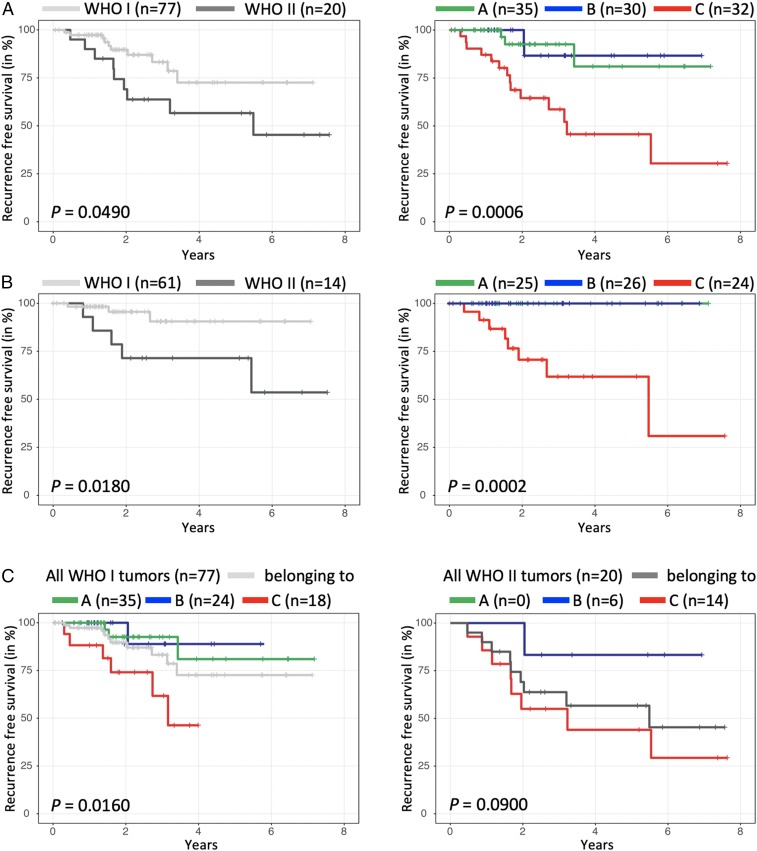
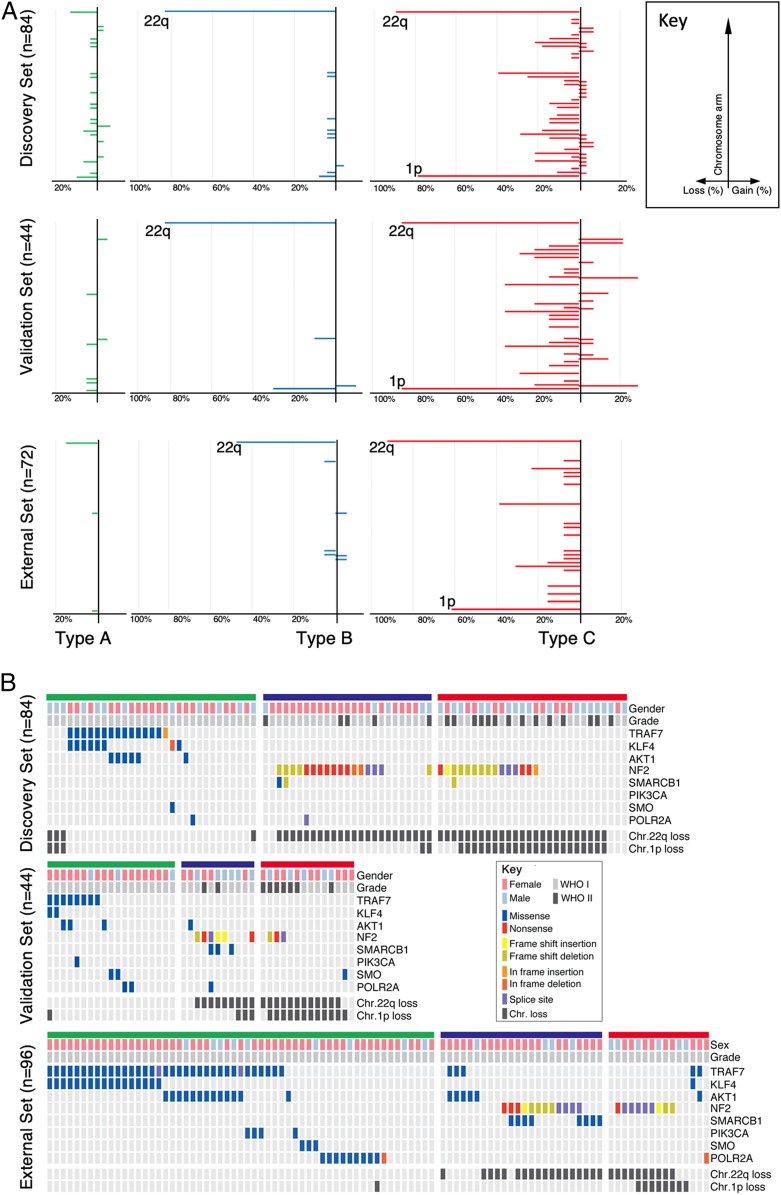
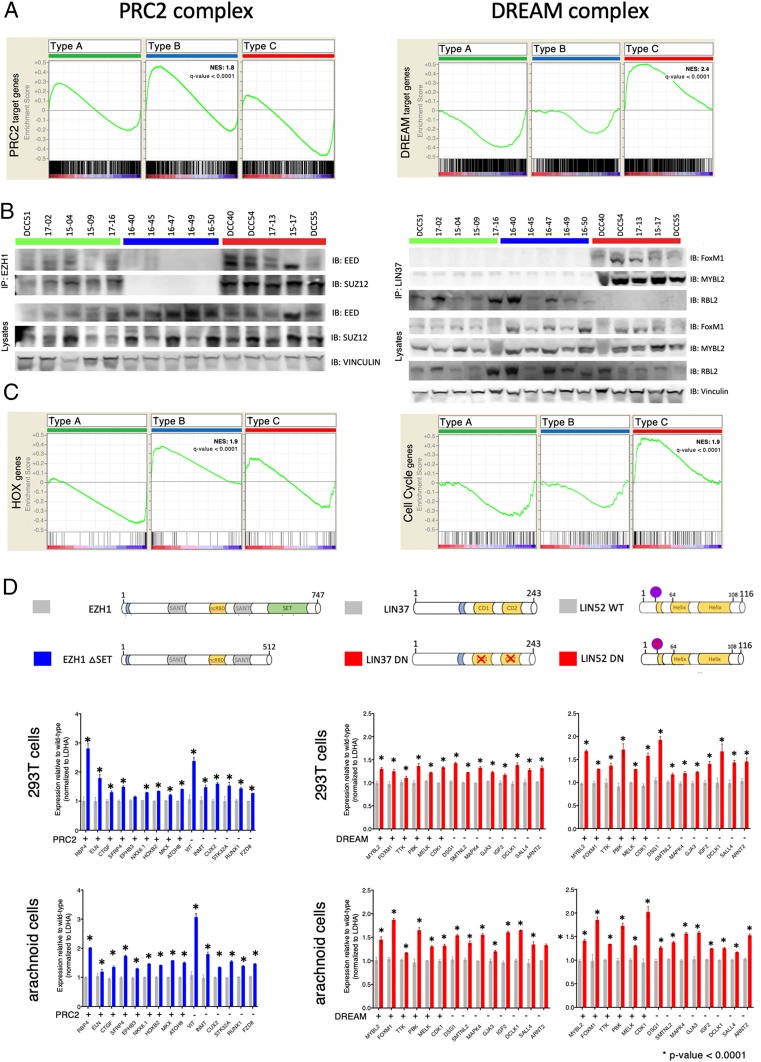
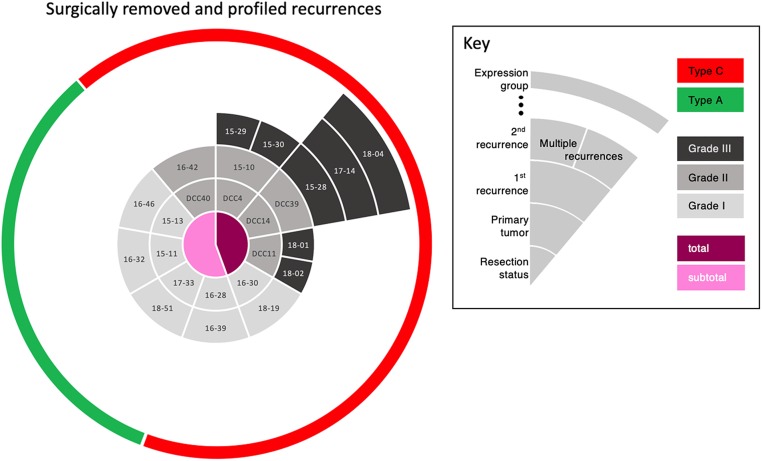
Meningiomas account for one-third of all primary brain tumors. Although typically benign, about 20% of meningiomas are aggressive, and despite the rigor of the current histopathological classification system there remains considerable uncertainty in predicting tumor behavior. Here, we analyzed 160 tumors from all 3 World Health Organization (WHO) grades (I through III) using clinical, gene expression, and sequencing data. Unsupervised clustering analysis identified 3 molecular types (A, B, and C) that reliably predicted recurrence. These groups did not directly correlate with the WHO grading system, which classifies more than half of the tumors in the most aggressive molecular type as benign. Transcriptional and biochemical analyses revealed that aggressive meningiomas involve loss of the repressor function of the DREAM complex, which results in cell-cycle activation; only tumors in this category tend to recur after full resection. These findings should improve our ability to predict recurrence and develop targeted treatments for these clinically challenging tumors.

Keywords: NF2; PRC2; brain tumor; classification; oncogenesis.


Conflict of interest statement

Competing interest statement: S.E.P. is a member of the Scientific Advisory Board for Baylor Genetics.

Figures

Fig. 1.
Fig. 1.
Identification of meningioma subtypes using gene expression profiles. (A) PCA on all genes of 97 tumors colored by WHO grading. WHO grade I tumors are represented by light gray circles; WHO grade II tumors are represented by dark gray circles. (B) Consensus matrix of the tumors for k = 3 from 1,000 runs of NMF analysis depicts 3 distinguishable types based on the gene expression data. (C) PCA on all genes, colored according to molecularly defined types. (D) Expression heat map of the 3,484 genes common in all 3 datasets. The expression patterns of these genes distinguish 3 expression types in our discovery set (Left), validation set (Middle), and publicly available dataset (Right). Type A is labeled in green, type B in blue, and type C in red. Labels in the 2 independent validated sets were predicted using a random forest trained on discovery set.
Fig. 2.
Fig. 2.
Clinical characteristics of gene expression-defined meningioma types. Type A is labeled in green, type B in blue, and type C in red. (A) Boxplots showing the median MIB1 index for types A to C in the discovery set (P = 0.0026, ANOVA, Upper) and the validation set (P < 0.0001, ANOVA, Lower). (B) Boxplot of the MIB1 for types A to C for only WHO grade I tumors (Left) in the discovery set (P = 0.4359, ANOVA, Upper) and the validation set (P = 0.0044, ANOVA, Lower) and WHO grade II tumors (Right) in the discovery set (P = 0.6059, ANOVA, Upper) and the validation set (P = 0.3380, ANOVA, Lower). (C) Location of tumors in our cohort in the discovery set (Upper) and validation set (Lower). Each tumor is marked on 2 views, either coronal and sagittal or axial and sagittal, respectively (Dataset S1). Image created by Katherine Relyea and printed with permission from Baylor College of Medicine.
Fig. 3.
Fig. 3.
RFS of WHO grade and gene expression-defined meningioma types. RFS analysis based on (A) WHO grading (Left) and by expression-defined types (Right) in all tumors and (B) only tumors that underwent complete resection. (C) RFS for expression-defined types within only WHO grade I tumors (Left) or WHO grade II tumors (Right) shows the ability of the molecular typology to refine RFS despite WHO grading. n represents the initial number of tumors for each curve.
Fig. 4.
Fig. 4.
Genomic landscape of meningiomas by gene expression-defined types. Type A is labeled in green, type B in blue, and type C in red. (A) Differences in chromosomal alterations by type are shown with losses to the left and gains to the right. (B) Oncoprint depicting the mutation profiles of each meningioma type in the discovery set (Upper) the internal (Middle) and external validation set (Lower).
Fig. 5.
Fig. 5.
Validation of PRC2 and DREAM complex disruption in type B and C tumors, respectively. (A) GSEA analysis of the PRC2 (Left) and DREAM (Right) target genes from each type. (B, Left) Coimmunoprecipitation studies using 5 tumors per type for EZH1 then probed for anti-EED and anti-SUZ12. (B, Right) Coimmunoprecipitation studies using 5 tumors per type for LIN37 then probed for anti-FoxM1, anti-MYBL2, and anti-RBL2. (C) GSEA analysis shows that HOX genes are enriched in type B (Left) and cell-cycle genes in type C (Right). (D) qRT-PCR analysis measuring expression levels of type-specific up-regulated genes and in 293T and arachnoid cells. (Left) Cells were transfected with either wild-type hEZH1 or hEZH1 ΔSET (dominant-negative EZH1). (Right) Cells were transfected with either wild-type hLIN37 or dominant-negative hLIN37 (left side) or either wild-type hLIN52 or dominant-negative hLIN52 (right side).
Fig. 6.
Fig. 6.
Timeline of tumor recurrences by patient. The central circle indicates whether the resection of the primary tumor was partial (pink) or total (magenta). The second circle identifies the primary tumor by ID number (light gray represents WHO grade I; medium gray is grade II). The third circle identifies the first recurrence, with tone of gray indicating the WHO grade. The remaining segments, all dark gray (grade III), indicate further recurrences over time. The green and red in the rim of the circle denote types A and C, respectively. Strikingly, whereas the WHO classification changes from primary tumor to recurrence in many cases (different shades of gray), the transcriptomic type classification did not—a primary tumor of type C remained type C throughout all recurrences.

References

    1. Ostrom Q. T., et al. , CBTRUS statistical report: Primary brain and central nervous system tumors diagnosed in the United States in 2008-2012. Neuro Oncol. 17 (suppl. 4), iv1–iv62 (2015). - PMC - PubMed
    1. Wiemels J., Wrensch M., Claus E. B., Epidemiology and etiology of meningioma. J. Neuro Oncol. 99, 307–314 (2010). - PMC - PubMed
    1. Pearson B. E., et al. , Hitting a moving target: Evolution of a treatment paradigm for atypical meningiomas amid changing diagnostic criteria. Neurosurg. Focus 24, E3 (2008). - PubMed
    1. Aghi M. K., et al. , Long-term recurrence rates of atypical meningiomas after gross total resection with or without postoperative adjuvant radiation. Neurosurgery 64, 56–60, discussion 60 (2009). - PubMed
    1. Modha A., Gutin P. H., Diagnosis and treatment of atypical and anaplastic meningiomas: A review. Neurosurgery 57, 538–550, discussion 538–550 (2005). - PubMed

Publication types

MeSH terms

Substances