. 2019 Oct 7;10(1):4553.
doi: 10.1038/s41467-019-12444-7.

Rapid selection and identification of functional CD8+ T cell epitopes from large peptide-coding libraries

Affiliations

Rapid selection and identification of functional CD8+ T cell epitopes from large peptide-coding libraries

Govinda Sharma et al. Nat Commun. .

Abstract

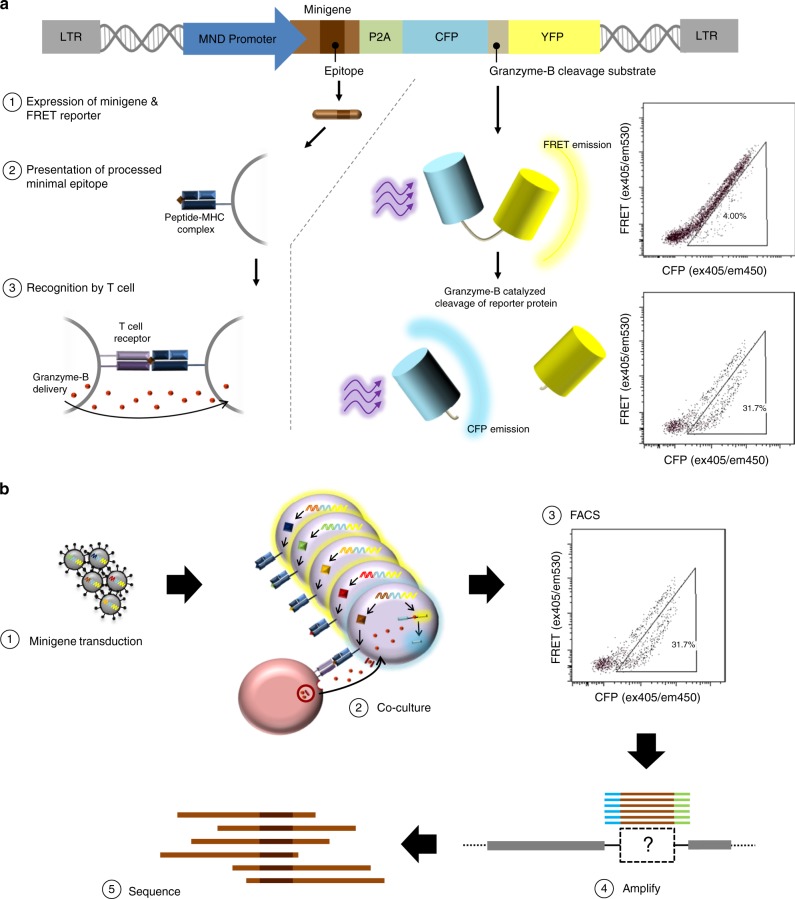
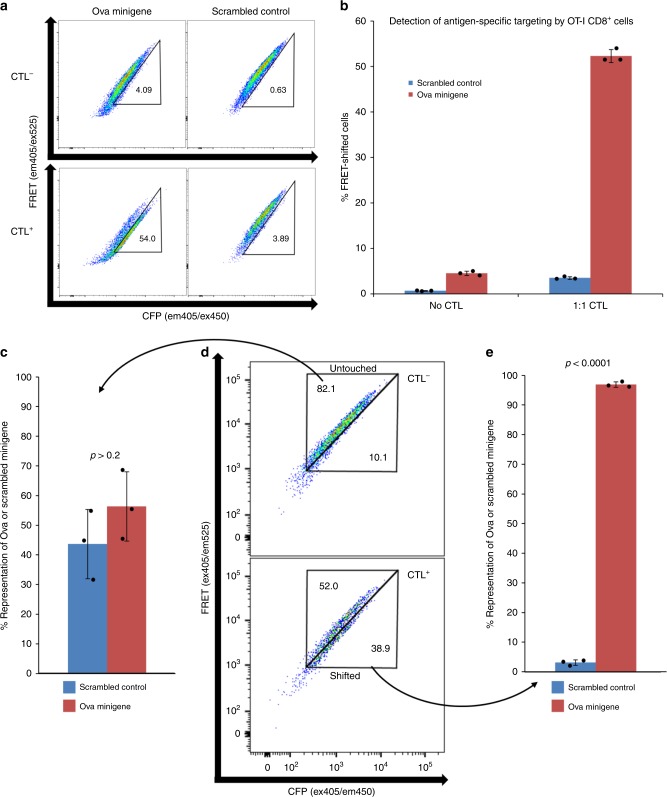
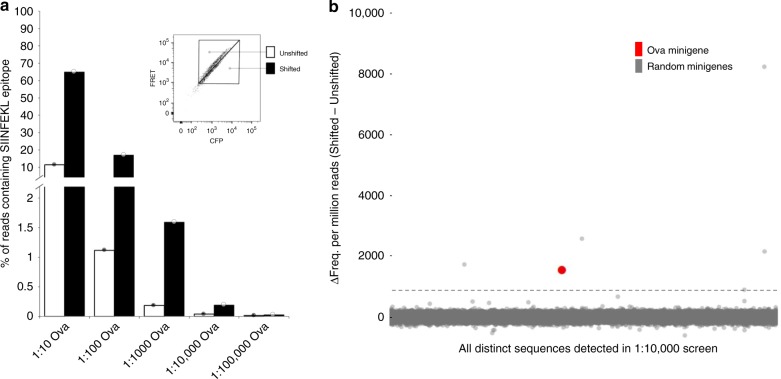
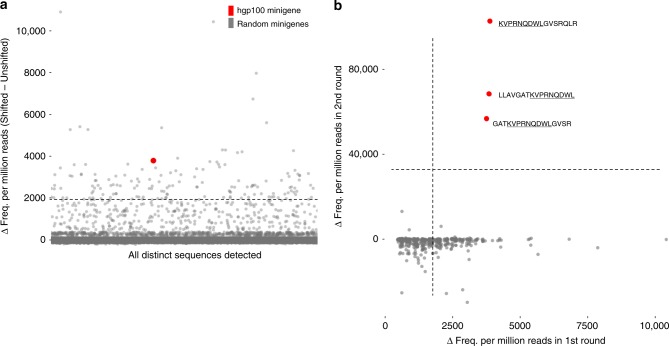
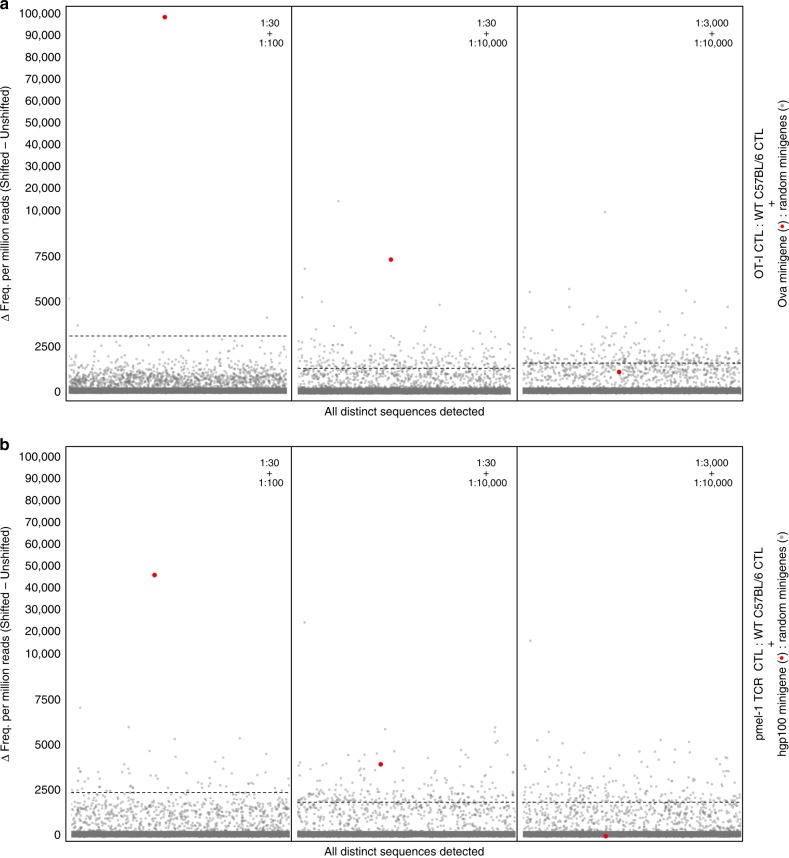
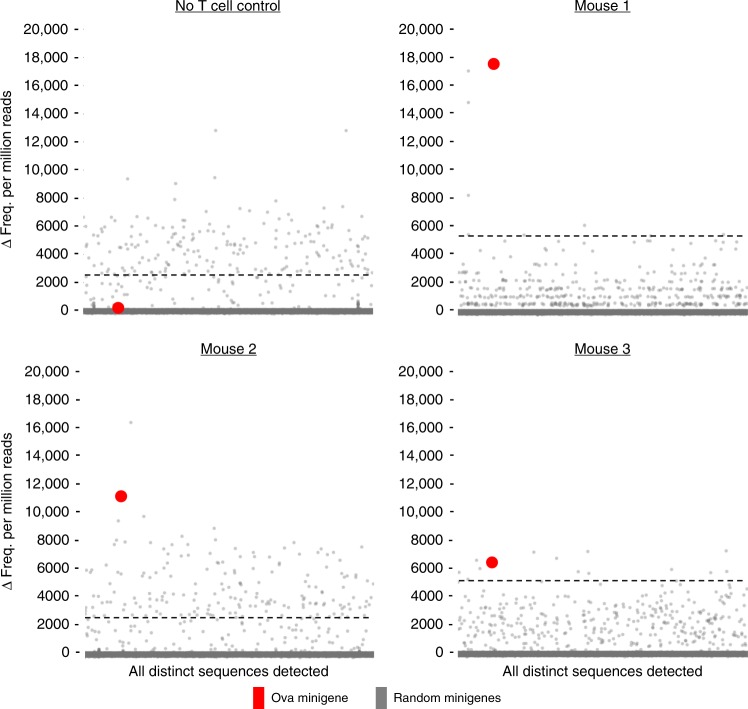
Cytotoxic CD8+ T cells recognize and eliminate infected or malignant cells that present peptide epitopes derived from intracellularly processed antigens on their surface. However, comprehensive profiling of specific major histocompatibility complex (MHC)-bound peptide epitopes that are naturally processed and capable of eliciting a functional T cell response has been challenging. Here, we report a method for deep and unbiased T cell epitope profiling, using in vitro co-culture of CD8+ T cells together with target cells transduced with high-complexity, epitope-encoding minigene libraries. Target cells that are subject to cytotoxic attack from T cells in co-culture are isolated prior to apoptosis by fluorescence-activated cell sorting, and characterized by sequencing the encoded minigenes. We then validate this highly parallelized method using known murine T cell receptor/peptide-MHC pairs and diverse minigene-encoded epitope libraries. Our data thus suggest that this epitope profiling method allows unambiguous and sensitive identification of naturally processed and MHC-presented peptide epitopes.


Conflict of interest statement

G.S. and R.A.H. are named inventors on patent applications, filed by the British Columbia Cancer Agency, encompassing the methods presented here: PCT/CA2015/050230, CA2943569A, and US20180052176A1 (priority date 2014-03-27).

Figures

Fig. 1
Fig. 1
Summary of epitope-screening method. a In the absence of GZMB, the reporter protein emits a resting FRET signature when excited with violet light. Upon entry of GZMB to the cell, the reporter is cleaved. The loss of resting FRET signal combined with the rescue of free CFP signal results in a FRET-shift that can be monitored in FACS to isolate cells undergoing T-cell targeting. b Target cells are provided with libraries of lentivirally delivered short-peptide-coding minigene sequences and exposed to T cells of interest. Any targets recognized by T cells are then subject to GZMB loading and cleavage of their internally expressed FRET reporter. Cells carrying putatively antigenic minigenes are isolated by FACS, minigenes encoded within these cells are recovered by PCR, and the resultant amplicons are characterized by deep sequencing
Fig. 2
Fig. 2
FRET-shift assay testing. a, b ID8 cells expressing either the Ova minigene fragment with native epitope intact (OVAL241-280) or the Ova minigene containing a scrambled epitope (OVAL257-264 SIINFEKL → LKNFISEI) were cultured with or without OT-I CD8+ T cells at a 1:1 ratio for 4 h. a Representative plots of FRET signal (ex405/em525) vs. CFP signal (ex405/em450) and (b) proportions of cells shifting into Targeted gate in all replicates (n = 3, underlaid bar chart and error bars denote mean ± SD) are shown. Significance was determined using an unpaired, one-tailed Student’s t test. Effect size was calculated as the difference of standardized means (Cohen’s effect size). ce Ova minigene-expressing targets or scrambled control cells were combined at a 1:1 ratio to form a binary mixed target population. Mixed targets were co-incubated with OT-I CTL for 4 h at 1:1 effector:target ratio prior to FACS analysis in triplicate for all conditions (underlaid bar chart and error bars denote mean ± SD). Recovered cells were lysed, and genomic DNA was purified and used as a template for qPCR using a custom TaqMan assay. Significance was determined using an unpaired, one-tailed Student’s t test. Source data are provided as a Source Data file
Fig. 3
Fig. 3
OT-I spiked library screening. Random minigene cell libraries spiked with Ova minigene-expressing cells were co-incubated with OT-I CTL at a 1:1 effector:target ratio for 4 h prior to FACS analysis. Recovered cells were lysed and integrated minigenes were amplified from genomic DNA using PCR primers specific for the conserved transgene region flanking the minigene site. Primers with indexed Illumina adapter tails were used for direct sequencing of amplicons on the Illumina MiSeq platform with 2 × 250 paired-end chemistry. a The percentage of reads detected in each gate that encoding the SIINFEKL epitope. Filled circles underlaid with white bars represent Unshifted gate; open circles underlaid with black bars represent Shifted gates. Each point represents one individual measurement. Source data are provided as a Source Data file. b The read count frequency of all unique sequences found in 1:10,000 spike-in sample expressed as the difference between the relative frequency in the Shifted gate and the Unshifted gate. The dashed line represents 10σ above the mean Δ relative abundance value
Fig. 4
Fig. 4
pmel-1 TCR screening against 1:10,000 hgp100 minigene-spiked random library. a Random minigene-expressing EL4 cell library spiked with hgp100 minigene-expressing EL4 cells at an abundance of 1:10,000 were co-incubated with pmel-1 TCR CTL at a 1:1 effector:target ratio for 4 h prior to FRET-shift FACS analysis. Upon recovery and sequencing of minigenes captured in Unshifted and Shifted gates, differences in relative abundance for all distinct minigene sequences were plotted. The dashed line represents 10 σ above the mean Δ relative abundance value. b The top 480 minigenes enriched in the primary screen of pmel-1 TCR CTL vs. a 1:10,000 hgp100-spiked random minigene library were synthesized as a ssDNA oligonucleotide pool and inserted into the pMND-silent-FRET lentiviral transfer plasmid. A pmel-1 TCR panning second-round viral library was produced and delivered into EL4 cells. Transduced and purified panning minigene-expressing EL4 cells were then co-cultured (1:1 E:T, 4 h) with freshly activated and expanded pmel-1 TCR CTL and sorted according to FRET-shift. After minigene recovery by PCR and amplicon sequencing, the relative abundances of each member of the panning library in the primary (x-axis) and secondary (y-axis) screens were plotted. The 16-mer encoding hgp100 minigenes that were included in the synthesized panning library are highlighted and labeled. Dashed lines denote 10σ above the mean Δ relative abundance value
Fig. 5
Fig. 5
Screening co-cultures of mixed CTL populations + mixed target cell populations. Random minigene cell libraries spiked with either Ova minigene-expressing cells or hgp100 minigene-expressing cells were co-incubated with wild-type C57BL/6 CTL spiked with OT-I or pmel-1 TCR CTL, respectively. The specific mixtures used for testing are described in panel headers. Target and CTL populations were combined at a 1:1 ratio and co-cultured for 4 h before being sorted on FRET-shift status. Recovered cells from Shifted and Unshifted gates from each screening condition were lysed, and integrated minigenes were amplified from genomic DNA using PCR primers specific for the conserved transgene region flanking the minigene site. Illumina adapters and indexes were added in a second round of PCR, and resultant amplicons were sequenced on the Illumina MiSeq platform with 2 × 250 paired-end chemistry. a The differences in relative abundance for all distinct minigene sequences detected in the Shifted gates and the Unshifted gates of OT-I/Ova minigene mixtures. b The differences in relative abundance for all distinct minigene sequences detected in the Shifted gates and the Unshifted gates of pmel-1 TCR/hgp100 minigene mixtures
Fig. 6
Fig. 6
FRET-shift/amplicon sequencing using tumor-infiltrating T cells as input effectors. B16F10-Ova tumor masses were engrafted into wild-type C57BL/6 mice and boosted by vaccination with Ova prior to isolation of tumor-infiltrating CD8+ T cells by FACS, further expanded by stimulation with plate-bound anti-CD3/28, and co-cultured with random minigene library cells spiked with Ova minigene-expressing cells at 1:10,000 abundance. Three replicate mice were prepared, and TIL samples from each were independently screened against the spiked library cell population. Limited outgrowth ex vivo of the TIL populations necessitated that co-cultures be conducted at reduced E:T ratios, ranging from 0.5:1 to 0.7:1 across the replicates (4 h length). In parallel to TIL samples, a matched negative control sample was prepared by performing FRET-shift FACS/amplicon sequencing on spiked library target cells that were not subjected to co-culture with any T cells. The Δ relative abundance of all detected minigenes are displayed for the three replicate TIL screens as well as the no-T-cell control. The dashed line represents 10σ above the mean Δ relative abundance value
Fig. 7
Fig. 7
Comparison of our strategy with methods currently in use for T-cell antigen discovery. The methods currently constituting the suite of approaches available currently for T-cell antigen screening as well as our FRET-shift/amplicon-sequencing methodology are mapped with respect to their robustness in detecting T-cell antigens from highly mixed T-cell populations (left) and their ability to screen high-diversity libraries of candidate antigens (right)–,,,–. It will be possible to place the recent methods described by Li et al., Joglekar et al., and Kisielow et al. on these spectra when data are published showing method sensitivity with respect to polyclonality of input T-cell populations and complexity of input antigen libraries

References

    1. Bassani-Sternberg M, Pletscher-Frankild S, Jensen LJ, Mann M. Mass spectrometry of HLA-I peptidomes reveals strong effects of protein abundance and turnover on antigen presentation. Mol. Cell Proteom. 2015;14:658–673. doi: 10.1074/mcp.M114.042812. - DOI - PMC - PubMed
    1. Das DK, et al. Force-dependent transition in the T-cell receptor β-subunit allosterically regulates peptide discrimination and pMHC bond lifetime. Proc. Natl Acad. Sci. USA. 2015;112:1517–1522. doi: 10.1073/pnas.1424829112. - DOI - PMC - PubMed
    1. Wooldridge L, et al. A single autoimmune T cell receptor recognizes more than a million different peptides. J. Biol. Chem. 2012;287:1168–1177. doi: 10.1074/jbc.M111.289488. - DOI - PMC - PubMed
    1. Stone JD, Kranz DM. Role of T cell receptor affinity in the efficacy and specificity of adoptive T cell therapies. Front. Immunol. 2013;4:244. doi: 10.3389/fimmu.2013.00244. - DOI - PMC - PubMed
    1. Sharma G, Holt RA. T-cell epitope discovery technologies. Hum. Immunol. 2014;75:514–519. doi: 10.1016/j.humimm.2014.03.003. - DOI - PubMed

Publication types