. 2019 Oct 7;9(1):14395.
doi: 10.1038/s41598-019-50887-6.

Quantitative 3D measurements of tibial plateau fractures

Affiliations

Quantitative 3D measurements of tibial plateau fractures

N Assink et al. Sci Rep. .

Abstract

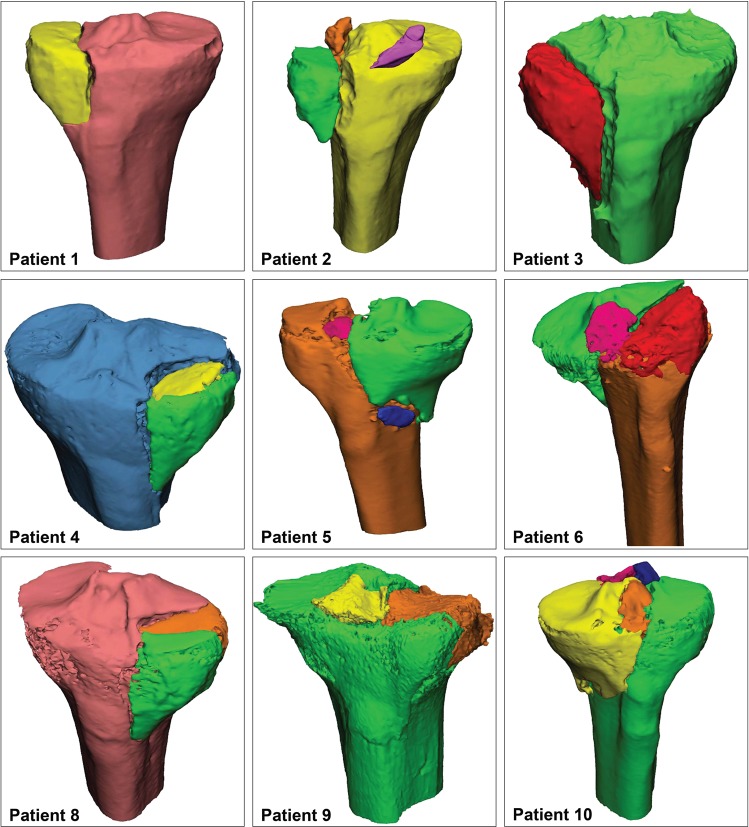
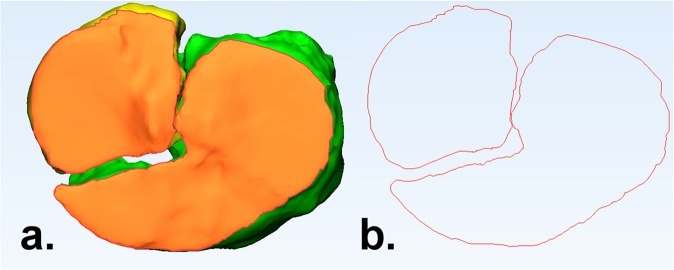
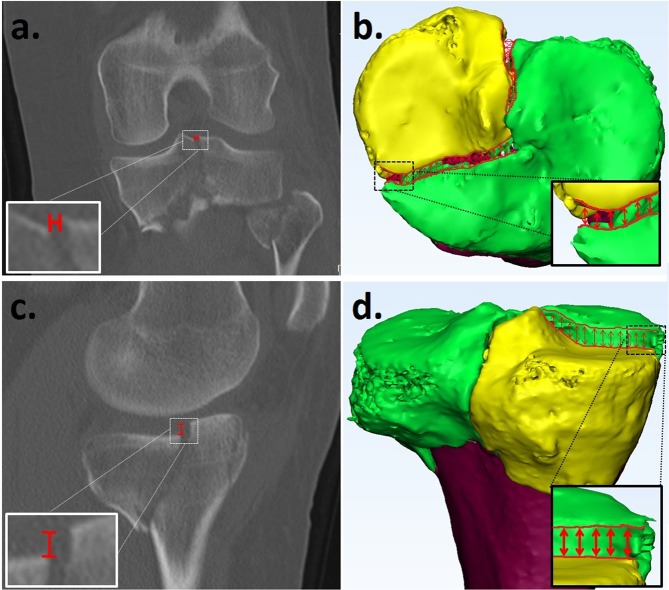
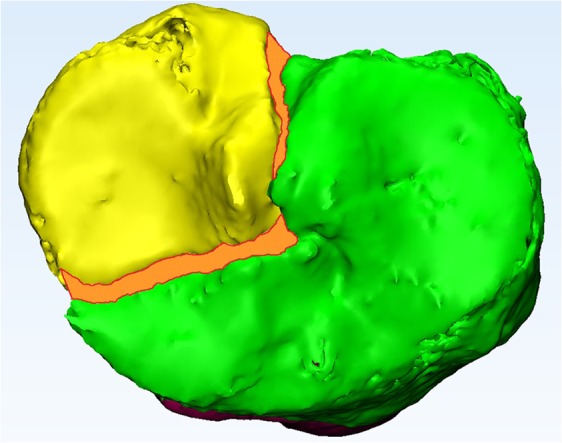
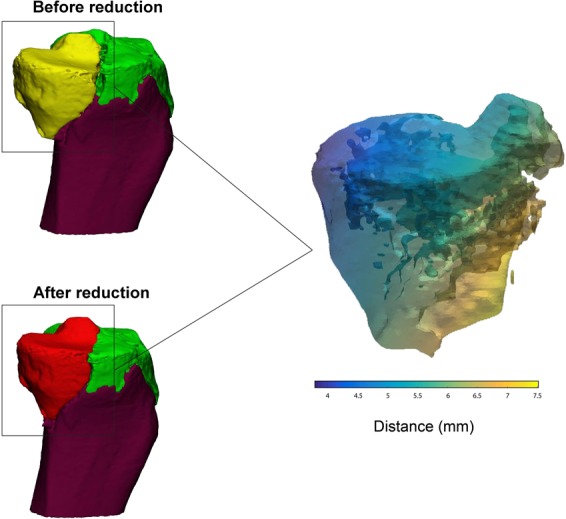
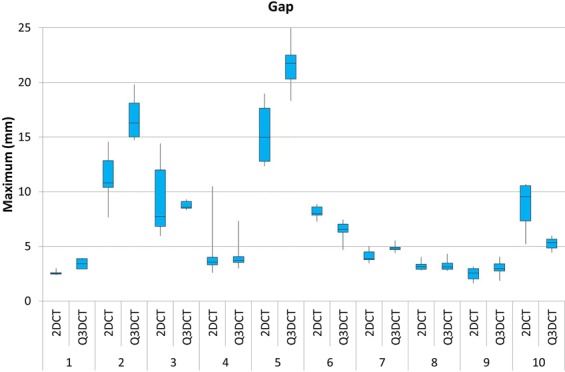
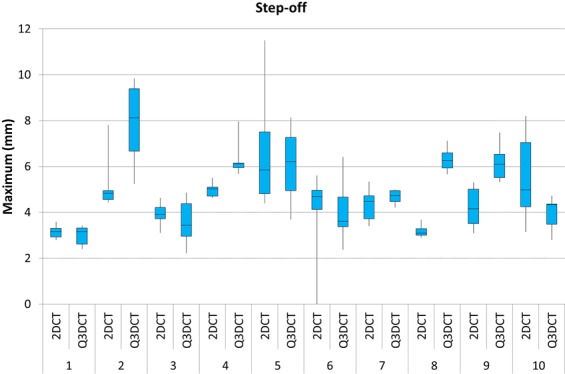
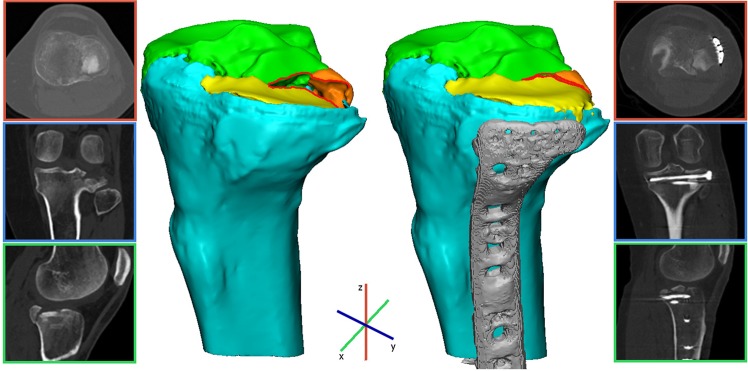
Fracture gap and step-off measurements on 2DCT-slices probably underestimate the complex multi-directional features of tibial plateau fractures. Our aim was to develop a quantitative 3D-CT (Q3DCT) fracture analysis of these injuries. CT-based 3D models were created for 10 patients with a tibial plateau fracture. Several 3D measures (gap area, articular surface involvement, 3D displacement) were developed and tested. Gaps and step-offs were measured in 2D and 3D. All measurements were repeated by six observers and the reproducibility was determined by intra-class correlation coefficients. Q3DCT measurements demonstrated a median gap of 5.3 mm, step-off of 5.2 mm, gap area of 235 mm2, articular surface involvement of 33% and 3D displacement of 6.1 mm. The inter-rater reliability was higher in the Q3DCT than in the 2DCT measurements for both the gap (0.96 vs. 0.81) and step-off (0.63 vs. 0.32). Q3DCT measurements showed excellent reliability (ICC of 0.94 for gap area, 1 for articular surface involvement and 0.99 for 3D displacement). Q3DCT fracture analysis of tibial plateau fractures is feasible and shows excellent reliability. 3D measurements could be used together with the current classification systems to quantify the true extent of these complex multi-directional fractures in a standardized way.


Conflict of interest statement

The authors declare no competing interests.

Figures

Figure 1
Figure 1
3D reconstructions of all the patients except for patient 7. This patient is used to illustrate the Q3DCT measurements in Figs 2–4.
Figure 2
Figure 2
(a) The articular surface, in terms of the top axial view of the tibial plateau, is marked orange; (b) The contour of the articular surface, demonstrating the fracture pattern.
Figure 3
Figure 3
Gap measurement from a 2DCT slice (a) and a Q3DCT model (b). Step-off measurement on 2D (c) and Q3DCT. (d) The 2DCT slices had to be scrolled to find the maximum gap and step-off. The Q3DCT has the advantage that the gap and step-off could be measured between all points along the fracture lines within the same plane providing a maximum and a mean 3D value of both parameters.
Figure 4
Figure 4
Measurement of the gap area (mm2), which is marked as the orange surface area between the fracture lines.
Figure 5
Figure 5
Measurement of the 3D displacement (mm). Left: fragment of the tibial plateau fracture before (yellow) and after (red) reduction. Right: distance map representing the difference in the fragment’s position before and after the reduction (3D displacement). The colour corresponds with the severety of the displacement, whereby yellow represents a relatively big displacement and blue represents a relatively small displacement.
Figure 6
Figure 6
A boxplot showing the dispersion of the maximum gap measurements from 2DCT slices in comparison to our 3DCT measurements, performed by six different observers for all the patients.
Figure 7
Figure 7
A boxplot showing the dispersion of the maximum step-off measurements from 2DCT slices compared to to our Q3DCT method, performed by six different observers for all patients.
Figure 8
Figure 8
These images represent a clinical case in which we demonstrate the application of the quantitative 3D fracture measurements. Pre- and postoperative 3D assessment of a patient who was operated on a Schatzker 3 tibial plateau fracture. A 3D model of the pre-operative CT scan displayed a mean 3D gap of 0.5 mm, a step-off of 3.3 mm, a gap area of 27 mm2 with an articular surface involvement of 32.5% consisting of 3 fracture fragments. An open reduction and plate osteosynthesis was performed. A 3D model of the postoperative CT scan demonstrated an anatomical reduction of the fracture with a 20% decrease in the mean 3D gap (0.5 mm pre vs 0.4 mm postoperative), an 85% decrease in the mean 3D step-off (3.3 mm pre vs 0.5 mm postoperative), and a 10% decrease in the gap area (27 mm2 pre vs 24 mm2 postoperative).

References

    1. Court-Brown CM, Caesar B. Epidemiology of adult fractures: A review. Injury. 2006;37:691–697. doi: 10.1016/j.injury.2006.04.130. - DOI - PubMed
    1. Agnew SG. Tibial plateau fractures. Oper. Tech. Orthop. 1999;9:197–205. doi: 10.1016/S1048-6666(99)80018-4. - DOI
    1. Millar SC, Arnold JB, Thewlis D, Fraysse F, Solomon LB. A systematic literature review of tibial plateau fractures: What classifications are used and how reliable and useful are they? Injury. 2018;49:473–490. doi: 10.1016/j.injury.2018.01.025. - DOI - PubMed
    1. Müller, M. E. Müller AO Classification of Fractures—Long Bones. AO Foundation (1987).
    1. Schatzker, J., McBroom, R. & Bruce, D. The tibial plateau fracture. The Toronto experience 1968–1975. Clin. Orthop. Relat. Res. 94–104 (1979). - PubMed