. 2019 Dec;4(12):2164-2174.
doi: 10.1038/s41564-019-0568-5. Epub 2019 Oct 7.

Escherichia coli limits Salmonella Typhimurium infections after diet shifts and fat-mediated microbiota perturbation in mice

Affiliations

Escherichia coli limits Salmonella Typhimurium infections after diet shifts and fat-mediated microbiota perturbation in mice

Sandra Y Wotzka et al. Nat Microbiol. 2019 Dec.

Abstract

The microbiota confers colonization resistance, which blocks Salmonella gut colonization1. As diet affects microbiota composition, we studied whether food composition shifts enhance susceptibility to infection. Shifting mice to diets with reduced fibre or elevated fat content for 24 h boosted Salmonella Typhimurium or Escherichia coli gut colonization and plasmid transfer. Here, we studied the effect of dietary fat. Colonization resistance was restored within 48 h of return to maintenance diet. Salmonella gut colonization was also boosted by two oral doses of oleic acid or bile salts. These pathogen blooms required Salmonella's AcrAB/TolC-dependent bile resistance. Our data indicate that fat-elicited bile promoted Salmonella gut colonization. Both E. coli and Salmonella show much higher bile resistance than the microbiota. Correspondingly, competitive E. coli can be protective in the fat-challenged gut. Diet shifts and fat-elicited bile promote S. Typhimurium gut infections in mice lacking E. coli in their microbiota. This mouse model may be useful for studying pathogen-microbiota-host interactions, the protective effect of E. coli, to analyse the spread of resistance plasmids and assess the impact of food components on the infection process.


Conflict of interest statement

Competing Interests statement

The authors declare no competing financial interests.

Figures
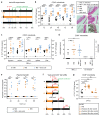
Figure 1
Figure 1. A shift to WD and oleic acid gavage promote S.Tm blooms, enteropathy and plasmid transfer.
(a) Experimental protocol. (b-d) Pathogen loads and cecum tissue histopathology of CONE mice infected with 5x10⁷ CFU S.Tm by gavage (N=6,10,11). Non-infected controls 96h after diet-shift or oleic acid gavage (grey symbols; N=6; no CFU detected). See 'Histological procedures' in Methods for details of pathological score. H&E images represent median sample from corresponding treatment. (e) In vivo transconjugation was determined by stool plating (N=7,8; Kruskal-Wallis test, multiple comparison correction; see figure S6). (f) Protocol of back-and-forth diet-shifts in CONE mice. (g) Fecal pathogen loads were analyzed 24h p.i. with 5x10⁷ CFU S.Tm (by gavage; N=5,6,8,9 mice). Bars: median; Two-way ANOVA on log-normalized data with Dunnett's multiple comparison test (for b,c,g), two-tailed Mann-Whitney-U (for d). Dotted lines = detection limit. ns, not significant (p > 0.05), *p < 0.05, **p < 0.01, ***p < 0.005, ****p < 0.001. MD: maintenance diet, WD: Western-type diet.
Figure 2
Figure 2. Primary bile salts can explain S.Tm blooms.
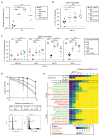
(a) Quantitative cholate mass spectrometry analysis in CONE mice (N=5) 9h after the indicated intervention. (b) Cholate titration experiment. CONE mice (N=5,6,7) were gavaged as indicated (100μl) 1h before and 4h after S.Tm infection (5x10⁷ CFU). (c) Effect of the indicated interventions on gut luminal S.Tm densities (N=8,9). Control: CONE mice pre-treated with streptomycin (20 mg by gavage; 24h before infection; grey). (d) Cholate sensitivity of gut-luminal microbiota from ileum (N=2), cecum (N=3) and colon (N=2) microbiota (isolated from CONE mice) and of wt S.Tm (black circles; N=3) or indicated S.Tm mutants (N=3). Analysis was performed by SYTOXgreen-exclusion and flow cytometry (exemplary gating for S. TmtolC is shown). The mean value of all experiments is shown (whiskers = range). (e) Cholate-sensitivity of individual microbiota strains as analyzed in MGAM medium (2% H2, 12% CO2, 86% N2; table S3; N=3, analysis vs. growth without inhibitor). Controls: Wt E. coli ED1a, indicated S.Tm strains. Bars: median; Two-way ANOVA on log-normalized data with Dunnett's multiple comparison test. Dotted lines = detection limit. ns, not significant (p > 0.05), *p < 0.05, **p < 0.01, ***p < 0.005, ****p < 0.001.
Figure 3
Figure 3. Modeling and experimental data validate that bile-resistance promotes S.Tm growth in the fat-exposed gut.
(a,b) Mathematical model testing if bile-mediated growth inhibition can explain S.Tm vs. S.TmarcAB blooms after 24h of growth in the fat-, oleic acid- or cholate exposed gut (as detailed in Supplementary Information). (c,d) Competitive infections. CONE mice (N=7,8,9) were treated as above and infected with S.Tmwt and S.TmacrAB (1:1; 5x10⁷ CFU total, by gavage). S.Tm loads were quantified by plating. (d) The competitive index of S.Tmwt vs. S.TmacrAB as analysed by WITS-qPCR. (e) Total S.Tmwt or S.TmacrAB loads in CONE mice (C57BL/6, N=5) infected as in figure 1a and analysed by plating 24h p.i. Bars: median; Two-way ANOVA on log-normalized data with Dunnett's multiple comparison test. Dotted lines = detection limit. *p<0.05, **p<0.01, ***p<0.005, ****p<0.001.
Figure 4
Figure 4. E. coli limits the S.Tm infection after WD-shift or oleic acid gavage.
(a-c) Competitive infection with the E. coli mix. CONE mice (N=7,8,9,10,17) were treated as in figure 1a and infected with wt S.Tm and the E. coli 8178, CFT073 and Z1324 mix, as indicated (5x10⁷ CFU by gavage). (a,b) E. coli and S.Tm loads were determined by plating. (c) Cecum histopathology 96h p.i.. H&E images represent median sample from corresponding treatment. (d) Competitive infection with E. coli 8178. CONE mice (N=9,15) were treated as above and gavaged with E. coli 8178 and S.Tm, as indicated (5x10⁷ cfu). Triangles: control mice re-plotted from (b). #: none detected; Bars: median; ns, not significant (p > 0.05), *p < 0.05, **p < 0.01, ***p < 0.005, ****p < 0.001, Two-way ANOVA on log-normalized data with Dunnett's multiple comparison test (for b,d), two-tailed Mann-Whitney U-test (for c). Dotted lines: detection limit.

References

    1. Stecher B, Berry D, Loy A. Colonization resistance and microbial ecophysiology: using gnotobiotic mouse models and single-cell technology to explore the intestinal jungle. FEMS microbiology reviews. 2013;37:793–829. doi: 10.1111/1574-6976.12024. - DOI - PubMed
    1. David LA, et al. Diet rapidly and reproducibly alters the human gut microbiome. Nature. 2014;505:559–563. doi: 10.1038/nature12820. - DOI - PMC - PubMed
    1. Desai MS, et al. A Dietary Fiber-Deprived Gut Microbiota Degrades the Colonic Mucus Barrier and Enhances Pathogen Susceptibility. Cell. 2016;167:1339–1353 e1321. doi: 10.1016/j.cell.2016.10.043. - DOI - PMC - PubMed
    1. Barthel M, et al. Pretreatment of mice with streptomycin provides a Salmonella enterica serovar Typhimurium colitis model that allows analysis of both pathogen and host. Infect Immun. 2003;71:2839–2858. - PMC - PubMed
    1. Brugiroux S, et al. Genome-guided design of a defined mouse microbiota that confers colonization resistance against Salmonella enterica serovar Typhimurium. Nat Microbiol. 2016;2 doi: 10.1038/nmicrobiol.2016.215. 16215. - DOI - PubMed

Publication types